


Services on Demand
Article
 English (pdf)
 Article in xml format
 Article references
Indicators

Related links
-
 Cited by Google
 -
 Similars in Google
Share

 Permalink
Journal of the Southern African Institute of Mining and Metallurgy
On-line version ISSN 2411-9717
Print version ISSN 2225-6253
J. S. Afr. Inst. Min. Metall. vol.119 n.3 Johannesburg Mar. 2019
http://dx.doi.org/10.17159/2411-9717/2019/v119n3a1
PROFESSOR DICK MINNITT SPECIAL EDITION
A stochastic cut-off grade optimization model to incorporate uncertainty for improved project value
J. Githiria; C. Musingwini
University of the Witwatersrand, South Africa
SYNOPSIS
Cut-off grade is a decision-making criterion often used for determining the quantities of material (ore and waste) to be mined, ore processed, and saleable product. It therefore directly affects the cash flows from a mining operation and the net present value (NPV) of a mining project. A series of different cut-off grades that are applied over the life of mine (LOM) of an operation defines a cut-off grade policy. Due to the complexity of the calculation process, previous work on cut-off grade calculation has mostly focused on deterministic approaches. However, deterministic approaches fail to capture the uncertainty inherent in input parameters such as commodity price and grade-tonnage distribution. This paper presents a stochastic cut-off grade optimization model that extends Lane's deterministic theory for calculating optimal cut-off grades over the LOM. The model, code-named 'NPVMining', uses realistic grade-tonnage realizations and commodity price distribution to account for uncertainty. NPVMining was applied to a gold mine case study and produced an NPV ranging between 7% and 186% higher than NPVs from deterministic approaches, thus demonstrating improved project value from using stochastic optimization approaches.
Keywords: optimization, cut-off grade policy, deterministic approach, heuristic approach, stochastic approach, grade-tonnage realization, uncertainty
Background on cut-off grade calculation and optimization
Cut-off grade is a decision-making criterion that is generally used in mining to distinguish ore from waste material. Consequently, it is used to determine the quantities of material (ore and waste) to be mined, ore processed, and saleable product. A series of different cut-off grades that are applied over the life-of-mine (LOM) of a mining operation defines the cut-off grade policy for that particular operation. The cut-off grade therefore directly affects the cash flows to be produced and the net present value (NPV) of a project at the mine planning or feasibility study stage.
Pioneering work on cut-off grade calculation can be attributed to Mortimer's (1950) work on grade control for gold mines in South Africa. Although Mortimer's work is given relatively little recognition, it established the fundamental principle that not only must rock at the lowest grade cover its cost of extraction, but that the average grade of the rock must provide a certain minimum profit per ton processed.
Later in the 1960s, work on cut-off grade calculation again appeared, including that published by Henning (1963), Lane (1964), and Johnson (1969). Lane (1988) subsequently published an updated version of his 1964 work as a comprehensive book on the use of cut-off grade to economically define ore using NPV as a proxy for value. To date, it is Lane's work on value-based cut-off grade optimization that has received the most attention among the mining fraternity. Lane's work placed more emphasis on optimizing cut-off grade in order to improve the economic viability of mining projects and operations. The cut-off grade algorithm developed by Lane (1964, 1988) was more elaborate than others as it took into account constraints associated with the capacities of the mine, mill, and market, resulting in the derivation of six potential cut-off grades from which an optimal cut-off grade could be selected. Three of the six cut-off grades are described as limiting cut-off grades while the other three are denoted as balancing cut-off grades. Limiting cut-off grades are derived by assuming that each of the three stages (mining, processing, and refining) is an individual and independent constraint on throughput due to production capacity limitations, operating costs, and price attributable to the output product. Balancing cut-off grades are determined by assuming that two out of the three stages are concurrently operating at their capacity limits.
Despite its fairly comprehensive structure, Lane's cut-off grade optimization algorithm had some shortcomings. For example, it could not be used to determine cut-off grades for polymetallic deposits. This shortcoming is now addressed through the concept of net smelter return (NSR) for evaluating polymetallic deposits, as for example in the work of Shava and Musingwini (2018) who developed an NSR model for a zinc, lead, and silver mine. Shava and Musingwini (2018) then related the NSR values to the applicable cut-off grades for each of the three constituent metals. Table I summarizes some studies that have attempted to address different shortcomings in Lane's cut-off grade theory.
Despite making improvements to Lane's original cut-off grade theory, the models in Table I are deterministic and therefore fail to capture the economic, technical, and geological uncertainties that mining operations continually face. The uncertainties include those associated with commodity price and grade-tonnage distribution. Due to this shortcoming, the NPVs generated from these models are sub-optimal. There is, therefore, a need for a stochastic cut-off grade optimization approach that can capture uncertainty in parameters such as commodity price and grade-tonnage distribution. This challenge had been long-recognized in other studies not related to Lane's framework, but which attempted to use other stochastic and/or dynamic programming (DP) approaches to address the challenge.
Stochastic and dynamic programming approaches to cut-off grade
Several studies that have applied stochastic and/or DP approaches in the calculation of cut-off grades have incorporated the dynamic nature of input parameters. Table II summarizes some studies that have attempted to address uncertainty in parameters for cut-off grade determination.
The studies summarized in Table II, except for the model by Asad and Dimitrakopoulos (2013), were not based on Lane's framework and tended to consider only one input parameter as being stochastic. The study presented in this paper therefore extended Lane's algorithm to develop a stochastic cut-off grade model by concurrently considering variability in both commodity price and grade-tonnage distribution. The model that was developed is code-named 'NPVMining'.
Modifications to Lane's cut-off grade theory for the stochastic NPVMining model
Lane's theoretical framework is premised on a schematic material flow as illustrated in Figure 1. Depending on the applicable cut-off grade, material from the mine can be classified as waste and sent to the waste dump; as ore and sent for milling in the processing plant; or as low-grade material and sent to a stockpile for processing later during the LOM. The milling process produces a concentrate which is sent to the refinery to produce the final saleable product, which is then marketed.

The production capacities of the different stages in the mining complex are denoted by M, C, and R, for the mining, milling, and refinery capacities, respectively. Lane's framework uses the notations in Table III. The input parameters in Table III were then modified to account for variability as explained in the following sections.

Given a set of equally probable grade-tonnage curves (w), the stochastic approach develops a cut-off grade policy by determining the cut-off grade (G) from time periods 1 to N. The NPV of future cash flows is maximized subject to mining, processing, and refining capacity constraints. The objective function for the cut-off grade optimization remains unchanged from Lane's original formulation, as represented by Equation [1].

where d is the discount rate and Pwiis the cash flow generated in period i by extracting the orebody based on a grade-tonnage curve w.
However, the cash flow equation changes to incorporate the uncertainty of both the metal price and grade-tonnage distribution in the orebody, as indicated in Equation [2].

Using the optimum cut-off grades obtained in the algorithm for the given grade-tonnage curve w, a yearly production schedule that shows the cut-off grade, quantity mined (QmW), quantity processed (QcW), quantity refined (QrW), profit, and NPV is calculated. Figure 2 illustrates the steps involved in the algorithm used in this research study.

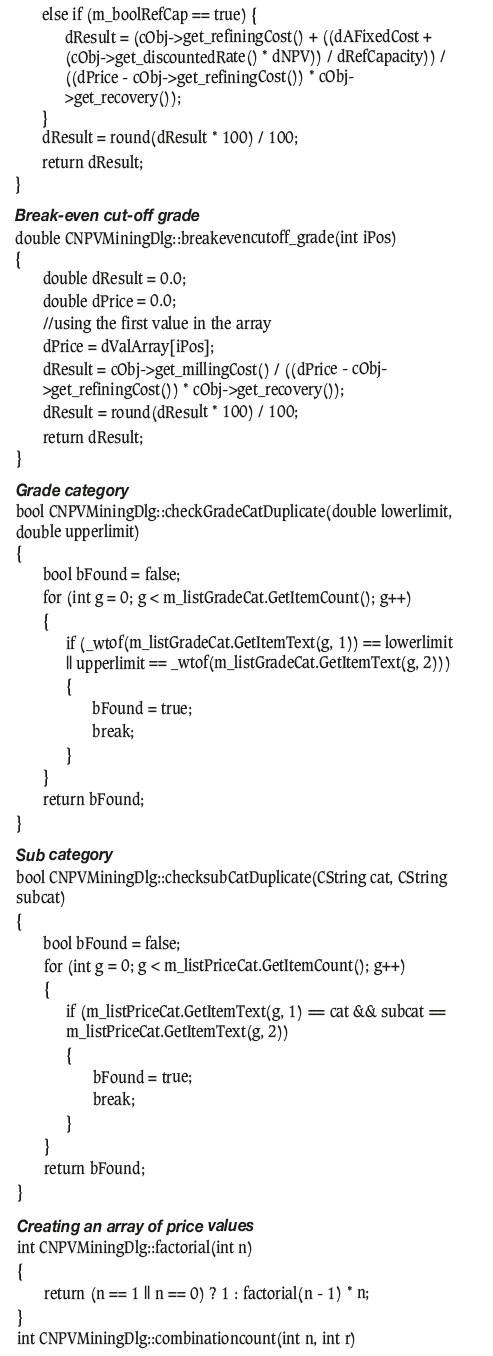
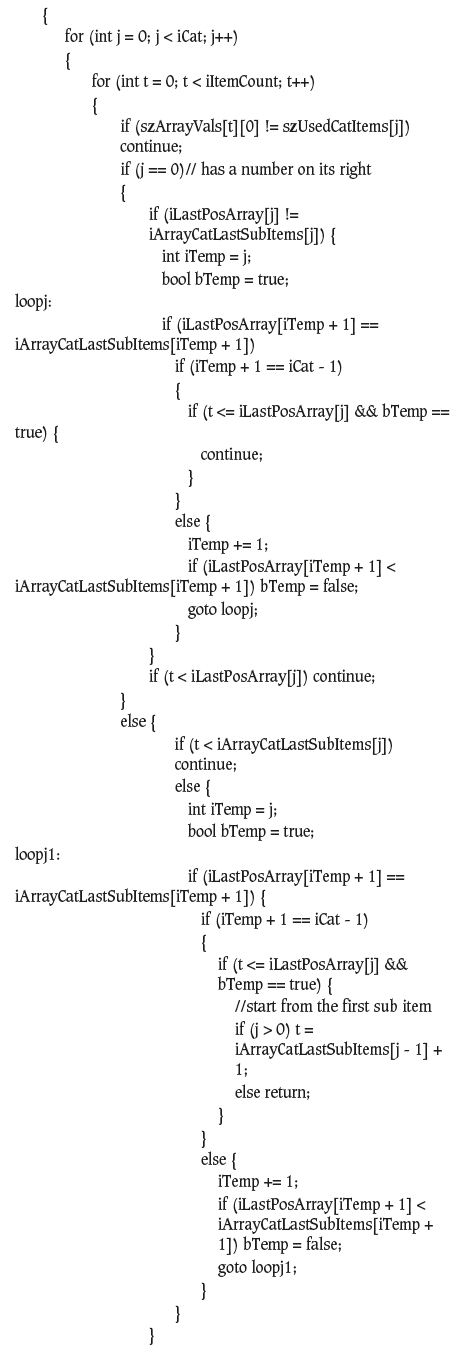
The algorithm developed from Figure 2 was coded using the C++ programming language in Microsoft Visual Studio 2017 Integrated Development Environment (IDE) on a standard computer to produce the application code-named 'NPVMining'. The code for NPVMining is given in Appendix 1. The application is an executable file and will run on computers that run applications with .exe extension. The computer must have Visual Studio 2017 and Microsoft Office 2013 installed on it.
Microsoft Visual Studio 2017 (VC++) supports two versions of the C++ programming language, which are the ISO/ANSI standard C++, and C++/CLI (Common Language Infrastructure). C++/CLI has a highly-developed design capability that enables the assembly of the entire graphical user interface (GUI), and the code that creates it being generated automatically (Githiria, Muriuki, and Musingwini, 2016). The C++ programming language was used in the implementation of the algorithm to enable the execution of the application on Windows-based computers with different architectures and/or platforms. This compatibility aspect enables easy portability of the application to make it usable by mine planners working on different computing platforms. The output from the model is easily exported to Microsoft Excel 2013 for comparison and analysis.
The flow diagram in Figure 2 was then modelled as follows:
i. Identify the methods of data entry for the grade-tonnage curves, commodity price, and costs.
ii. Develop software to input the grade-tonnage curves, commodity price, and costs variations and run tests for validation.
iii. Implement the algorithm for calculating cut-off grade and NPV using the inputs provided.
iv. Test and validate the output and provide the output in a format that will display the results appropriately. Mathematical functions of commodity price against time were applied in the above procedure. A random number generator was developed to generate values within a specified range so that input values are stochastic but within realistic ranges.
General steps in the NPVMining stochastic algorithm
The steps to determine a cut-off grade policy as outlined by Lane (1964), but modified as illustrated in Figure 2 to incorporate uncertainty in NPVMining, are as follows (Githiria, 2018):
1. Formulate multiple realizations of grade-tonnage distribution for the entire deposit.
2. Input the parameters to be used in the cut-off grade policy, such as the mining capacity (M), milling capacity (C), refining capacity (R), selling price (P), mining cost
(m), milling cost (c), refining cost (r), recovery (y), annual fixed costs (f ), and discount rate (d ).
3. Introduce variability in the input parameters (metal price and grade-tonnage).
4. Determine the optimum cut-off grade to be used in year i using the cut-off grade equations. If the initial NPVi is not known set the NPVi to zero.
5. Determine the tons of ore (qoW), tons of waste (qwW), and average grades of the ore associated w the optimum cut-off grade (gWg). Set: QcW= C if qoWis greater than the milling capacity (C), otherwise QcW= qow. Using Equations {3]-[7], calculate the quantity to be mined (Qm) and refined (Qr). Find the limiting capacity and the mine life ( N) from the following:

6. Determine the yearly profit using Equation [8].

7. Compute the NPV using the formula below by discounting the profits at a given discount rate ( d) for the time calculated as the LOM.

This value of V becomes the second approximation of V (the first was V=0) for use in the formulae to calculate the optimum cut-off grade.
8. Repeat the computation from step 5 until the value, V, converges.
9. Adjust the grade-tonnage distribution by subtracting the ore tons from the grade-tonnage distribution intervals above the optimum cut-off grade (G) and the waste tons ( QmW - QcW) from the intervals below the optimum cut-off grade ( G) in proportionate amounts. This is to ensure that the distribution remains unchanged, otherwise it will change to a different grade-tonnage distribution. For each of the multiple realizations of the grade-tonnage distribution the current grade-tonnage curve being used at that specific period will be altered simultaneously. This will cater for the intertemporal dependencies that alter the gradetonnage distribution with time.
10. If it is the first iteration then, knowing the profits obtained in each year, find the yearly NPV by discounting back those profits and go to step 4. If it is the second iteration, then stop.
11. Use the net present values obtained in step 10 as the initial NPV for each of the corresponding years for the second iteration.
Brief description of NPVMining
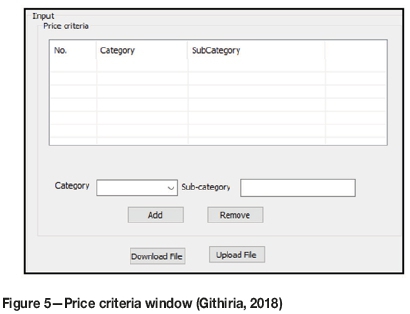
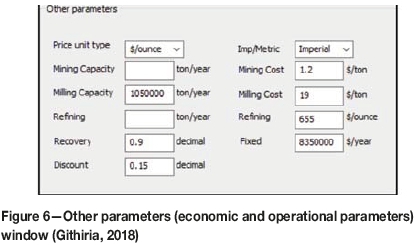
NPVMining caters for: (i) economic and operational parameters, (ii) grade-tonnage distribution, and (iii) the cut-off grade policy or production schedule as shown in Figure 3. One of the source files, NPVMiningDlg.cpp, contains the code that executes the algorithm through the user interface. Appendix 1 contains the code for NPVMining. The input parameters (price and costs) used in the calculations are uploaded to the application using Microsoft Excel® spreadsheets. Other parameters are entered into the user interface via the dialog boxes. The metal price variability is obtained from factoring either a fixed or geometric range. After calculating the optimum cut-off grade, a cut-off grade policy is generated showing the three main economic indicators: annual profit, NPV, and LOM. The NPVMining user interface has five dialog boxes: (i) grade category window (Figure 4), (ii) price criteria window (Figure 5), (iii) other parameters window (Figure 6), (iv) limiting capacity selection window (Figure 7), and (v) cut-off grade calculation window (Figure 7).


The grade-tonnage distribution, economic and operational parameters are the input data used in the computer-aided application. The grade-tonnage distribution is entered into the grade category window as shown in Figure 4. The grade category input window has several dialog boxes describing the lower grade limit, upper grade limit, and quantity of ore per increment for the multiple realizations.
The economic and operational parameters are keyed on the user interface using the price criteria and other parameters window as shown in Figures 5 and 6. This data is uploaded using Microsoft Excel® worksheets containing technical data, while other data is entered in the dialog box as required. This process simplifies data entry, which is tiresome if done manually. The two input windows in Figures 5 and 6 have several dialog boxes that represent economic and operational parameters such as metal price, mining cost, milling cost, refining cost, mining capacity, processing capacity, refining capacity, recovery, discount rate, and fixed cost.
The break-even cut-off grade and Lane's limiting cut-off grade are selected and calculated as shown in Figure 7, and the output is displayed in the output window as shown in Figure 8. The main economic indicators of the project (annual profit, NPV, and LOM) are displayed on the user interface. After clicking the 'calculate' button, the results of the cut-off grade policy calculations are displayed in the output window and generated on an Microsoft Excel® spreadsheet as shown in Figure 8. The spreadsheet consists of seven main columns: optimum cut-off grade, quantity of material to be mined (Qm), quantity of ore to be milled (Qc), quantity of product refined (Qr), mine life, annual profit, and NPV. The resultant cut-off grade policy is exported to Microsoft Excel® for ease of use and interpretation.

The NPVMining application was tested on the data-set for a case study of the McLaughlin gold mine, which is a defunct gold mine in northern California, USA. The data-set was obtained from the mining library compiled by Espinoza et al. (2012) for research purposes. This data-set was selected because it has previously been used in other cut-off grade optimization studies, therefore allowing comparison of the output from NPVMiningwith those studies.
Description of the McLaughlin gold mine case study data-set
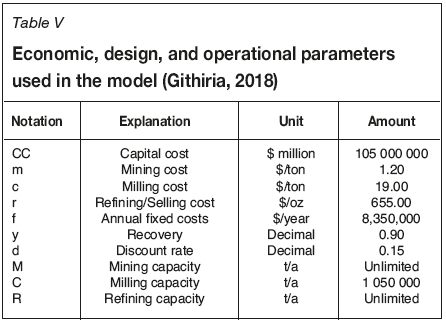
Tables IV and V provide the simulated grade-tonnage distribution and the economic, design, and operational parameters, respectively, for the McLaughlin gold mine case study. Table VI provides the price variations used in the calculations.

Six grade-tonnage curves (GTC1 to GTC6) for the McLaughlin deposit, as illustrated in Table IV, were used to determine balancing cut-off grades as described in Lane's cut-off grade theory (Lane, 1964, 1988). The grade-tonnage curve data was used to calculate the ratios and cumulative values in relation to the different stages in a mining complex. Over-estimation or under-estimation of the grade, volume, or tonnage and other parameters related to a deposit is common in most conventional and deterministic orebody models. This is detrimental to the planning of the mining operation, which consequently leads to loss of profits. There are several statistical methods for measuring uncertainty of the orebody in relation to the geological characteristics. Stochastic approaches are employed to characterize the geological uncertainty by modelling and estimating the orebody more reliably. This study employed the Monte Carlo method to simulate the grade-tonnage distribution of the orebody. It used statistical and graphical techniques, including linear and nonlinear modelling, to simulate the probable distribution of the data. It is evident from the simulated multiple realizations of the orebody that the tonnages decrease with increasing grade ranges.
The McLaughlin mining operation case study incorporates a mine, processing plant, and waste dump, following the three main stages presented in Figure 1, excluding the stockpiling option. The mine produces sulphide and oxides ores mixed with waste material in controlled quantities. The ore goes through several processing stages such as gravity concentration, flotation, and leaching. In the subsequent refining step, the gold is recovered from solution and the waste material is sent to the waste dump. The operation is assumed to have an unrestricted potential to mine and refine/market the annual gold production, while the processing capacity is set to be at 1.05 Mt/a of ore (Table V). Gold price uncertainty applied in this study was assumed to have a range (2% per period) that is increasing yearly, as shown in Table VI, to be within the generally accepted long-term gold price of around US$1300 per ounce.
Results from the application of NPVMining to the McLaughlin gold mine case study
The stochastic cut-off grade model (NPVMining) is used to calculate the optimum cut-off grade that maximizes NPV in the shortest mine life possible using the price variations in Table VI and the grade-tonnage curves in Table IV. A summary of the best-case scenario showing the calculated NPV for six equally probable grade-tonnage curves and a range of metal prices is generated as shown in Table VII. The resultant cut-off grade policies from the model shows a significant difference between the minimum and maximum NPV generated through the equally probable grade-tonnage curves. The resultant cut-off grade policies generate the optimal NPV in approximately 9 years for the six grade-tonnage curves. The application (NPVMining) also generates possible outcomes in relation to the change in gold price. The six possible outcomes for each price category generate different outcome as shown in Table VII. The resultant cut-off grade policies are generated by varying the grade-tonnage curves for all mineable ore in every grade interval and the metal prices against time. The solution was generated in 14.45 seconds after running the NPVMining code on Microsoft Visual Studio 2017.

The relationship between NPV and the metal price was modelled using a linear regression approach (Figures 9 and 10). The linear regression model shown in Figure 9 is applied to identify the relationship between NPV and the response variables (metal price) when all the other variables in the model are held fixed. The correlation coefficient in the relationship between metal price and NPV is about 0.97, indicating that metal price variation has a high significance for the NPV.

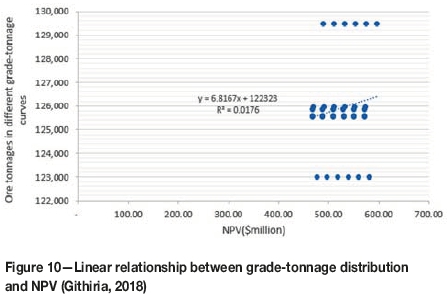
The relationship between NPV and the other parameter (grade-tonnage distribution) when all the other variables in the model are held fixed is shown in Figure 10. The correlation coefficient in the relationship between grade-tonnage distribution and NPV is about 0.13, indicating that grade-tonnage distribution has a low impact on NPV.
Comparison of NPVMining to other cut-off grade approaches
In deterministic cut-off grade optimization approaches applied in the mining industry, the outcomes are determined through known parameters without any room for random variation. This limits the flexibility of a mine plan in cases where commodity price and operational costs fluctuate through the LOM. However, the self-adaptation in stochastic algorithms contributes greatly to their ability to address successfully most complex real-world problems. This is due to their strategic outlook on mining problems that allows them to be easily applied to complex mining situations. Table VIII summarizes the results of a comparison conducted between NPVMining and the following cut-off grade approaches:
(i) Break-even cut-off grade model (Githiria and Musingwini, 2018)
(ii) Cut-off Grade Optimiser (Githiria and Musingwini, 2018)
(iii) OptiPit® (Dagdelen and Kawahata, 2008)
(iv) Maptek Evolution® (Myburgh, Deb, and Craig, 2014).
Table VIII shows that NPVMininggenerated the highest NPV. Compared to the other cut-off grade approaches, NPVMiningproduced results that were:
> 7% better than the Cut-off Grade Optimiser
> 35% better than OptiPit®
> 13% better than Maptek Evolution®.
The superior NPV generated by NPVMiningcan be attributed to its incorporation of stochasticity of input parameters, which is not incorporated in the other models. This demonstrates that superior results are obtained by incorporating uncertainty into Lane's cut-off grade theory.
Conclusion
The stochastic NPVMiningmodel was applied to a gold mine case study data-set to ascertain its benefits in an operational mine. NPVMiningwas used to generate six cut-off grade policies, indicating that a change in grade-tonnage distribution has an overall effect on NPV. A comparison between NPVMiningand other cut-off grade optimization models demonstrated and validated the efficiency of the model. Using an Intel dual-core processor running at 3.00GHz and with 4.00GB RAM, the model generated results for each simulation within 5 seconds. The improvements in NPV generated by NPVMiningranged between 7% and 186%, demonstrating the value of using stochastic approaches to cut-off grade optimization. Ignoring the commodity price and geological uncertainties in daily mining operations may have very serious negative economic implications for a mining project.
Acknowledgment
The work reported in this paper is part of a PhD research study in the School of Mining Engineering at the University of the Witwatersrand. The financial support obtained from the Julian Baring Scholarship Fund (JBSF) for the PhD study is greatly acknowledged.
References
Asad, M.W.A. 1997. Multi mineral cut-off grade optimization with option to stockpile, MSc thesis. Colorado School of Mines, Golden, CO. [ Links ]
ASAD, M.W.A. 2002. Development of generalized cut-off grade optimisation algorithm for open pit mining operations. Journal of Engineering and Applied Sciences, vol. 21, no. 2. pp. 119-127. [ Links ]
Asad, M.W.A. 2005. Cut-off grade optimisation algorithm with stockpiling option for open pit mining operations of two economic minerals. International Journal of Surface Mining, Reclamation and Environment, vol. 19, no. 3. pp. 176-187. [ Links ]
Asad, M.W.A. 2007. Optimum cut-off grade policy for open pit mining operations through net present value algorithm considering metal price and cost escalation. Engineering Computations, vol. 24, no. 7. pp. 723-736. [ Links ]
Asad, M.W.A. and Dimitrakopoulos, R. 2013. A heuristic approach to stochastic cut-off grade optimisation for open pit mining complexes with multiple processing streams. Resources Policy, vol. 38. pp. 591-597. [ Links ]
Cetin, E. and Dowd, P.A. 2002. The use of genetic algorithms for multiple cut-off grade optimisation. Proceedings of the 32nd International Symposium on Application of Computers and Operations Research in the Mineral Industry (APCOM). Society for Mining, Metallurgy & Exploration, Littleton, CO. pp. 769-779. [ Links ]
Cetin, E. and Dowd, P.A. 2013. Multi-mineral cut-off grade optimization by grid search. Journal of the Southern African Institute of Mining and Metallurgy, vol. 113, no.8. pp. 659-665. [ Links ]
Cetin, E. and Dowd, P.A. 2016. Multiple cut-off grade optimization by genetic algorithms and comparison with grid search method and dynamic programming. Journal of the Southern African Institute of Mining and Metallurgy, vol. 116, no.7. pp. 681-688. [ Links ]
Dagdelen, K. 1992. Cut-off grade optimisation. Proceedings of the 23rd International Symposium on Application of Computers and Operations Research in the Minerals Industry (APCOM). Society for Mining, Metallurgy & Exploration, Littleton, CO. pp. 157-165. [ Links ]
Dagdelen, K. 1993. An NPV optimisation algorithm for open pit mine design. Proceedings of the 24th International Symposium on Application of Computers and Operations Research in the Mineral Industry, Montreal, Quebec, Canada. Canadian Institute of Mining, Metallurgy and Petroleum, Montreal. pp. 257-263. [ Links ]
Dagdelen, K. and Kawahata, K. 2008. Value creation through strategic mine planning and cut-off grade optimization, Mining Engineering, vol. 60, no. 1. pp. 39-45. [ Links ]
Dowd, P.A. 1976. Application of dynamic and stochastic programming to optimise cut-off grades and production rates. Transactions of the Institution of Mining and Metallurgy, Section A: Mining Technology, vol. 85, no. 1. pp 22-31. [ Links ]
Espinoza, D., Goycoolea, M., Moreno, E., and Newman, A. 2012. MineLib: a library of open pit mining problems. Annals of Operations Research, vol. 206. pp. 93-114. [ Links ]
Gholamnejad, J. 2008. Determination of the optimum cut-off grade considering environmental cost. Journal of International Environmental Application and Science, vol. 3, no. 3. pp.186-194. [ Links ]
Gholamnejad, J. 2009. Incorporation of rehabilitation cost into the optimum cut-off grade determination. Journal of the Southern African Institute of Mining and Metallurgy, vol. 108, no. 2. pp. 89-94. [ Links ]
Githiria, J.. 2018. A stochastic cut-off grade optimisation algorithm. PhD thesis, University of the Witwatersrand, South Africa. [ Links ]
Githiria, J., Muriuki, J., and Musingwini, C. 2016. Development of a computer-aided application using Lane's algorithm to optimise cut-off grade. Journal of the Southern African Institute of Mining and Metallurgy, vol. 116, no. 11. pp. 1027-1035. [ Links ]
Githiria, J. and Musingwini, C. 2018. Comparison of cut-off grade models in mine planning for improved value creation based on NPV. Proceedings of the 6th Regional Conference of the Society of Mining Professors (SOMP), Johannesburg, South Africa. Southern African Institute of Mining and Metallurgy, Johannesburg. pp. 347-362. [ Links ]
Henning, U. 1963. Calculation of cut-off grade. Canadian Mining Journal, vol. 84, no. 3. pp. 54-57. [ Links ]
Johnson, T.B. 1969. Optimum open-pit mine production scheduling. A Decade of Digital Computing in the Mineral Industry. Weiss A. (ed.). AIME, New York, pp. 539-562. [ Links ]
King, B. 2001. Optimal mine scheduling policies. PhD thesis, Royal School of Mines, Imperial College, London University, UK. [ Links ]
King, B. 2011. Optimal mining practice in strategic planning. Journal of Mining Science, vol. 47, no. 2. pp. 247-253. [ Links ]
Krautkraemer, J.A. 1988. The cut-off grade and the theory of extraction. Canadian Journal of Economics, vol. 21, no. 1. pp. 146-160. http://doi:10.2307/135216 [ Links ]
Lane, K.F. 1964. Choosing the optimum cut-off grade. Colorado School of Mines Quarterly, vol. 59, no. 4. pp. 811-829. [ Links ]
Lane, K.F. 1988. The Economic Definition of Ore: Cut-off Grade in Theory and Practice. Mining Journal Books, London. [ Links ]
Li, S., Yang, C., and Lu, C. 2012. Cut-off grade optimization using stochastic programming in open-pit mining. Proceedings of the Sixth International Conference on Internet Computingfor Science and Engineering, Henan, China. IEEE, New York. pp. 66-69. doi:10.1109/ICICSE.2012.24 [ Links ]
Mortimer, G. 1950. Grade control. Transactions of the Institution of Mining and Metallurgy, vol. 59. pp. 1-43. [ Links ]
Myburgh, C.A., Deb, K., and Craig, S. 2014. Applying modern heuristics to maximising net present value through cut-off grade optimisation. Proceedings of Orebody Modelling and Strategic Mine Planning Symposium, Perth, WA. Australasian Institute of Mining and Metallurgy, Melbourne. pp. 155-164. [ Links ]
Osanloo, M., Rashidinejad, F., and Rezai, B. 2008. Incorporating environmental issues into optimum cut-off grades modeling at porphyry copper deposits. Resources Policy, vol. 33, no. 4. pp. 222-229. [ Links ]
Shava, P. and Musingwini, C. 2018. A net smelter return model for a polymetallic deposit. Proceedings of the 6th Regional Conference of the Society of Mining Professors: Overcoming Challenges in the Mining industry through Sustainable Mining Practices, Johannesburg, South Africa, 12-13 March 2018. Southern African Institute of Mining and Metallurgy, Johannesburg. pp. 279-291. [ Links ]
Taylor, H.K. 1972. General background theory of cut-off grades. Transactions of the Institution of Mining and Metallurgy, Section A: Mining Technology, vol. 81. pp. A160-A179. [ Links ]
Taylor, H.K. 1985. Cut-off grades - some further reflections. Transactions of the Institution of Mining and Metallurgy, Section A: Mining Technology, vol. 96. pp. 204-216. [ Links ]
Thompson, M. and Barr, D. 2014. Cut-off grade: a real options analysis. Resources Policy, vol. 42. pp. 83-92. [ Links ]
Whittle, J. and Wharton, C. 1995. Optimising cut-offs over time. Proceedings of the 25th International Symposium on the Application of Computers and Mathematics in the Mineral Industries, Brisbane, Australia. Australasian Institute of Mining and Metallurgy, Melbourne. pp. 261-265. [ Links ]
Paper received Aug. 2018
Appendix 1: Code for NPVMining (Githiria, 2018)


