


Services on Demand
Article
 English (pdf)
 Article in xml format
 Article references
Indicators

Related links
-
 Cited by Google
 -
 Similars in Google
Share

 Permalink
Journal of the Southern African Institute of Mining and Metallurgy
On-line version ISSN 2411-9717
Print version ISSN 2225-6253
J. S. Afr. Inst. Min. Metall. vol.119 n.2 Johannesburg Feb. 2019
http://dx.doi.org/10.17159/2411-9717/2019/v119n2a5
DIAMONDS - SOURCE TO USE 2018 CONFERENCE
Monitoring the performance of DMS circuits using RhoVol technology
M. Fofana; T. Steyn
De Beers Technologies, South Africa
SYNOPSIS
One of the most important performance indicators of a dense medium cyclone (DMC) circuit is the Tromp curve, and by extension the separation density and Ecart Probable (Ep) values. The densimetric profiles of DMC product streams have been traditionally acquired using heavy liquid sink-float analysis, which has certain disadvantages, such as the associated safety and health risks. More recently, non-toxic media such as lithium hetero-polytungstates (LST) have been used, with the desired densities being achieved by maintaining the solutions at specific temperatures. However, the high costs of these liquids can be prohibitive. The long turnaround time of the sink-float analysis is a further disadvantage for timeous interventions to the operating set-points of the DMC process.
The RhoVol technology can generate the density distribution of a batch of particles in a rapid, accurate, repeatable, and safe manner. Additional data of interest, such as particle size and shape, are also measured and reported on a per-particle basis. Furthermore, samples can be sorted into discrete sorting bins based on any of the measured parameters of the particle, making further analyses of the material possible.
This technology has applications across all commodities that use the DMC, particularly in the size fractions -25 +8 mm and -8 +3 mm. To date, laboratory results have proved very encouraging - separation densities are within 5% of traditional sink-float results, and the technology is being introduced to diamond DMC plants.
Keywords: dense medium cyclone, RhoVol, particle size, particle shape, density.
Introduction
Dense medium separation is a commonly applied beneficiation technique for the density separation of valuable products from crushed ores. The industrial applications of dense medium separation have been summarized and reviewed by various authors (Scott and Napier-Munn, 2000; Bosman, 2014; Napier-Munn, 2018). Dense medium cyclones (DMCs) are widely used in the coal and diamond industries to produce clean coal or to pre-concentrate kimberlitic ores, respectively. Cyclone performance (separation density monitoring) techniques are varied. In the mineral industry. Density tracer tests (Napier-Munn, 1985, 2014; Davis, Wood, and Lyman, 1985) without mineral material, are widely used, although their accuracy in predicting operating cut-points becomes limited once mineral material is introduced. More recently, radio frequency tracers have been also used for the determination of cyclone efficiency (Partition Enterprises, 2017).
Density fractionation (the sink-and-float process) is a traditional practice used throughout mineral processing laboratories to ascertain the efficiency of density-based separators. It has also been used as a yield predictor in the coal and iron ore industries, where the density profile of the crushed run-of-mine (ROM) ore is correlated with the plant yield.
Densimetric evaluation methods have historically used heavy liquids, tetrabromoethane (TBE) of various densities. but these liquids carry health and environmental risks (Wills, 1987). More recently, non-toxic lithium hetero-polytungstates (LST) have been used, where the desired densities are achieved by maintaining the solutions at specific temperatures (Koroznikova et al., 2007). Although sink-float densimetric analyses give a useful indication of cyclone performance, their practicalities in providing information to effect timeous plant-control and optimization are often limited. Long delays (up to 12 weeks) between sample collection and availability of results are not uncommon (Ndlovu, 2015). Furthermore, the repeatability of data can often be poor due to the inconsistent nature of its operation, since sink-float analysis is a manual process and very dependent on the dexterity and experience of the operator.
The RhoVol process begins by accurately measuring the mass of each particle, followed by a 3D reconstruction of its volume using images from multiple cameras (Forbes, Voigt, and Bodika, 2003; Forbes et al., 2006). The particle density is then simply the ratio of the mass to volume. Additional particle features such as size and shape (compactness, flatness, or elongation) are readily available. The process is rapid, repeatable, accurate, and safe. In addition, sample size is much smaller compared to requirements in conventional sink-float techniques, which amount to tens of kilograms. This is because it has been proven statistically that only a thousand representative particles are required to generate repeatable and consistent data (Mangera, Morrison, and Voigt, 2016).
The objective of this paper is to present RhoVol as a competitive alternative to sink-float techniques. Ultimately, a comparative case study will be conducted by analysing data from both conventional sink-float and RhoVol methods, using similar samples. This study will include the generation of partition curves, and the determinations of operating cut-points and Ecart Probable (Ep) values.
RhoVol apparatus description
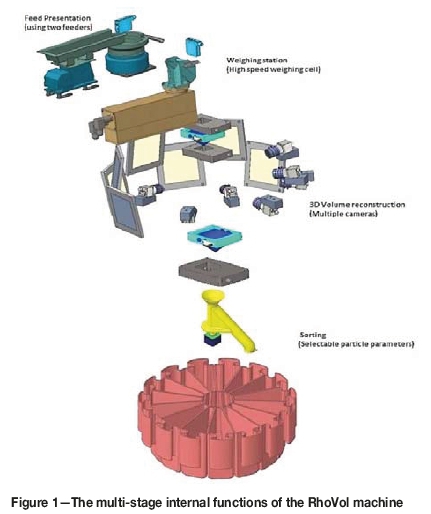
RhoVol is a densimetric measurement device developed and manufactured by De Beers Technologies SA. The machine operates in an automated batch process configuration. Particles in a particular batch are individually weighed and their volumes are estimated by 3D reconstructions (Forbes, Voigt, and Bodika, 2003; Forbes et at, 2006). The device discretely generates mass, volume, density, size, and particle shape descriptors such as compactness, flatness, and elongation. It also has the capability of re-processing samples multiple times (in multi-pass mode) to increase measurement accuracy. The multi-pass algorithm can re-identify any individual particle in a sample and merge the data when it is reintroduced subsequently, and ultimately reconstruct a higher fidelity 3D model. Furthermore, the sample can be sorted into discrete bins based on any of the measured parameters of the particles, making further analyses of the material possible. The sample processing time is specified at 1000 particles per hour, resulting in statistically valid sample data being obtained in just over an hour in single-pass mode. Currently, the machine is available in two configurations, a fines machine for particles in the 3-8 mm fraction (including sorting as an option) and a coarse machine for particles in the 8-25 mm fraction (where the sorting option will be available soon). The requirements for the samples are that they should be dry, free of dust, and properly screened to the specified size fraction. Figure 1 illustrates the multi-stage internal functions of the RhoVol device. It entails a feed presentation stage which uses two feeders. The weighing station makes use of a high-speed weighing cell to ensure accurate measurement of particle mass. The 3D volumetric model of the particle is constructed by analysis of multiple images provided simultaneously by several cameras, offset at various angles. Sorting is done by an algorithm that can classify particles based on any of the obtained particle features, such as density, mass, size, or shape parameters.
RhoVol data calibration
Prior to generating any accurate density profiles by the RhoVol, an appropriate function for the volume correction factor for the 3D reconstructed volumes of particles needs to be established. Previous studies have proven that multi-view silhouette-based volume reconstruction methods will always overestimate the particle volume (Wang et al., 2009; Okonta and Magagula, 2011; Mangera and Morrison, 2016). The volume correction factor is primarily shape-dependent, but it is also material-dependent, since ultimately the nature of the material defines its final shape after comminution. Figure 2 presents an example of a 3D model of the volume of a particle generated by the RhoVol.
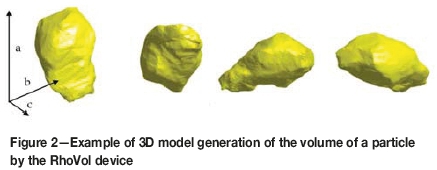
Because particle shape is one of the most critical parameters affecting volume accuracy, a relationship between shape and volume correction factor was established. Hence, all samples were sorted on the RhoVol based on three shape factors, namely compactness, elongation, and flatness. The compactness factor was ultimately used in all subsequent studies, because preliminary tests found better correlation with the volume correction factor. The definitions of the shape factors are deduced from measurements made, using the 3D model of the particle as inputs (Voigt and Twala, 2012):
► a, b, c-Caliper diameters along each of the particle's principal directions, resulting in three orthogonal measurements where 'a' is the longest caliper, 'b' the intermediate, and 'c' the shortest; all measured in millimetres
► Flatness-A value larger than unity related to the flatness of the particle and defined by the ratio of b to c. A sphere has flatness equal to unity
► Elongation-A value larger than unity related to the elongation of the particle and defined by the ratio a:b. A sphere has elongation equal to unity
► Compactness-A value smaller than unity related to the compactness of the particle and is defined by
. A sphere's compactness measures unity
Determination ofcorrection factorfunction for kimberlitic material
Two kimberlite samples were utilized in this test work; namely, DMC float-and-sink audit products (2016) from Venetia Mine in the size fraction -8+2.8 mm. The kimberlite material types were identified as KO1 and KO2 MVK. Compactness values ranging from 0.45 to 0.85 in steps of 0.04 were set on the RhoVol and the float-and-sink audit products were run separately. This generated for each product twelve sub-samples (or shape classes of material) for the shape factor compactness. The first ten were realized from the initial compactness values plus two additional shape classes of material, one less than 0.45 and another greater than 0.85. A calibrated gas pycnometer was used for the volume measurements. Gas pycnometer evaluation consisted of determining the mean volume of each of the twelve sub-samples. Finally, a volume correction factor for each shape class was established as the ratio of corresponding volumes from the gas pycnometer and the RhoVol. Lastly, the volume correction factor function (VCFF), relating volume correction factors to shape classes (for the compactness shape factor), was established.
The photographs in Figure 3 illustrate compactness for kimberlite after classification in the RhoVol. The material was sourced from the DMC float. These pictures are a typical example of the sorting capability of the RhoVol, from flatter shapes (in the 0.45 to 0.49 range) to rounder shapes (in the 0.81 to 0.85 range). A similar compactness sorting was also found when the DMC sink material was studied, although not presented here. This shape classification can be ascribed to the nature of the material being analysed, in this instance, kimberlite.
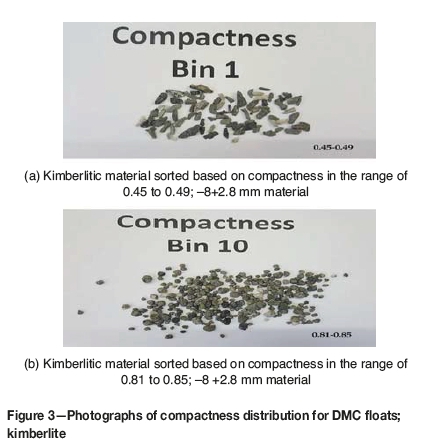
Figure 4 shows the compactness distributions for the DMC float and sink products. Similarities can be observed between the two compactness distributions. Namely, the shapes of the bulk of the material are shifted toward higher values of compactness, hence the particles are expected to be predominantly rounder. This could have positive implications for separation in the DMC, since it is well known that the behaviour of flat particles has always been challenging to predict accurately. Furthermore, easy access to shape distribution of any given material, provided by the RhoVol device, would be welcome since it can give some indications of the nature of the separation to be expected in the DMC.
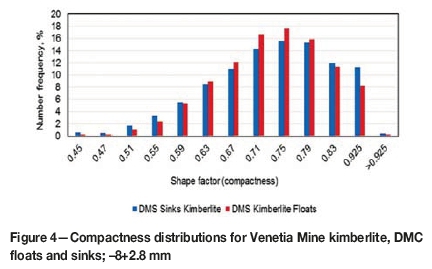
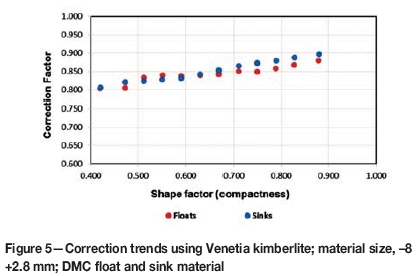
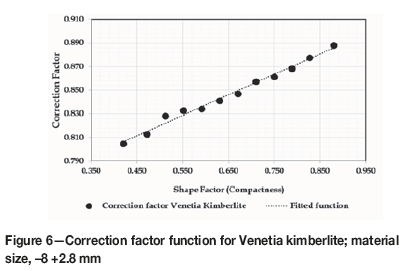
Figure 5 illustrates the correction factors obtained using DMC sink and float products. The results indicate similarities between the two trends; which was expected because of good parallels between the two shape distributions seen in Figure 4. Hence, a single correction factor function was adopted in all subsequent studies. This was done by using mean values of correction factors for each compactness category from the DMC sink and float samples. Figure 6 shows such an example. The data demonstrates a good linear correlation between correction factor and shape (compactness) class; R2 was found to be 0.99.
Case study: densimetric analyses of Venetia dmc audits samples
Sample preparation
The kimberlite material used was identical to that described in the previous section. Representative samples were generated by riffling; one set for RhoVol analysis and another for sink-float analysis. The sink-float samples were sized into -8 +6.7 mm, -6.7 +4.75 mm, -4.75 +3.35 mm, -3.35 +2.36 mm, -2.36 +1.18 mm, and -1.18 mm fractions. However, due to RhoVol's bottom size limitation for fines, of +2.8 mm, the samples were only sized as -8 +6.7 mm, -6.7 +4.75 mm, -4.75 +3.35 mm, and -3.35 +2.8 mm. For particle sizes finer than 3 mm, the resolution of the current weighing scale is insufficient to register adequate particle mass, especially for material such as coal. In addition, material handling for such fine sizes with the current feeder system will also be challenging.
Test methodologies
Sink-float test work
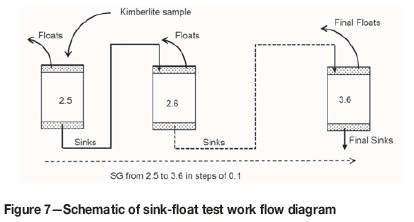
In the sink-float evaluation process, tetrabromoethane (TBE) liquids covering a range of densities from 2.5 to 3.6, in incremental steps of 0.1, were used. Then, representative samples (as described in the section Sample preparation) of the various size fractions were separately added to the liquid of lowest density first. After stirring and allowing the mixture to settle, each float product was removed, washed, and put aside; while each sink product was transferred to the next higher density, and so forth. The final sink and float products were drained, washed, and dried, along with all the previous float products. Finally, all the products were weighed to give the overall density distribution of each sample, by mass (Figure 7).
RhoVol test work
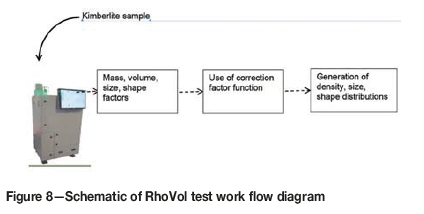
After establishing the VCFF (volume correction factor function) all the RhoVol samples, as described in the section Sample preparation, were processed. Hence, information on mass, volume, size, and shape factors of individual particles was collected; from which sample density, size, or shape distributions could be created (Figure 8). The measured volume of each particle in each size fraction sample was adjusted by first determining its appropriate correction factor. This was achieved by using particle compactness and the fitted curve of the plot in Figure 6. Lastly, the corrected volume was just the product of volume measured by the RhoVol and the correction factor.
Results and discussion
Repeatability ofRhoVol measurements
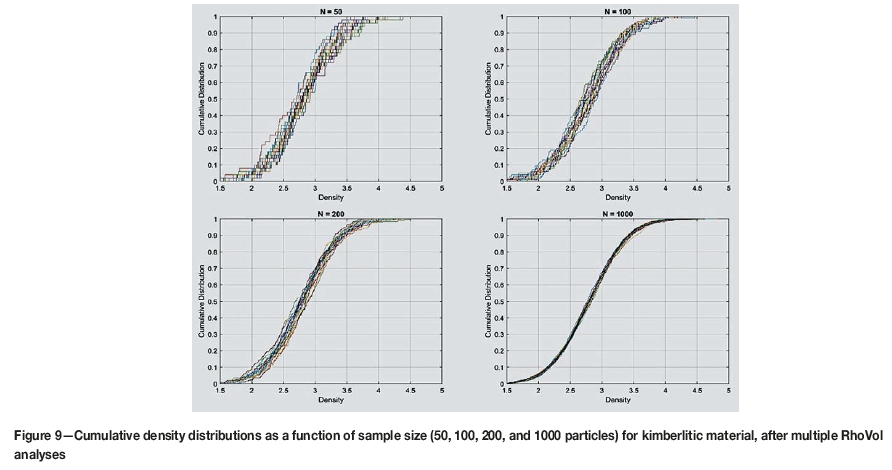
Previous studies (Mangera, Morrison, and Voigt, 2016) have demonstrated the repeatability of results by RhoVol if data for at least 1000 particles is captured from a given sample. It was also found that the standard deviation of the median density (p50) of the sample, after multiple analyses, was negligible. Figure 9 shows an illustration of the overlapping of the density distributions after multiple analyses, as a function of sample size, for a kimberlite sample. The results indicate a general improvement in the repeatability of the density distribution as the sample size increased, culminating in optimum data when 1000 particles (or more) were analysed. This is an important finding as it can, in future, help reduce the size of samples to be treated for densimetric analyses. Moreover, the finding also suggests that RhoVol can deliver consistent and repeatable results. This is unlike sink-float operations, for which repeatability of data is a challenge due to the fact that sink-float is a manual process and prone to human error.
Densimetric results
The separation density and probable error (Ep) of the fines DMC (Module 1, DF1, Venetia Mine) were determined using sink and float products. Subsequently, density fractionation was performed (as described in the section Sink-float test work) followed by tests in the RhoVol device (explained in the section RhoVol test work) to establish the relevant size-by-size partition curves.
Sink-float vs. RhoVol methods: preliminary findings
Figure 10a presents the individual partition curves of all the sink-float size fractions (described in the section Sample preparation) alongside the curve for the overall fraction of -8+1 mm. Table Ia summarizes the corresponding separation densities and Ep values. Figure 10b illustrates the partition curves of the RhoVol size fractions; as well as the curve for the combined fraction of -8 +2.8 mm. Table Ib, similarly, shows all the separation densities and Ep values. The separation densities and Ep values were all derived from experimental data fitted using the partition equation developed by Scott and Napier-Munn (1990).
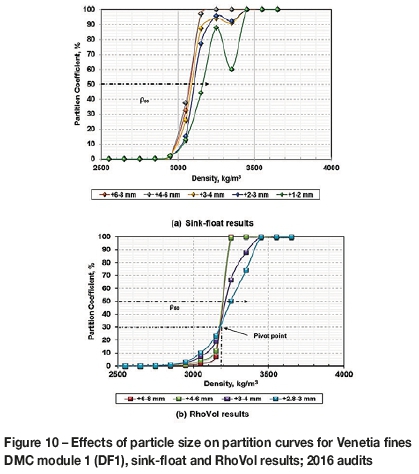
The partition curves and Ep results in Figure 10 and Table I show a general increase in separation density and Ep with decreasing particle size; a phenomenon that is a commonly observed in DMC separations. It is a physically related phenomenon of size-by-size cyclone partition curves (Scott, Davis, and Manlapig, 1986; Napier-Munn, 1990, 2018; Dunglison, 1999). RhoVol gives smoother partition curves, including the clear presence of a 'pivot point'; which tends to occur in some DMC separations and has been used in the past for modelling purposes (Scott and Napier-Munn, 1992). The deteriorations in separation efficiency for the finest size fractions, particularly below 4 mm, appear more pronounced in the sink-float results. Noise in these finer fractions, which previously may have been attributed to short-circuiting, may be measurement artefacts. The Ep values generated as a result of tests on the RhoVol are for the most part lower, except for one outlier for the +3 -4 mm fraction.
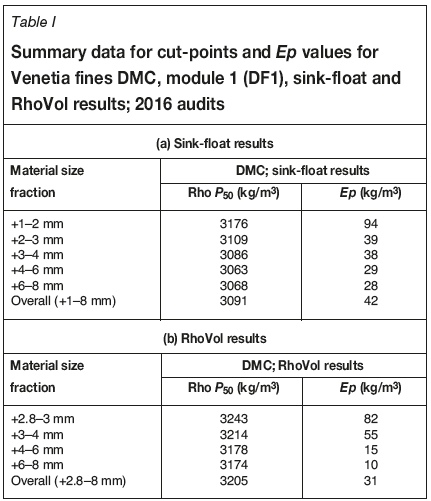
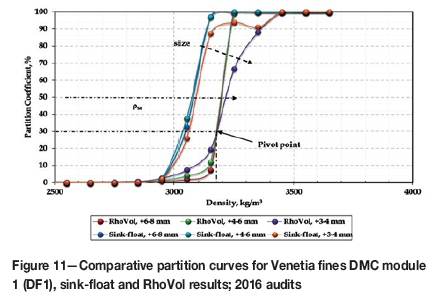
Figure 11 and Table II present the comparative separation data (where available) generated by the sink-float and RhoVol methods. The RhoVol densities are consistently higher than the sink-float densities, albeit within 5%. The reason for these differences between the two densimetric methods is still being studied. Nonetheless, it is common knowledge that the sink-float method has its drawbacks for near-density particles. That is because those particles may not have enough time to reach the sink or float product and could be misplaced into the wrong product during collection. Conversely, the RhoVol device accurately measures particle mass with excellent volume estimates, hence with fairly accurate particle density calculations.
Conclusions
Density fractionation (the sink-and-float process) is a common practice used throughout mineral processing laboratories to ascertain the efficiency of density-based separators. Although the method does provide useful indications of cyclone performance, its practicality in supplying information to effect timeous plant control and optimization is often limited.
The RhoVol machine is capable of rapidly and safely providing repeatable and accurate data, with significantly smaller sample size requirements, i.e., only thousands of particles as compared to tens of kilograms in sink-float analyses. Additional particle features such as size, volume, mass, and shape are readily available, and sorting on any of these properties is an option. This latter feature of RhoVol sets it apart from many other types of laboratory equipment. Ultimately, particle density versus size could be used to study mineral liberation, for instance.
Comparative densimetric analyses were conducted on sub-samples riffled from a main common kimberlite sample that originated from Venetia Mine fines DMC float and sink products. The size fractions were varied between 8 and 1 mm in the sink-float method, while fractions between 8 and 2.8 mm were used for the RhoVol tests due to the bottom size limitations of +2.8 mm material. The partition curves and Ep results, using both methods, show a general increase in separation density and Ep with decreasing particle size; a phenomenon that is commonly observed in DMC separations. However, the RhoVol gives smoother partition curves from which conclusions are more easily drawn. In addition, the density difference between the two methods has consistently been within 5%, with reference to the sink-float technique. This finding is significant because it indicates convergence of results within a small margin of error. Ultimately, RhoVol data shows that it can be a very competitive alternative to the sink-float method, which is still very manual and labour-intensive and suffers from accuracy problems.
Acknowledgements
Venetia Mine is thanked for the use of its operational data. The work presented in this paper would not have been possible without the considerable effort of the RhoVol team, past and present.
References
Bosman, J. 2014. The art and science of dense medium selection. Journal of the Southern African Institute of Mining and Metallurgy, vol. 114. pp. 529-536. [ Links ]
Davis, J.J., Wood, C.J., and Lyman, G.J. 1985. The use of density tracers for the determination of dense medium cyclone partition characteristics. Coal Preparation, vol. 2, no. 2. pp. 107-125. [ Links ]
Dunglison, M.E. 1999. A general model of the dense medium cyclone. PhD thesis, JKMRC, University of Queensland, Australia. [ Links ]
Forbes, K., Voigt, A., and Bodika, N. 2003. Using silhouette consistency constraints to build 3D models. Proceedings of the Fourteenth Annual Symposium of the Pattern Recognition Association of South Africa (PRASA 2003). pp. 33-38. [ Links ]
Forbes, K., Nicolls, F., de Jager, G., and Voigt, A. 2006. Shape-from-silhouette with two mirrors and an uncalibrated camera. Proceedings of the 9th European Conference on Computer Vision (ECCV 2006), Graz, Austria, May 7-13, 2006. Springer. pp. 165-178 [ Links ]
Koroznikova, L., Klutke, C., Mcknight, S., and Hall, S. 2007. The use of low-toxic heavy suspensions in mineral sands evaluation and zircon fractionation. Proceedings of the 6th International Heavy Minerals Conference 'Back to Basics'. Southern African Institute of Mining and Metallurgy, Johannesburg. pp. 21-29. [ Links ]
Mangera, R., Morrison, G., and Voigt, A. 2016. Particle volume correction using shape features. Proceedings of the Pattern Recognition Association of South Africa and Robotics and Mechatronics International Conference (PRASA-RobMech), Stellembosch, South Africa, 30 November - 2 December, 2016. IEEE, New York. [ Links ]
Napier-Munn, T.J. 1990. The effect of dense medium viscosity on separation efficiency. Coal Preparation, vol. 8. pp. 145-165. [ Links ]
Napier-Munn, T.J. 2014. Statistics for Mineral Engineers; How to Design Experiments and Analyse Data. JKMRC, University of Queensland. 628 pp. Section 6.9.1. [ Links ]
Napier-Munn, T.J. 2018. The dense medium cyclone - past, present and future. Minerals Engineering, vol. 116. pp. 107-113. [ Links ]
Ndlovu, S. 2015. Venetia Mine DMS evaluation report. Ven-R00545-718-001, 10-11-2015. DebTech. [ Links ]
Okonta, F. and Magagula, S. 2011. Railway foundation properties of some South African quarry stones. Electronic Journal of Geotechnical Engineering, vol. 16 B. pp. 179-197. [ Links ]
Partition Enterprises. 2017. http://www.partitionenterprises.com.au/ [accessed 20 March 2017]. [ Links ]
Scott, I.A., Davis, J.J., and Manlapig, E.V. 1986. A methodology for modelling dense medium cyclones. Proceedings of the 13th Congress of the Council of Mining and Metallurgy Institutions, Singapore, May. Australasian institute of Mining and Metallurgy, Melbourne. pp. 67-76. [ Links ]
Scott, I.A. and Napier-Munn, TJ. 1990. A dense medium cyclone model for simulation. Proceedings of the Fourth Samancor Symposium on Dense Media Separation, Dense Media 90, Cairns, Australia. Samancor Ltd. [ Links ]
Scott, I.A. and Napier-Munn, T.J. 1992. A dense medium cyclone model based on the pivot phenomenon. Transactions of the Institution of Mining and Metallurgy, vol. 101. pp. C61-C76. [ Links ]
Voigt, A. and Twala, C. 2012. Novel size and shape measurements applied to jig plant performance analysis. Journal of the Southern African Institute of Mining and Metallurgy, vol. 112, no. 3. http://www.scielo.org.za/scielo.php?script=sci_arttext&pid=S2225-62532012000300007 [ Links ]
Wang, L., Lu, Y., Lane, D., and Druta, C. 2009. Portable image analysis system for characterizing aggregate morphology. Transportation Research Record: Journal of the Transportation Research Board, vol. 2104. pp. 3-11. [ Links ]
Wills, B. 1987. Mineral Processing Technology. 4th edn. Pergamon Press. pp. 420-456. [ Links ] ♦
This paper was first presented at the Diamonds - Source to Use 2018 Conference, 11-13 June 2018, Birchwood Hotel and OR Tambo Conference Centre, JetPark, Johannesburg, South Africa.

