


Services on Demand
Article
 English (pdf)
 Article in xml format
 Article references
Indicators

Related links
-
 Cited by Google
 -
 Similars in Google
Share

 Permalink
Journal of the Southern African Institute of Mining and Metallurgy
On-line version ISSN 2411-9717
Print version ISSN 2225-6253
J. S. Afr. Inst. Min. Metall. vol.119 n.1 Johannesburg Jan. 2019
http://dx.doi.org/10.17159/2411-9717/2019/v119n1a8
PAPERS OF GENERAL INTEREST
Evaluation of the physico-mechanical properties of plutonic rocks based on texture coefficient
U. Atici; R. Comakli
Engineering Faculty, Nigde Omer Halisdemir University, Nigde, Turkey
SYNOPSIS
Understanding rock properties is of vital importance in mining and civil engineering. Rock properties are generally determined through laboratory tests, which require a large number of uniformly shaped samples and technicians who use indirect methods to determine rock properties. The texture coefficient (TC), which represents various textural parameters including the size, shape, orientation, and relative proportions of grains and the matrix, is an efficient means for indirectly evaluating the mechanical behaviour of rocks. In this study, 12 different rocks (ten granites, one diorite, and one gabbro) were collected and their engineering properties. including specific gravity, porosity, P- and S-wave velocities, Schmidt rebound hardness, uniaxial compressive strength, and elasticity modulus, were investigated. Relationships between TC and these measured properties were assessed. Statistically significant (at the 95% confidence level) correlations were found between the TC and compressive strength, elasticity modulus, sound velocity (both compression and shear waves for dry and saturated samples), but no significant correlation was found with Schmidt rebound hardness. The results suggest that it is possible to use the relationships between TC and the mechanical properties of rocks in rock classification.
Keywords: texture coefficient, granitic rocks, linear regression, rock mechanics.
Introduction
In every aspect of rock engineering, knowing rock properties is essential for determining and predicting the behaviour of rocks and rock masses. Mechanical properties of rocks are important parameters in mining, geology, and engineering, and they are affected by textural characteristics such as grain size, grain shape, cement type, degree of cementation, mineral content, and the ratio of the grain area to the matrix area. The effects of textural properties on the physical and mechanical properties of rocks have been investigated for a long time, and previous studies revealed close relationships between single parameters related to rock texture and mechanical properties of rocks (Akesson et al. 2001; Gunsallus and Kulhawy 1984; Merriam, Rieke, and Kim, 1970: Onodera and Kumara 1980; Prikryl 2006; Ulusay, Tureli, and Bider, 1994; Tugrul and Zarif 1998). Rock properties are usually determined using mechanical tests, which require uniformly shaped and relatively large samples. However, it is not always possible to obtain such samples. Furthermore, rocks with similar textural and structural properties may exhibit different mechanical behaviour. Howarth and Rowlands (1987) developed a texture coefficient (TC) that expresses all the main textural parameters of a rock in a single dimensionless quantity based primarily on statistical assessment. The TC makes it possible to understand the effects of a rock's textural properties on its mechanical properties using thin sections instead of large, uniform samples. Ersoy and Waller (1995) investigated the relationship between strength and TC for limestone, sandstone, and siltstone; they also examined the effect of rock properties and TC on drilling performance. Ozturk, Nasuf, and Bilgin (2004) explored the relationship between rock quality and TC by evaluating the uniaxial compressive strength (UCS) values of limestone, basaltic andesite, and tuff. Gupta and Sharma (2012) evaluated TCs as well as the petrophysical and mechanical properties of quartzite from the lower and higher Himalayas and found a strong relationship between TC and UCS. Similarly, Ozcelik, Bayram, and Yasitli (2013) investigated the relationship between TC and various parameters in marble by applying the statistical analyses developed by Ozturk, Nasuf, and Kahraman (2014).
As indicated by the aforementioned studies, the relationships between a rock's textural and mechanical properties have been extensively investigated for sandstone, siltstone, and limestone. In contrast, little consideration has been given to these relationships in plutonic rocks. Plutonic rocks incorporate an extensive variety of rock types, thereby complicating their mineralogy, petrographie characteristics, and engineering properties (Azzoni et al, 1996; Tugrul and Zarif, 1998). The main objective of this study is to investigate relationships between the physico-mechanical properties and TCs of plutonic rocks. Twelve different rocks (ten granites, one diorite, and one gabbro) were collected from various regions in Turkey and abroad, and the TC value of each specimen was determined using image analysis techniques on thin sections. The physical and mechanical properties of the specimens were then evaluated. The engineering properties investigated included specific gravity, porosity, P- and S-wave velocities, Schmidt rebound hardness (SR), UCS, and elasticity modulus (EM). Finally, the relationships between TC and the engineering properties were evaluated.
Materials and methods
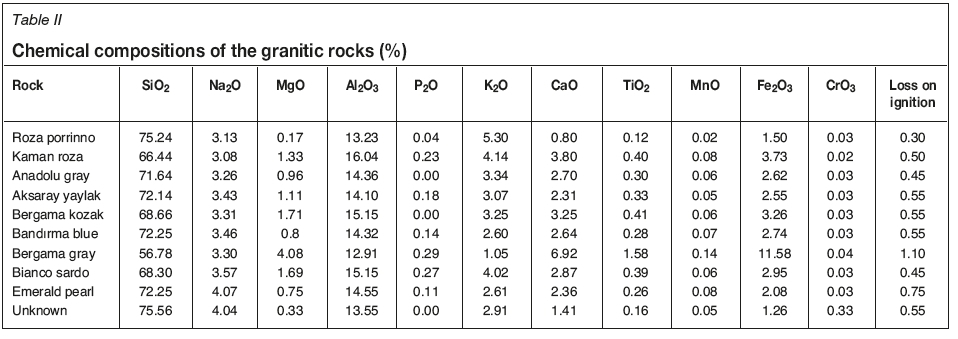
Chemical and mineralogical assessment of the rocks
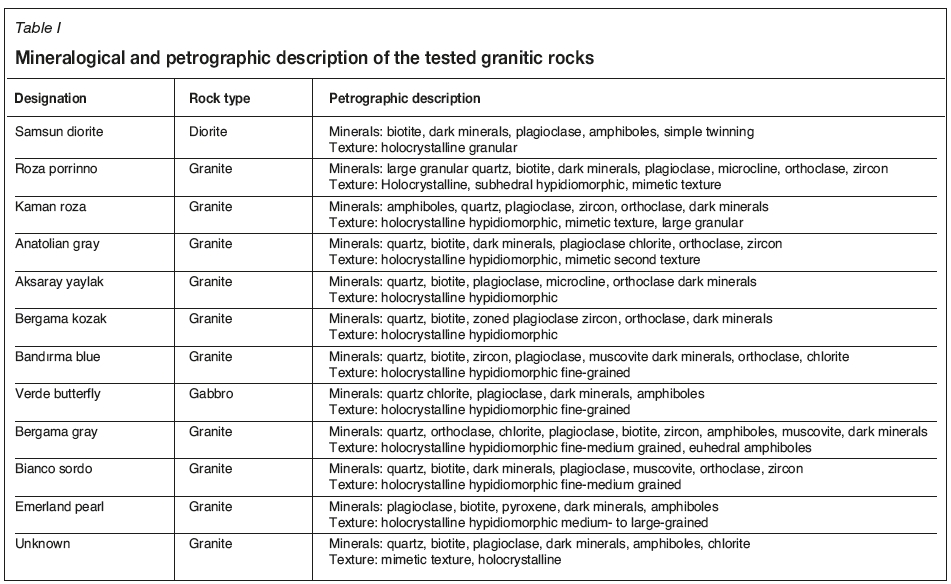
Mineral composition and grain content are known to affect rock material strength (Ozturk and Nasuf, 2013). Mineralogical composition is one of the principal properties controlling the rock strength. Concerning the mineral content, the abundances of quartz and feldspar are the most significant factors influencing the mechanical properties. Distinctive minerals can affect the quality parameters of the rocks in different ways. The strength increases as the quartz content increases, and an abundance of easily cleavable minerals (such as feldspars) causes a reduction in strength (Tugrul and Zarif 1998). Granitic rocks vary significantly in mineral content and chemistry; X-ray fluorescence and X-ray diffraction were employed to determine the mineral and chemical compositions of the rocks in this study.
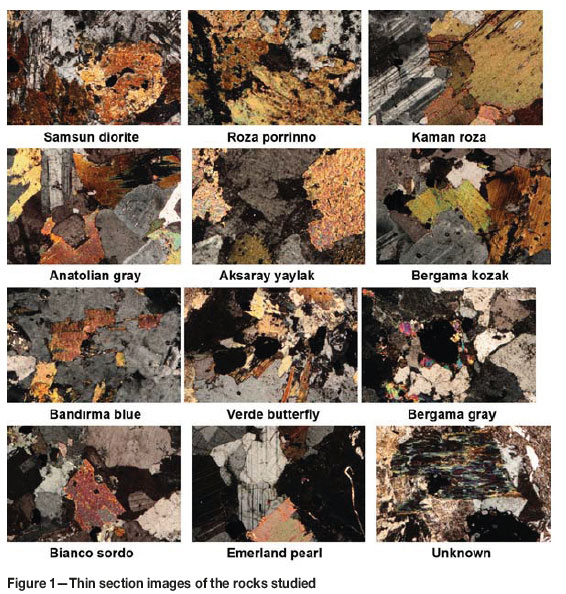
To evaluate the mineralogical and textural characteristics, thin sections of the rock samples were analysed using a polarizing microscope equipped with an automatic image-analysis system. At least two thin sections were prepared for each rock. The mineral constituents and a summary of the petrographic characteristics and thin section images of the rocks used in this study are given in Table I and Figure 1, respectively. The chemical compositions of the samples are presented in Table II.
Physical and mechanical properties of the rock samples
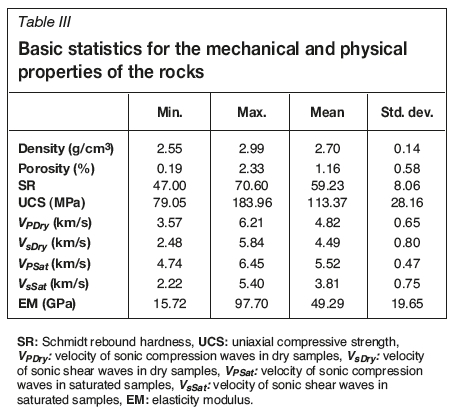
The physical properties (density, porosity, and ultrasonic P-and S-wave velocities) of the rock samples were determined. The specimens were cored from large blocks in the laboratory and tested in accordance with the procedures given by the ISRM (1981). Density and porosity were determined by water saturation and caliper techniques on NX-size specimens. Five samples of each rock type were tested as indicated for the properties discussed.
The velocities of the P- and S- waves were measured using the high-frequency ultrasonic pulse technique described by ASTM (1990) using a 1 MHz nominal frequency. The wave velocity through the specimen was calculated from the travel time from the transmitter to the receiver. The velocities of sonic compression waves (Vp) and shear waves (Vs) were measured for each of the dry and water-saturated samples. At least five measurements were carried out on each rock type, and the average values were calculated. The results are given in Table III.
The measured mechanical properties were UCS, EM, and SR. UCS was determined according to the standards given by ISRM (1981). At least five core samples from each rock were subjected to strength tests, which were carried out by a fully automatic, instrumented, and computer-controlled press machine. For the determination of EM, fully bridged electrical resistance strain gauges were used. Two strain gauge rosettes consisting of two gauges each were bound to the surface of each specimen at two directly opposite points halfway between the ends of the specimen. Axial and circumferential strains were recorded at first intervals using the static datalogger. Tangential EM was then calculated based on the stress-strain curves.
The block samples were subjected to rebound testing using a Digi-Schmidt 2000 according to the procedures described by ISRM (1981). SR was measured at a minimum of 20 different points on each sample. The results are presented in Table III.
Quantitative investigation ofrock texture
TC was developed by Howarth and Rowlands (1987) to forecast the strength properties of rocks through quantifying the rock texture. TC was developed with the belief that textural structures of rocks serve as physical barriers to prevent the rocks from cracking under load. When a pressure is is applied to the rock, a highly stressed zone is produced. When the stress exceeds the strength of the material, cracks begin to form and spread to the exterior surface. Finally, when one of the main cracks reaches the free surface, macroscopic failure in the rock occurs (Tiryaki and Dikmen, 2006).
TC can be used to reveal relationships between the textural and geomechanical properties of rocks, including mechanical properties, physical properties, drillability, and excavability. Rock texture is calculated by considering four components, namely grain circularity (FF0), elongation (NO, N1, and AR1), orientation (AF1), and degree of grain packing (AW), using the following formula (Howarth and Rowlands, 1987).

where, TC is the texture coefficient, AW is grain packing weighting, N0 and N1 are the number of grains whose aspect ratio is respectively below and above a pre-set discrimination level '2', FF0 and AR1 are the arithmetic means of discriminated form factors and aspect ratios, respectively, and AF1 is an angle factor, quantifying grain orientation. Detailed information is provided by Howarth and Rowlands (1987).
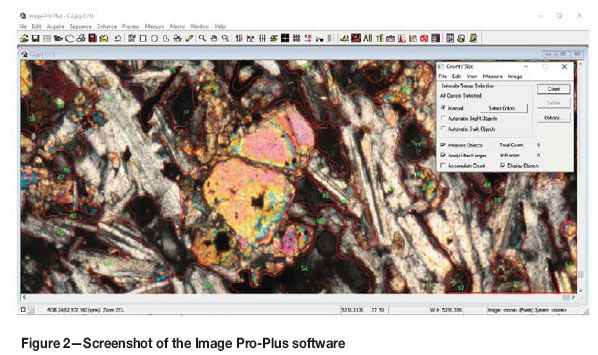
The thin sections were evaluated to determine the grain properties of the samples. A series of thin sections was prepared from the core specimens of each rock type. Image analysis was conducted on photographs of the thin sections using Image Pro-Plus software (Figure 2). The grain parameters recorded were the ratio of the area of grains and the matrix, and the length, width, perimeter, orientation, and area of each grain in the viewing window, with five replicates analysed per sample. Subsequently, by taking the arithmetic average of these five values, a total of 12 TC values with variations were determined, one for each sample. (Table IV).
Results and discussion
The relationship between TC and the other parameters was investigated by linear regression analysis. The coefficients of determination (r) as well as the 95% confidence limits were determined. The reasons for data points falling outside the confidence intervals were investigated and are explained.
Comparison of textural coefficients and physical properties
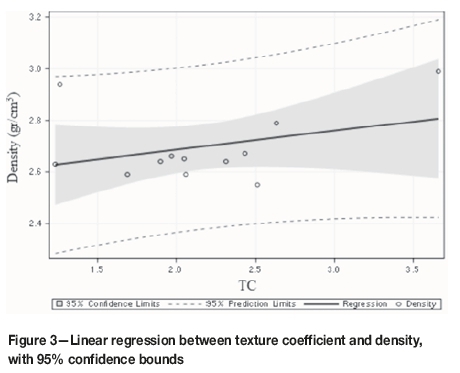
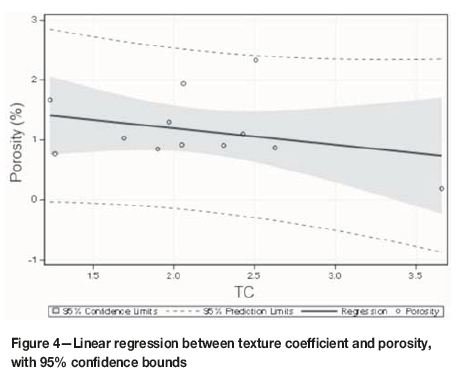
The relationships among the investigated parameters are given in Figures 3-9. Very weak correlations were found between TC and density and porosity (r= 0.62 and -0.59, respectively). As shown in Figure 3, the only sample that fell outside the confidence interval was Samsun diorite, which had the second highest density among all the samples (Verde butterfly granite was the densest). Although the correlations were weak, all the granite samples except the unknown granite were within the 95% confidence interval. The unknown granite was rich in K-feldspar, which replaced quartz and decreased the density of this rock. Azzoni et al. (1996) showed that the TC model can be used to classify rocks, but they were of the opinion that, this model cannot be used to predict mechanical properties precisely because it does not involve significant petrographic parameters, such as porosity and mineralogical composition.
The grain shape, elongation, and orientation and the grain matrix ratio are included in the calculation of TC.
However, in rocks the mineral composition, matrix structure, and porosity are the main factors that affect density, and these parameters are not involved in the calculation of TC. Similarly to this study, Ozturk, Nasuf, and Kahraman (2014) found that the correlation between density and TC is low (r= 0.42) for marble and igneous rocks, but the correlation between TC and porosity (r= 0.96) is very high. This is explained by the fact that an increased content of elongated grains leads to an increase in porosity. In this study, although a weak significant correlation was determined (Figure 4), all samples fell within the confidence interval except the Bergama gray and unknown granite.
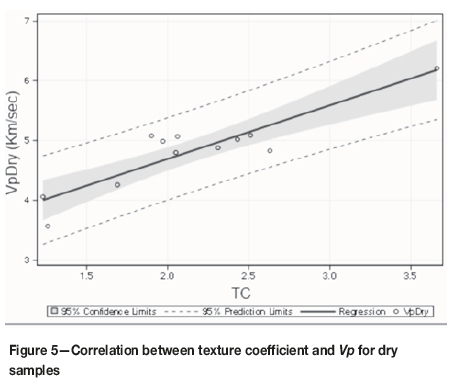
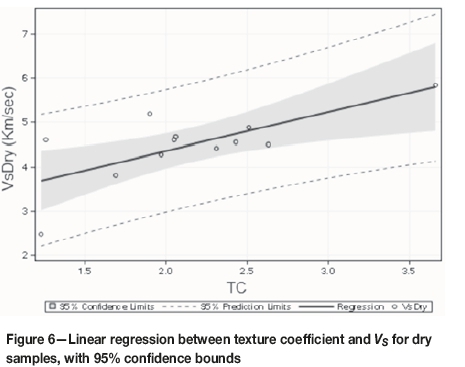
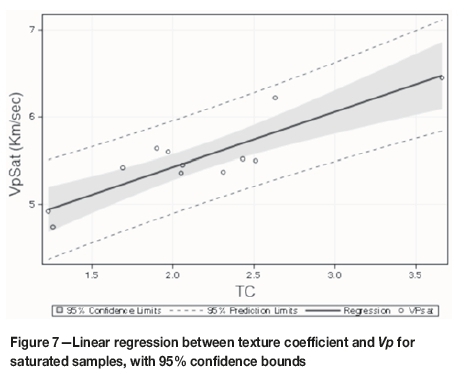
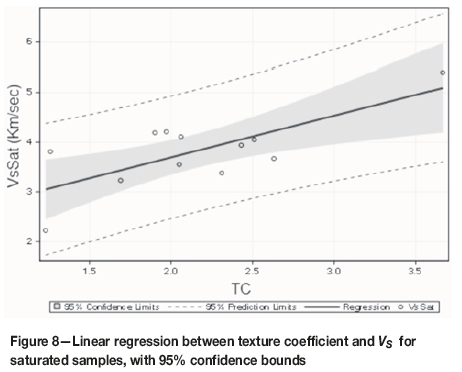
Seismic parameters (Vp and Vs) increase with increasing TC, with high correlation (Figures 5-8). Most of the rocks examined in this study are granites with low porosity and strong bonding. The Anatolian gray, Bergama gray, and Bergama kozak granites fell above the upper bound of the confidence interval. These rocks had fine to medium grain sizes and low matrix areas. Emerald pearl, which fell below the upper bound of the confidence interval, had a medium to large grain size (Table I) and a relatively large matrix area. These results indicate that grain size plays an important role in seismic velocity. Gupta and Sharma (2012) found a similar relationship between grain size and velocity. They explained this situation as 'the grain elongation reduce[s] the contact area of any two individual grains, so reducing the attenuation and therefore increases the seismic wave velocity'.
The correlation between seismic velocity and TC was stronger for Vp than for Vsand stronger for dry samples than for water-saturated samples. These results were expected because of the change in wave spread type and degree of cementation with grain packing density. The correlation coefficients for the dry and water-saturated samples were similar.
Comparison of textural coefficients and mechanical properties
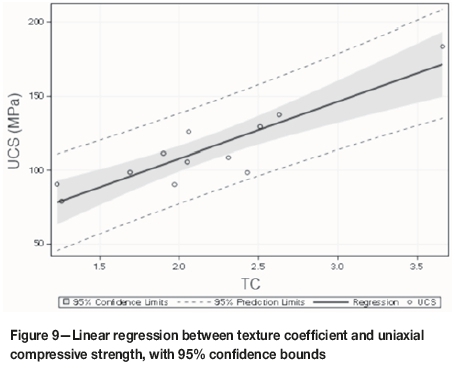
UCS, EM, and SR were determined for the rock samples, and linear regression was performed to evaluate the relationships between these mechanical parameters and TC. The results are given in Figures 9-11.
The most important mechanical property of a rock is its compressive strength. TC is useful for predicting the UCS values of rocks, especially for similar lithologies (Azzoni et al., 1996; Ersoy and Waller 1995; Ozturk, Nasuf, and Kahraman, 2014). Gupta and Sharma (2012) and Howart and Rowlands (1987) found a good linear relationship between UCS and TC, whereas Alber and Kahraman (2009) found an inverse logarithmic relationship. However, Azzoni et al. (1996), Ersoy and Waller (1994), and Ozturk, Nasuf, and Bilgin (2004) found UCS and TC to be only weakly correlated or not significantly correlated for different lithologies. Similarly, contradictory correlations have also been reported between TC and strength. Ozturk, Nasuf, and Bilgin explain this situation by the close relationships of UCS and other mechanical properties with the mineralogical and petrographic properties of the rocks. However, estimations of the mechanical, physical, and textural properties of a rock can vary over a wide range, even for similar types of rock, because of the variability of the rock material.
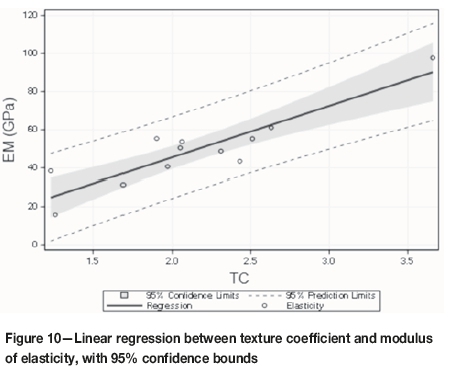
In this study, very significant correlations were found between TC and UCS (r = 0.92) and TC and EM (r = 0.93) for all the rocks, within or near the 95% confidence limits boundary, as can be seen from Figures 9 and 10. This is the result of the rocks having similar quartz contents and textures that presented a physical barrier to crack propagation. Tiryaki and Dikmen (2006) explained this situation in terms of the TC model representing a measure of the resistance of the microstructure of rocks to crack propagation. As shown in Figure 9, a very significant correlation was obtained between TC and UCS. The Bergama gray rock, which is highly altered, lay above the upper limit of the confidence interval. The Aksaray yaylak, Bergama kozak, and Kaman roza rocks exhibited sericitization in their thin sections and fell below the confidence interval.
Regarding the relationship between EM and TC, only two rocks, Anatolia gray and Kaman roza, fell outside the confidence limits. Very few studies have been found in the literature for comparison with the results of this investigation, and Alber and Kahraman (2009) stated that more work is needed. These authors found a weak correlation between EM and TC and attributed it to the blocks being weaker than the matrix, which is unusual, and the blocks and matrix were cemented together.
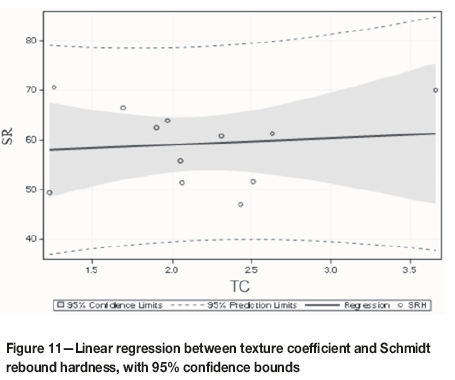
A strong relationship has been found between SR and UCS in this study. Previous studies provided no information regarding the relationship between TC and SR. As shown in Figure 11, the relationship between TC and SR in this study is not statistically significant (r = 0.12) at the 95% level of confidence. Mineral grain shape is also thought to play an important role in TC; however, it is not significant in SR.
Conclusions
The relationships between the texture coefficients (TC) and the physical and mechanical properties of 12 different plutonic rocks (ten granites, one diorite, and one gabbro) collected from several countries were determined by simple regression analyses. The main conclusions are summarized as follows.
► Significant correlations (at the 95% confidence level) were observed between TC and sound velocity (both compression- and shear-wave velocities for dry and saturated samples), even though grain size does not affect the wave speed as much as TC.
► Although density and porosity are important factors in evaluating the mechanical performance of rocks, no significant correlation was found between TC and density or porosity.
► In terms of mechanical properties, uniaxial compressive strength and elasticity modulus were significantly correlated with TC, whereas Schmidt rebound hardness was not.
► When the results obtained are evaluated together with the literature, it is clear that evaluation according to rock type is very important when physical and mechanical properties are compared with TC.
► TC can be used to predict the properties of granitic rocks, particularly strength, deformability, and sound velocity. However, the calculation of TC should be updated based on additional research related to density, porosity, and grain size.
References
Akesson, U., Lindqvist, J.E., Göroansson, M., and Stight, J. 2001. Relationship between texture and mechanical properties of granites, central Sweden, by use of image-analysing techniques. Bulletin of Engineering Geology and the Environment, vol. 60, no. 4. pp. 277-284. [ Links ]
Alber, M. and Kahraman, S. 2009. Predicting the uniaxial compressive strength and elastic modulus of a fault breccia from texture coefficient. Rock Mechanics and Rock Engineering, vol. 42, no. 1. pp. 117-127. [ Links ]
ASTM. 1990. D 2845. Standard test method for laboratory determination of pulse velocities and ultrasonic elastic constants of rock. American Society for Testing and Materials, West Conshohocken, PA. [ Links ]
Azzoni, A., Bailo, F., Rondena, E., and Zaninetti, A. 1996. Assessment of texture coefficient for different rock types and correlation with uniaxial compressive strength and rock weathering. Rock Mechanics and Rock Engineering, vol. 29, no. 1. pp. 39-46. [ Links ]
Brown, E.T. 1981. Rock Characterization, Testing and Monitoring. International Society for Rock Mechanics, Lisbon, Portugal. [ Links ]
Ersoy, A. and Waller, M.D. 1994. Textural characterisation of rocks. Engineering Geology, vol. 39, no. 3-4. pp. 123-136. [ Links ]
Gunsallus, K.L., and Kulhawy, F.H. 1984. A comparative evaluation of rock strength measures. International Journal of Rock Mechanics and Mining Sciences & Geomechanics Abstracts, vol. 21, no. 5. pp.233-248. [ Links ]
Gupta, V. and Sharma, R. 2012. Relationship between textural, petrophysical and mechanical properties of quartzites: a case study from northwestern Himalaya. Engineering Geology, vol. 135. pp. 1-9. [ Links ]
Howarth, D.F. and Rowlands, J.C. 1987. Quantitative assessment of rock texture and correlation with drillability and strength properties. Rock Mechanics and Rock Engineering, vol. 20, no. 1. pp. 57-85. [ Links ]
Merriam, R., Rieke, H.H., and Kim, Y.C. 1970. Tensile strength related to mineralogy and texture of some granitic rocks. Engineering Geology, vol. 4, no. 2. pp. 155-160. [ Links ]
Onodera, T.F. and Asoka Kumara, H.M. 1980. Relation between texture and mechanical properties of crystalline rocks. Bulletin of the Association of Engineering Geology, vol. 22. pp. 173-177. [ Links ]
Ozcelik, Y., Bayram, F., and Yasitli, N.E. 2013. Prediction of engineering properties of rocks from microscopic data. Arabian Journal of Geosciences, vol. 6, no. 10. pp. 3651-3668. [ Links ]
Ozturk, C.A., Nasuf, E., and Kahraman, S. 2014. Estimation of rock strength from quantitative assessment of rock texture. Journal of the Southern African Institute of Mining and Metallurgy, vol. 114, no. 6. pp. 471-480. [ Links ]
Ozturk, C.A. and Nasuf, E. 2013. Strength classification of rock material based on textural properties. Tunnelling and Underground Space Technology, vol. 37. pp. 45-54. [ Links ]
Ozturk, C.A., Nasuf, E., and Bilgin, N. 2004. The assessment of rock cutability, and physical and mechanical rock properties from a texture coefficient. Journal of the South African Institute of Mining and Metallurgy, vol. 104, no. 7. pp. 397-402. [ Links ]
Prikryl, R. 2006. Assessment of rock geomechanical quality by quantitative rock fabric coefficients: limitations and possible source of misinterpretations. Engineering Geology, vol. 87, no. 3. pp. 149-162. [ Links ]
Tiryaki, B. and Dikmen, A.C. 2006. Effects of rock properties on specific cutting energy in linear cutting of sandstones by picks. Rock Mechanics and Rock Engineering, vol. 39, no. 2. pp. 89-120. [ Links ]
Tugrul, A. and Zarif, I.H. 1998. Correlation of mineralogical and textural characteristics with engineering properties of selected granitic rocks from Turkey. Engineering Geology, vol. 51, no. 4. pp. 303-317. [ Links ]
Ulusay, R., Tureli, K., and Bider, M.H. 1994. Prediction of engineering properties of a selected litharenite sandstone form its petrographic characteristics using correlation and multivariate statistical techniques. Engineering Geology, vol. 38, no. 1-2. pp. 135-157. [ Links ]
Paper received Aug. 2017
Revised paper received Jun. 2018

