


Services on Demand
Article
 English (pdf)
 Article in xml format
 Article references
Indicators

Related links
-
 Cited by Google
 -
 Similars in Google
Share

 Permalink
Journal of the Southern African Institute of Mining and Metallurgy
On-line version ISSN 2411-9717
Print version ISSN 2225-6253
J. S. Afr. Inst. Min. Metall. vol.119 n.1 Johannesburg Jan. 2019
http://dx.doi.org/10.17159/2411-9717/2019/v119n1a4
PAPERS OF GENERAL INTEREST
Application of rock mass classification and Blastability Index for the improvement of wall control: a hard-rock mining case study
G. Segaetsho; T. Zvarivadza
University of the Witwatersrand, Johannesburg, South Africa, South Africa
SYNOPSIS
Conventional blasting rules of thumb used to develop blast designs are based on parametric ratios, with insufficient consideration of the rock mass factors that influence the achievability of final wall designs. At a hard-rock mine in Botswana, catchment berm designs were frequently unachievable, which exposed the mining operation to safety hazards such as local wallrock failure from damaged crests, frozen toes, and rolling rockfalls from higher mining levels. Increased standoff distances from the highwall reduced the manoeuvring area on the pit floor and the extraction factor that was safely achievable. Application of rock mass classification and the Blastability Index (BI) as a means to improve wall control was investigated. Zones were defined according to rock types forming the western highwall rock mass, and distinguishing rock mass classification factors were used to establish the suitable wall control designs. The approach combined rock mass classification methodologies such as the Geological Strength Index and the Rock Mass Rating, and related them to the BI and discontinuities of the rock mass to produce a design input tool that can be used to develop objective wall control designs. The designs driven by the tool inherently take into account the rock mass characteristic factors at the centre of the rock mass classification methods mentioned above, and significantly reduce the dependence on rules of thumb. It was found that this approach produces designs with explosive energy measures that are consistent with the required rock-breaking effort and the behaviour of discontinuities, while preserving perimeter walls.
Keywords: open pit mining, highwall control, rock mass classification, Blastability Index.
Introduction
Blasting is the first step in the comminution process. Various coordinated inputs contribute to its success, and in turn to the efficient execution of processes that lie downstream from the blasting step. Primary to meeting production and operational objectives of a mine, as well as the protection of human life and the mineral resource, is the achievement of highwall design specifications and competence. To this end, this study investigated the use of existing tools and knowledge for the achievement of highwall control goals at a hard-rock mine in Botswana.
Study objectives
The first objective was to establish zoning boundaries within the pit based on rock type, rock mass characteristics, and Lilly's (1986) Blastability Index (BI). The index is an empirical method of linking geological characteristics with the effectiveness of rock-breaking with bulk explosives. The second objective was to use rock mass classification to inform perimeter blast design with the BI as an indicator of potential rock response. Unlike mechanical and numerical approaches, rock mass classification features the use of empirical relationships between a rock mass and design applications. The third objective was to develop an empirical control index linking rock mass characteristics and wall control design input factors to various design outputs.
Problem statement
Control of the western highwall (WHW) of the Cut H pit has proven to be challenging in that the designed catchment berms and wall competence have been perpetually unachievable, from the pit crest to the current mining levels. This has exposed the mining operation to safety hazards such as local wallrock failure from damaged crests, frozen toes, and rolling rockfalls from higher mining levels. The standoff distances from the concerned highwall have increased, which has reduced the available manoeuvring area on the pit floor. The factor of extraction that is safely achievable has also reduced as mining cannot fully advance to the planned pit limit. The study seeks to investigate the application of rock mass classification and the BI as a means to improve wall control.
Relevance of the study to the industry
The significance of the study lies in the use of rock mass classification methods to reduce the typical dependence on inadequately informed rules of thumb applied in the perimeter wallrock blast design process. The conventional application of parametric ratios in the development of designs neglects to account for fundamental rock mass factors that affect the achievability of final wall designs.
Background
Rock-breaking mechanism
The detonation of a column of explosives induces two modes of stress in the surrounding rock mass. The first occurs in the form of a primary compressive stress wave which is transmitted to the surrounding rock immediately upon detonation, followed by a secondary tensional wave. The second stress mode induced in the surrounding rock mass is a result of gas pressure from the rapid expansion of the reacted explosive matter. The stress-strain relationship of rocks is such that they tend to be far stronger in compression than they are in tension (Cruise, 2010 ). The tensile strength of rocks is in the order of a tenth of their compressive strength. This being the case, the most likely failure mechanism of rock placed under stress is tension.
Project background
There was concern about the fact that instead of well-defined walls, batters, and berms, the WHW effectively consisted of one mildly undulated plunge from the top benches to the present mining grade levels (approximately 200 m); the designed catchment berms in-between bench stacks were not in their correct form, and the stepwise bench and stack profiles were reduced to an almost single drop of highwall face. Figure 1 depicts an east-west section through the WHW showing the planned pit profile and the profile actually achieved. The superimposition of the two profiles demonstrates the extent to which the designed wall profile has not been achieved, particularly along the WHW.
Several subsequent concerns came to light following this observation, the most obvious being the fact that there was no catchment facility for any rockfalls from higher benches. This created a hazardous work environment where both men and machines were at risk from falling rock fragments and localized failure of the highwall.
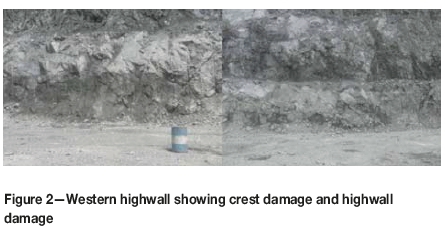
A decision was taken to look into the contribution of drilling and blasting to the problem. An investigation into the blasting practices at the mine established that there were four main rock types (of hardness ranging between 138 MPa and 313 MPa) forming the pit and its walls. It was further noted that the approach taken to wall control blasting did not pay particular attention to the geological and geotechnical characteristics of the various rock mass zones corresponding with the rock types present. Instead, a blanket design approach was followed, the result of which was an inconsistent outcome featuring various areas of acceptable highwall competence, highwall material hangups, back damage, overbreak, and localized failure along weakness planes (Segaetsho, 2014). Figure 2 presents the WHW showing crest damage and highwall damage.
Study approach
The literature was reviewed to establish the relationship between the various elements at play during rock-breaking and the characteristics of the rock mass. The review concentrated on the integration of rock mass classification inputs into final wall blasting and the more specialized perimeter blasting techniques used in the industry.
Data was collected from the years 2014 to 2016. The geotechnical database of the mine was used as the primary source of quantitative data. The data comprised borehole logs, laboratory test results, field measurements and observations, photographic data, as well as computer-generated sections and plans. Further data was collected through a series of site audits.
Analysis was led by querying the potential influence of the joint planes traversing the WHW of the pit, and the identification of joint sets with orientations that had the greatest potential to exacerbate the problem. The next step was to separate the geotechnical data into zones informed by the rock mass classification elements of the Rock Mass Rating (RMR), Lilly's BI, and joint plane spacing. The calculated outputs were then grouped according to the four main rock types forming the rock mass of the WHW of the pit.
Results and analysis
Drilling and blasting
It was observed that inadequate attention was paid to the orientation of blast patterns relative to the shape and constraints of the respective blocks being blasted. This manifested in two ways. The first manifestation was that patterns were not correctly aligned to the geometric conditions of the blocks, which increased the blast impact on the highwall. The effect described is shown by the damage contours (dotted ellipses surrounding the holes) modelling the regions of energy influence of each row of blast-holes in Figure 3. The modelling was done using blast design modelling software (based on the Holmberg-Persson model, 2000). The figure shows that the energy of the first two rows of the block (from left to right) extended well into the highwall. The red columns represent explosives charges while the short columns above them represent lengths of stemming. The target grade is shown by the blue horizontal line at zero metres.
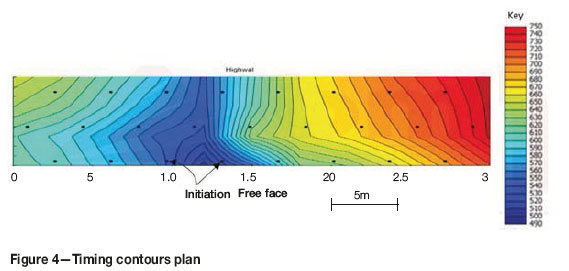
The second manifestation was due to an incorrect timing and firing direction relative to the designed pattern layout. This resulted in the reversal of burden and spacing, causing overburdening of holes and tight breaking conditions at the highwall as suggested by the timing contours in Figure 4.
Rock mass data
Stereographic data
Planes of the weighted data biased towards low-spread pole data-points (i.e. focusing on data-points that reflected clusters of poles) were plotted. The resultant number of data points considered was concentrated from 142 to 82 poles. These were subsequently aggregated into clusters from which the joint set planes were plotted. The planes representing the aggregate orientation of the joint sets were plotted together with the orientation of the WHW as shown in Figure 5 (plotted using Stereonet 9 software). The plane data is colour-coded and presented in the adjacent key. The ranking denotes the hierarchy of influence of the various joints, with 5 representing the greatest influence.
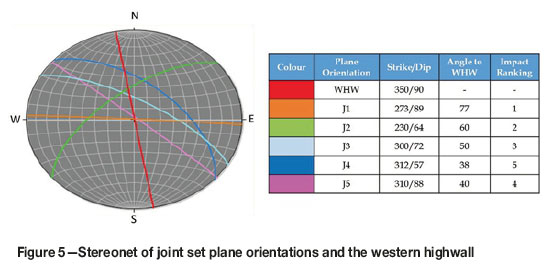
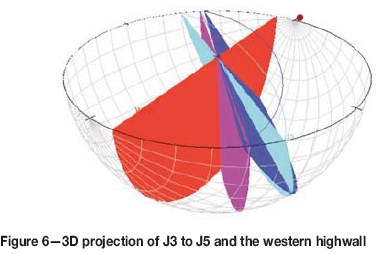
It was established that three joint sets (J3, J4, and J5) out of the five have an orientation that is within 60 degrees of the orientation of the highwall. Worsey, Farmer, and Matheson (1981) and the NHI (1991) agree that such joint sets have the greatest potential to adversely affect the achievability of the planned final wall blasts and the stability of the resultant wall. Figure 6 (plotted using the Visiblegeology online application) is a 3D representation of the planes of J3 through J5 and the highwall.
Lewandowski, Luan Mai, and Danell (1996) concluded that the negative impact of jointing orientation on the achievement of the final wall design stemmed from the attenuation of the perimeter blasting stress wave at the joint plane. Their findings highlighted the fact that the perimeter blast stress waves were most attenuated when the angle between the joint plane and face under consideration was in the range of 15 to 45 degrees; with maximum attenuation observed at 45 degrees. With this in mind, a closer look at Figure 5 reveals that J4 and J5 are five and seven degrees respectively from this angle of maximum stress wave attenuation. This makes them dominant contributors to the wall control difficulties experienced at the mine and confirms the presence of underlying root causes to the problem at hand.
It is suspected that joint set J4 contributes the most to the observed failure of bench crests. This is due to the fact that it not only has the closest to parallel orientation relative to the highwall, but it also has an angle and direction of dip (dipping diagonally into the pit) that make it easier for sections of wall crest to fail when excited by the various mechanisms at play during primary and perimeter blasts. Set J3 could also bring about a similar effect, although to lesser extent as it is more steeply dipping.
Mechanical properties
One of the rock types, metagabbro, has a uniaxial compressive strength (UCS) of 351 MPa (maximum), which significantly surpasses that of the other rock types present. Tonalite, the second hardest rock, has a maximum UCS of 251 MPa, and the dolerite and pegmatite have maximum UCS values of 162 MPa and 235 MPa respectively. The wideranging difference in UCS values means that the rock response to blanket blast design inputs, of both primary and perimeter nature, will vary significantly. The challenge that then arises is that calibrating the blast towards the hardest rock increases the potential of damage to perimeter sections where lower compressive strength rock types are encountered.
The Poisson's ratio of a rock indicates the relationship between lateral and longitudinal strain of a sample under stress. It enables, for example, the establishment of the disposition of the rock in question to crack propagation during pre-splitting. This was of particular interest to this study as the rock samples were found to have significantly low Poisson's ratios (relative to the maximum value of 0.5), ranging between 0.013 and 0.038. The significance of this is that rocks with low Poisson's ratios are more favourably responsive to wall control blasting efforts such as pre-splitting.
The Young's moduli - given by the relationship between stress and strain - indicate that the rocks at the mine have a comparatively high ability to withstand elastic deformation due to applied stress (the higher the Young's modulus, the higher the stiffness). Values ranged between 65 GPa for pegmatite (least stiff rock type) and 75 GPa for metagabbro (most stiff rock type). This speaks directly to the inversely proportional relationship between the Young's modulus and the heave energy required from the explosive used (Roy, 2005). Stiff rock tends to result in a higher equalization energy from the early stages of the detonation process, which is more complementary to the application of high brisance explosives such as pure emulsion.
Method of data collection
Each of the data-sets comprises of measurements taken from runs of core extracted from holes drilled into the rock mass, and at varying depths ranging from: 50 to 519 m for dolerite, 4 to 379 m for metagabbro, 60 to 279 m for pegmatite, and 131 to 260 m for tonalite. The number of joints encountered within those lengths of core, as well as their orientation relative to the core axis, were recorded. The mean number of joints per metre (J/m, where J/m approximates Jv) was then calculated, as well as the estimated in situ block sizes (Xi in m3). The joint spacing was estimated as a function of the in situ block sizes calculated.
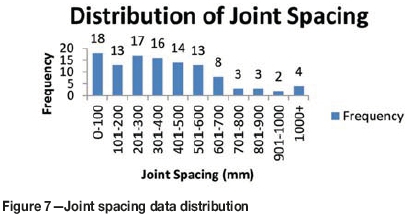
Joint spacing
The distribution of joint spacing in the collective sample is shown in Figure 7. This graph is bimodal and skewed to the right. The overall skewing direction suggests a predominance of lower measurements of joint spacing; the bimodality shown by the two local maxima suggests the existence of non-homogeneity within the data-set. For the purpose of this study, the data was not further segmented into two subpopulations. From the sample, the joints most frequently intercepted were in the 0-100 mm spacing range, followed by the 200-300 mm spacing range. The descriptive analysis of the sample joint spacing data draws attention to inputs of split designs as a standard spacing of 1.2 m is applied across the board. Rorke (2003) and Chiappetta (1991) suggested that the occurrence of more than two or three joints within a single span of blast-hole spacing has an adverse effect on wall control. There is an opportunity for this to be the case, given the modal spacings in the data described.
Rock Mass Rating
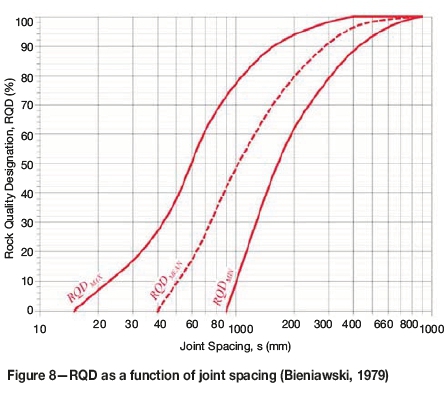
Rock Quality Designation values (ROD - the percentage of intact core pieces longer than 100 mm in the total length of core: Palstrom, 2005) were extrapolated from Figure 8 using the joint spacing for each data-point. The respective average ROD values were 84% for dolerite, 92% for metagabbro, 87% for pegmatite, and 98% for tonalite. Based on the data considered, the rock mass quality is classified as 'Good' in accordance with Deere et al.(1967).
The UCS ratings (A1) used in the calculation of the Rock Mass Rating (RMR - a geomechanics classification system originally developed to assess tunnel stability and support requirements; Bieniawski, 1973) were based on the laboratory test data from core samples. Average UCS values were utilized to derive the ratings in each case. This was due to the fact that laboratory test readings are typically biased due to the practice in which the best core samples are selected and submitted for testing (Karzulovic and Read, 2009).
ROD ratings (A2) were derived using ROD percentage values established by graphical extrapolation from Figure 8. Various ratings for spacing of discontinuities (A3) were selected based on the corresponding joint spacing data. A standard rating (A4) for the condition of discontinuities (25) was selected based on the overall impression across the rock mass, and the fact that the main rock type in the mine's rock mass was established to be a metamorphosed gabbro with tight-set discontinuities.
Through the site observations made during the study, it was concluded that groundwater, particularly in the wall in question, was not present. As such, a dry condition classification was taken with a rating (A5) of 15 applied.
It was the opinion of the authors that a rating (B) of 25 was appropriate for the adjustment relating to the orientation of discontinuities. This conclusion was based on the observation that the loss of crests of berms planned for the WHW appeared to be considerably influenced by the orientation of discontinuities, particularly those that are near-parallel to the strike of the highwall (Figure 6).
The respective ratings were summed into the RMR values using the following expression:

The average RMR values calculated for the dolerite, metagabbro, pegmatite, and tonalite rock types were 55, 60, 57, and 64 respectively.
Geological Strength Index (GSI)
The GSI (Hoek, 1994) uses the relationship between rock mass structure and the surface conditions of discontinuities to estimate the overall competence of a rock mass. Values from the rock mass were considered in a range of values of 10 GSI units as read from the GSI chart for jointed rocks by Hoek, Marinos, and Marinos (2005). The mean value of each respective range is related to the RMR89 (Rock Mass Rating version of 1989) through Equation [2], which relates GSI to RMR:

The expression holds when the GSI is greater than 18, the RMR is greater than 23, and the water condition is considered dry (rating of 15). The very nature of the GSI does not afford one the ability to accurately pinpoint a single value of GSI applicable to a rock mass. Instead, a range of values is noted in collection of data from a rock face and related to the mean RMR value or corresponding range of RMR values.
Blastability Index (Bl)
The Rock Mass Description (RMD - which gives an indication of the in situ block size) was calculated at the respective data-points using the equation (Nabiullah, Pingua, and Misra, 2003):

where, Xi is the in situ block size in metres. Average ratings of RMD for dolerite, metagabbro, pegmatite, and tonalite were calculated at 14, 14, 13, and 16 respectively.
Rating values for joint plane spacing (JPS) were derived by applying a modification to Lilly's JPS categories as informed by the joint spacing data. Ratings were thus weighted to reflect values representative of the joint spacing of a data point within a rating category.
The rating for joint plane orientation (JPO) was arrived at with consideration of the collective effect of the joints in Figure 6. This rating was applied across the calculation of the BI as discontinuity orientations were assumed to be consistent across the rock mass.
The specific gravity influence (SGI) ratings of the respective rock data-sets were calculated using the expression (Lilly, 1986):

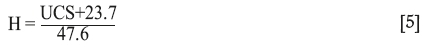
The rock hardness factor (H) ratings were calculated using the following empirical equation from the work of Lilly (in Rorke, 2003):
The five rating components of the BI were summed to arrive at a BI value for each data-point using the equation:

Average values of BI calculated for dolerite, metagabbro, pegmatite, and tonalite were 37, 38, 33, and 38 respectively. BI values in the range of 20 to 40 are considered to be indicative of relatively easy blasting (Chatziangelou and Christaras, 2013). This implies that taking all the factors above into consideration, the desired rock-breaking outcomes should be achievable to a significant degree if the designs applied were optimally aligned with the rock mass characteristics highlighted.
Slope mass rating (SMR)
The SMR brought focus to the potential for failures of blocks and wedges due to the interaction of joint planes relative to the strike and dip of the WHW, as well as to the excitation energy from blasting. The SMR is derived using the following equation, applying the average RMR in each case:

where F1 is given by the difference between the joint and face dip directions, F2 is the modulus of the slope dip, F3 is the difference between the joint dip and the slope dip, and F4 is the blasting factor (an adjustment that depends on the type of excavation or blasting used. It ranges from +15 for a natural slope to -8 for deficient blasting).
The SMR values were found to be within a range of 50 to 60; classified as Class 3 according to Table I. These figures are conservative as the application of smooth wall blasting (in the form of post-splitting) was neither consistent nor correctly executed at the mine.
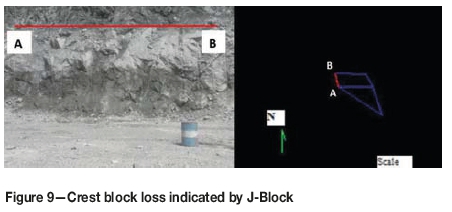
The inference drawn from the affore-stated SMR classification was that there was potential for localized failure where bench crests are isolated by the intersection of the joint planes and the WHW. To confirm this, J-Block software was used to model the block that would be formed along the crest of a WHW bench due to joint interaction. The juxtaposed images in Figure 9 support the overall hypothesis in that the J-Block analysis block profile and orientation were consistent with the profile of a crest that is persistently lost along the WHW, even in areas where the post-split was observed to have performed relatively well. The red line as well as letters 'A' and 'B' in the images on the left and right are consistent.
Design input tool
An empirical design input tool was developed by plotting all the data analysed into a series of charts. The tool consists of the graphical representation of the design inputs for the four rock types forming the rock mass in this study (Figures 10-13).
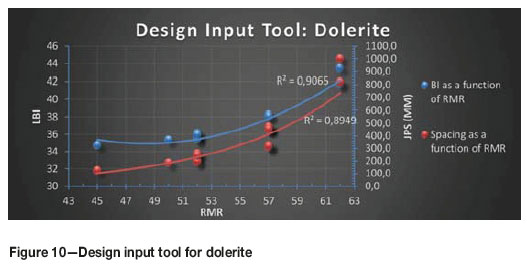
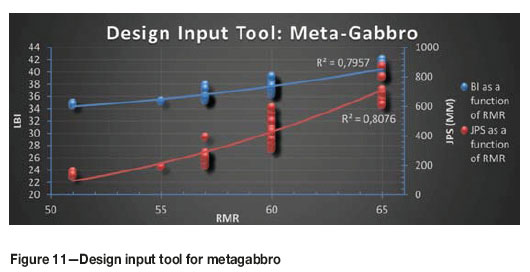
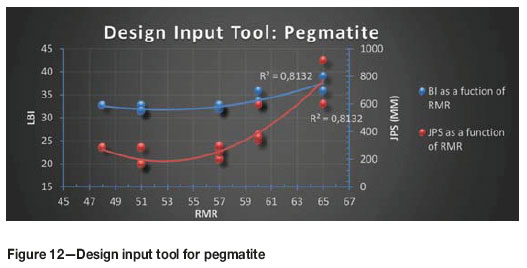
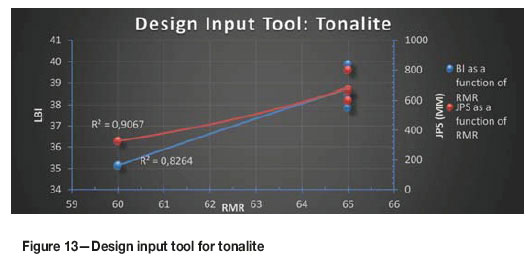
The zoning of the inputs according to the rock type and rock characteristics allows for the concurrent consideration of various elements that influence the degree of adherence to rock-breaking plans and designs, as and when the different rock types are encountered. The primary vertical axis represents Lilly's BI, while the secondary vertical axis represents the joint plane spacing (JPS). The values on the horizontal axis are RMR values.
Goodness-of-fit (R2) values obtained for the plotted data ranged between 0.8 and 0.91. This suggests that the trend lines plotted in the various graphs estimate the behaviour of the data well. In practical terms, the design input tool (DIT) graphs can be used to estimate design inputs concerned with reasonable confidence (with due consideration of the data sample size).
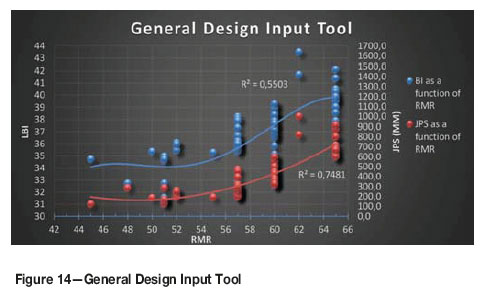
The General Design Input tool (GDIT) is a collation of the data in Figures 10-13. In an ideal setting where rock type boundaries are clearly defined using geological models and transcribed into physical demarcation in the pit, the graphs are the first choice in design input derivation. In cases where such information is not readily available, an all-inclusive GDIT will find its use as an aggregate representation of the state of the rock mass. This input tool is shown in Figure 14. As it combines distinct properties from different rock types, the goodness of fit of the graphs estimating the trends of the data is considerably lower than those observed in the respective independent DITs (0.55 for the RMR:BI data and 0.75 for the RMR:JPS data). This is expected as it is indicative of the non-uniform distribution of various properties in a rock mass.
Application of the DIT
The process of the application of the DIT is shown schematically in Figure 15. The sequence of application is as follows.
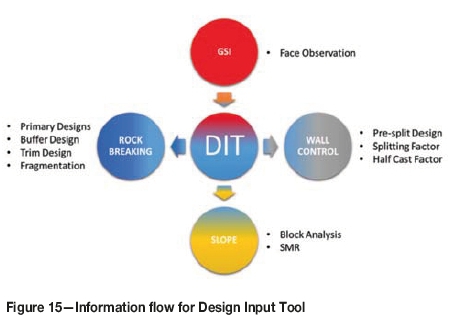
1. GSI data is collected on the mining face by a competent technical person using a GSI chart such as that from Hoek, Marinos, and Marinos (2005) or a suitable alternative version. By observing the in situ rock mass structure and the discontinuity surface conditions, the combination of the two can be used to estimate a range of GSI values from the diagonal contours of the chart. The subjectivity of the data collected may influence the downstream application of the tool as this is the key input into the tool.
2. The mean value of the GSI range estimated is then established, and the associated RMR value is calculated using Equation [2].
3. If the rock type in which the prospective mining activity will take place is known from the geological model, the relevant DIT for that rock type can be applied. When more than one rock type traverses the ground that will be mined (as well as the contacts of the rock types in question), then the respective separate DITs can be utilized. Where this information is not available for the particular section of the rock mass, or it is not practicable to apply specific input due to limited availability of information, the GDIT can be used.
4. In the case of specialized wall control blasting such as pre-splitting, the estimated RMR can then be used to determine the joint spacing for the rock type concerned on the DIT. With a known joint spacing, an informed decision can be made on the maximum hole spacing that does not exceed three joints per unit spacing (Rorke, 2003; Chiappetta, 1991). An appropriate splitting factor (an indication of the explosives energy applied, given by the ratio of charge in kilograms to the area in square metres between two adjacent split holes) can then be calculated based on the mechanical properties of the rock and the relevant properties of the explosives. Through monitoring of the results of designs applied, the HFC (half cast factor - ratio of half barrel length to drill-hole length) achieved can be measured and plotted back into the DIT as a function of the RMR.
5. Where rock-breaking is concerned with primary, buffer, or trim blast designs that are adjacent to the highwall, the estimated RMR can be used to extrapolate the BI value from the DIT. The BI value is in turn linked to the appropriate design powder factor as described by Lilly (1986). With a known powder factor, the geometric bench blast designs can be calculated, making appropriate adjustments for sensitivity due to proximity of the highwall. Measured outcomes of the designs based on the DIT can then be fed back into the DIT to continuously improve precision.
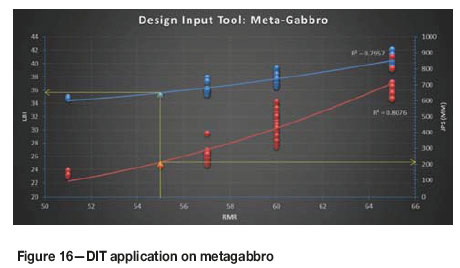
Rock mass classification and Bl-informed blast design - case study of DIT application
To demonstrate the application of rock mass classification in wall control as coordinated by the DIT, the following case study is presented.
1. Rock type: known to be predominantly metagabbro for the WHW section under consideration.
2. GSI description: very blocky, partially disturbed rock mass, with fair and moderately weathered surfaces.
3. GSI range: 45-55; mean GSI: 50.
RMR = GSI + 5 = 50 + 5 = 55
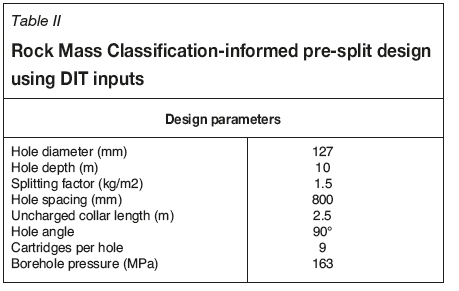
4. DIT: At a RMR of 55, the joint spacing expected is approximately 220 mm and the BI rating approximately 36.
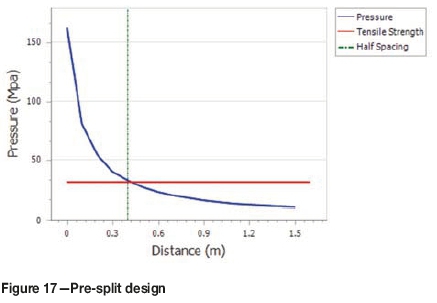
Borehole pressure and hole spacing for a pre-split can be calculated using the equations (Rorke, 2003):
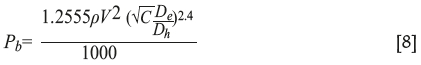
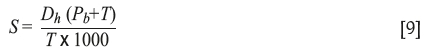
where ρ is the explosive density, V is the explosive velocity of detonation, C is the percentage of explosive in a hole as a fraction (length of explosive)/(length of hole), De is the diameter of explosive, Dh is the diameter of the hole, S is the hole spacing, and T is the tensile strength of the rock. The hole diameter was pre-determined as 127 mm, as this is the smallest blast-hole drill at the mine. If set to 800 mm, the hole spacing selected would ensure that not more than three joints are spanned by any two adjacent blast-holes. This would increase the effectiveness of the pre-split in forming the split plane along the new highwall. It is also worth noting that the design borehole pressure in this case is greater than the respective rocks' tensile strengths (estimated as a tenth of the UCS), but remains lower than the UCS (ten times the tensile strength shown by the red line in Figure 17). Crushing damage and weakening of the new highwall would thus be avoided. Emphasis is placed on the need for the pre-split to be drilled, charged, and fired ahead of the trim and primary blasts.
5. Using the relative weight strength of the bulk explosives used, data from the empirical graph from Lilly (1986) was adapted to plot the relationship between the BI and the powder factor as shown in Figure 18. The powder factor derived from the graph is approximately 0.95 kg/m3. This powder factor was within the range in which blasts were found to perform well in terms of the fragmentation achieved and the muck diggability. This is therefore a well-matched powder factor for the rock type. As more site data linking the BI derived from the DIT with the powder factor that produced satisfactory results is collected, the graph can be updated to increase the representation of site-specific inputs, thereby improving its precision. With a known powder factor, other parameters of the design can then be calculated using the equation:
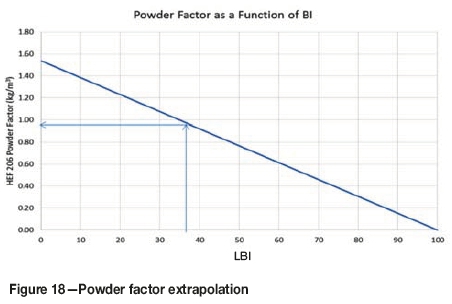
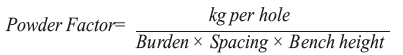
The ideal spacing-to-burden ration is typically set at 1.15 for optimum distribution of energy (Kecojevic and Komljenovic, 2007). The burden and spacing consistent with a powder factor of unity were calculated as 3.2 m and 3.7 m respectively. Figure 19 is a section through a trim blast design developed using the DIT process. The modelled damaged contours shown in this section extend approximately 1 m into the subsequent highwall, suggesting that the impact of the blast on the wall, as well as the resultant damage, would be controlled to a considerable degree.
Conclusion
The separation of data according to geological zones highlighted the variation of the properties of the rock mass in each zone. The variable blast response observed was therefore justified.
The approach proposed to resolve the problem is viable and practical. It outlines the dynamic incorporation of information that is typically available, but which is not used effectively (if at all) for reporting purposes after the fact. It encourages the elimination of information silos between stakeholders along the mine value chain and facilitates the use of information in the formulation of scientifically driven wall control and primary blast designs.
The implementation of the DIT requires no capital expenditure as rock mass classification data is collected from the exposed mining faces and supplemented with existing exploration and laboratory test data. Designs developed with inputs from the tool are conservative and biased towards highwall preservation. The DIT is a simple yet powerful tool that consolidates knowledge about the rock mass and relates it to the stability-factored inputs that are otherwise overlooked in favour of a blanket rock-breaking approach. By reducing the human factor of generalized opinion in the design process, the adoption of the DIT approach will afford the operation the ability to proactively manage crest loss and highwall damage along the WHW.
References
Bieniawski, Z. 1973. Engineering classification of jointed rock masses: Transaction of the South African Institution of Civil Engineers, vol. 15, no. 12. pp. 335-344. [ Links ]
Bieniawski, Z. 1979. The geomechanics classification in rock engineering classifications. Proceeding of the 4th Congress of the International Society of Rock Mechanics, Montreux, Switzerland. Balkema, Rotterdam. pp. 55-95 [ Links ]
Chatziangelou, M. and Christaras, Β. 2013. A geological classification of rock mass quality and blast ability for intermediate spaced formations. International Journal of Engineering and Innovative Technology, vol. 4, no. 9. pp. 52-61. http://www.ijeit.com/Vol%204/Issue%209/IJEIT1412201503_10.pdf [ Links ]
Chiappetta, F. 1991. Pre-splitting and controlled blasting techniques. Proceedings of the Third Blast Technical Instrumentation and Explosives Application Seminar, San Diego, USA. Blasting Analysis International, Allentown, PA. pp. 171-186. [ Links ]
Cruise, J. 2010. Rock breaking - A science, not an art. Proceedings of the Drilling and Blasting School, Misty Hills Conference Centre, Cradle of Humankind, Gauteng, South Africa, 8 June 2010. Southern African Institute of Mining and Metallurgy, Johannesburg. pp. 25-40. [ Links ]
Deere, D., Hendron, A., Patton, F., and Cording, E. 1967. Design of surface and near surface construction. Proceedings of the 8th US Symposium on Rock Mechanics: Failure and Breakage of Rock. Society of Mining Engineers, American Institute of Mining, Metallurgical, and Petroleum Engineers, New York. pp. 237-302. [ Links ]
Hoek, E.,1994. Strength of rock and rock masses. International Society of Rock Mechanics News Journal, vol. 2, no. 2. pp. 4-16. [ Links ]
Hoek, E., Marinos, V., and Marinos, P. 2005. The Geological Strength Index: application and limitations. Bulletin of Engineering Geology and the Environment, vol. 64, no. 1. pp. 55-65. [ Links ]
Holmberg, R. and Persson, P. 2000. The Swedish Approach to Contour Blasting. International Society of Explosives Engineers. Stockholm, Sweden. pp. 1-14 [ Links ]
Hudson, J. 2013. Comprehensive Rock Engineering. Principles, Practice and Projects. Vol. 3. Imperial College of Science, Technology and Medicine. London, uK. pp. 4-13. [ Links ]
Karzulovic, A. and Read, J. 2009. Rock Mass Model. Guidelines for Open Pit Slope Design. CSIRO Publishing, Australia. Chapter 5. pp. 83-85. [ Links ]
Kecojevic, V. and Komljenovic, D. 2007. Impact of burden and spacing on fragment size distribution and total cost in quarry mining. Transactions of the Society for Mining, Metallurgy and Exploration, vol. 320. pp. 135. [ Links ]
Lewandowski, T., Luan Mai, V., and Danell, R. 1996. Influence of discontinuities on presplitting effectiveness. Proceedings of the Fifth International Symposium on Rock Fragmentation by Blasting, Montreal, Canada. Balkema, Rotterdam. pp. 25-29. [ Links ]
Lilly, P. 1986. An empirical method of assessing rock mass blastability. [ Links ]
Proceedings of the Large Open Pit Mining Conference, Newman, WA. Australasian Institute of Mining and Metallurgy, Melbourne. pp. 89-92. [ Links ]
Nabiullah, J., Pingua, Β., and Misra, D. 2003. Design of drilling and blasting pattern for optimum fragmentation - A case study. Proceedings of Geomechanics and Ground Control. Allied Publishers, India. pp. 98. [ Links ]
National Highway Institute (NHI). 1991. Rock blasting and overbreak control. Course 13211. US Department of Transport. pp. 176-182. [ Links ]
Palmstrom, A. 2005. Measurements of and correlations between block size and rock quality designation (RQD). Tunnelling and Underground Space Technology, vol. 20, no. 4. pp. 362-377. [ Links ]
Rorke, A. 2003. BME training module: Pre-splitting. Bulk Mining Explosives, Johannesburg. South Africa. pp. 1-24. [ Links ]
Roy, P. 2005. Rock blasting, effects and operations. Central Mining Research Institute, Dhanbad, India [ Links ]
Segaetsho, G. 2014. Tati Nickel Mining Company baseline drilling and blasting audit. Explosives Engineeringfor Surface and Underground Mines. University of the Witwatersrand, Johannesburg, South Africa. pp. 7-36. [ Links ]
Worsey, P., Farmer, I., and Matheson, G.,1981. The mechanics of presplitting in discontinuous rock. Proceedings of the 22nd US Rock Mechanics Symposium. Missouri, USA. American Rock Mechanics Association, Alexandria, VA. pp. 205-210. [ Links ]
Paper received May 2017
Revised paper received Jun. 2018

