


Services on Demand
Article
 English (pdf)
 Article in xml format
 Article references
Indicators

Related links
-
 Cited by Google
 -
 Similars in Google
Share

 Permalink
Journal of the Southern African Institute of Mining and Metallurgy
On-line version ISSN 2411-9717
Print version ISSN 2225-6253
J. S. Afr. Inst. Min. Metall. vol.119 n.1 Johannesburg Jan. 2019
http://dx.doi.org/10.17159/2411-9717/2019/v119n1a2
PAPERS OF GENERAL INTEREST
Using laser scanner face mapping to improve geotechnical data confidence at Sishen mine
T.M. RussellI, II; T.R. StaceyII
IKumba Iron Ore, South Africa
IIUniversity of the Witwatersrand, South Africa
SYNOPSIS
Face mapping is a simple but invaluable means of geological and geotechnical data acquisition whereby intact rock properties, rock mass properties, discontinuity properties, and structural orientation can be assessed. Although traditionally done via direct contact with the mapping face through techniques such as line mapping or window mapping, remote face mapping using various digital techniques has become increasingly popular in recent years. Sishen is a large open pit mining operation requiring a comprehensive geotechnical data-set to evaluate pit wall design and stability with the necessary level of confidence. Geotechnical borehole data, face mapping data, geotechnical laboratory testing data, and implicit structural models provide the main sources of this information. Although a large geotechnical borehole database has always been maintained at the mine, face mapping has in the past been restricted to sporadic and isolated stability assessments. In 2013 the mine acquired a terrestrial laser scanner with the resolution, photographic capabilities, and software required to carry out geotechnical face mapping. A face mapping procedure was set up based on accepted face mapping methods, the data requirements of the mine, and capabilities of the laser scanner system. Mapping data obtained from the scans was integrated into the Acquire geological data management system, a purpose-designed structured query language (SQL) database system used for storing the mine's geotechnical data. Within the geotechnical design process, having face mapping data available has improved confidence in the properties of the rock mass and structural environment, allowing for better definition of geotechnical design sectors. Overall, the face mapping and geotechnical analysis features of the terrestrial laser scanner in use make it an invaluable geotechnical data capture tool, provided a system is in place to store mapping data in a manner that allows for meaningful rock mass and structural information to be produced.
Keywords: open pit mining, geotechnical data, face mapping, terrestrial laser scanner.
Introduction
Fundamental to the geotechnical design process is the acquisition of a reliable and complete geotechnical data-set. Geotechnical data acquisition will typically commence during the early stages of a project and continue well into the operational life of the mine, with the data confidence progressively increasing as the amount of data captured increases.
Sishen mine currently bases all open pit geotechnical designs and geotechnical risk assessment on geotechnical borehole data in conjunction with interpreted structural models. Boreholes are logged and the data is captured in an ongoing process. This process forms the initial step in the geotechnical design and risk assessment process whereby the raw data is used to classify the strength properties for each lithology, provide inputs for geotechnical block models, and ultimately provide the inputs for slope design analyses. To date, borehole data has provided the only large-scale, organized data-set for input into geotechnical analyses at Sishen. Although borehole data is the best and most comprehensive form of geotechnical data, there are some shortfalls that can be addressed by other data collection methods. These shortfalls are as follows.
► Boreholes are generally not oriented; although oriented drilling has been attempted at Sishen, it has proven to be slow, costly, and generally unreliable.
► Most boreholes drilled from surface are vertical, capturing limited data pertaining to sub-vertical and inclined features. As with orientated boreholes, inclined borehole drilling has been attempted, with limited success at Sishen.
► Borehole drilling is a relatively slow and expensive means of data capture.
► Boreholes capture limited and potentially unreliable data pertaining to discontinuity orientation, spacing, and persistence.
The shortfalls in geotechnical borehole data collection relate specifically to the fact that borehole core represents a small, relatively disturbed sample of the overall rock mass. This paper presents a practical means of adding face mapping based on laser scanner to the geotechnical data collection, storage, and analysis process. The aim of the paper is to illustrate how geotechnical face mapping has been used to increase confidence in geotechnical data at Sishen, and how this has led to optimization of interim and final pit boundary designs.
Sishen Iron Ore Mine is located approximately 5 km to the southwest of the town of Kathu in South Africa's Northern Cape Province (Figure 1). The mine is one of the largest single open pit mining operations in the world, consisting of a series of interconnected pits extending approximately 12 km in a north-south direction. The pit width varies between approximately 1 km and 3 km, with a maximum depth in 2017 of approximately 260 m (Figure 2).
Geological setting
Interim slopes and final pit boundaries at Sishen are generally excavated into faulted and folded banded iron formation, shale, andesitic lava, or manganese-rich chert breccia. Banded iron formation (Figure 3) and shale units on the mine exhibit anisotropic strength properties and the stability of slopes excavated into these units is heavily dependent on local bedding orientation.
Laser scanner face mapping
The practical problems associated with manual face mapping have been addressed with advances in technology that enable face mapping using a digital image that has been draped over a 3D point cloud of the mapping face.
Most literature refers to 3D photogrammetry techniques for this purpose, whereby stereo photos are used to generate the required point cloud of the face (Read and Stacey, 2009). Although more practical than manual face mapping, digital photogrammetry does have drawbacks inasmuch as a surveyed reference point needs to be positioned on the face, and two camera tripod positions need to be accurately surveyed.
A newer technique for digital face mapping uses 3D terrestrial laser scanning data. In comparison with photogrammetry, laser scanner mapping is fast and efficient. With the ability to sample several hundred thousand points per second, a terrestrial laser scanner can create a high-resolution point cloud covering several hundred square metres in a couple of minutes. The scan points themselves typically include X, Y, Z, and intensity information, and can include true colours through the use of concurrent digital photography. Georeferencing using various techniques, in conjunction with the use of concurrent digital photography, allows for an accurate representation of a rock face in real 3D space (Feng and Röshoff, 2006; Slob and Hack, 2007).
Various methods for extracting geotechnical data trends from laser scanner point clouds have been examined since the inception of the technology. These include automated techniques that examine orientation trends to derive structural information about mapping faces, and semi-automated techniques that rely on user structural interpretations of specific features of a mapping face (Feng and Röshoff, 2006; Slob and Hack, 2007).
An automated approach outlined by Slob and Hack (2007) involves creating a digital terrain model (DTM) from the scan points of a scanned face and using the orientation of the individual DTM facets to derive structural trends. The theory behind this is that if all facet orientations for a face are plotted on a stereonet, major planes will be exposed as point concentrations due to the predominant facet orientations on the mapping face.
The more commonly accepted semi-automated approach follows on from the digital photogrammetry technique, with the user selecting geological features on the 3D digital representation of the mapping face and the software calculating parameters such as orientation, area, and length for the selected portion of the scan (Feng, 2001; Feng and Röshoff, 2006; Slob and Hack, 2007). In reality, modern software packages have the functionality to further automate such features by intuitively selecting planes with similar orientation as the user-selected plane (Maptek, 2013).
McQuillan (2013) gives a direct comparison between laser scanner face mapping using a terrestrial laser scanner system and photogrammetric face mapping using the Sirovision system. The laser scanner system was generally found to be superior in terms of the following.
► The laser scanner provided faster and easier data collection.
► The laser scanner provided faster data processing and was less demanding on software systems.
► More accurate discontinuity orientation measurements were obtained using the laser scanner (up to 15° difference in dip measurements between the two techniques was observed).
► Planes oblique to the exposed face were more readily observable with the laser scanner.
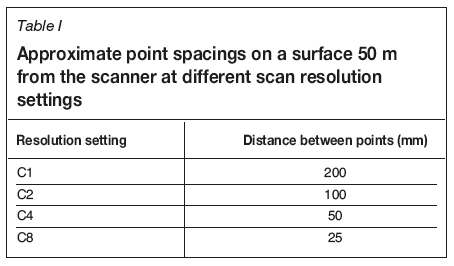
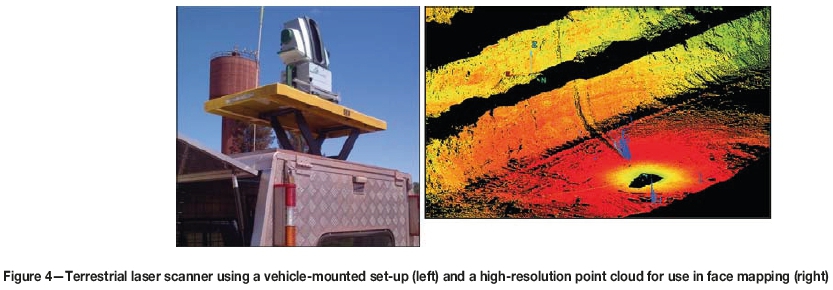
In 2013 Sishen purchased a terrestrial laser scanner with face mapping capabilities to replace the Sirovision system as a means of gathering geotechnical data from exposed pit faces. The scanning unit is vehicle-mounted (Figure 4) and is operated from inside the vehicle via a wi-fi connection using a tablet device. The scanner is capable of scanning over a horizontal range of between 0 and 360 degrees with a fixed vertical range of 80 degrees. In terms of distance the scanner has ranges of 500 m, 1000 m, and 1400 m for surfaces with low (10-40%), medium (40-80%) and high (>80%) reflectivity respectively. In practical terms scans are usually done within 200 m of the target surface, with several scans from different positions making up the overall scan image for larger areas. According to the manufacturer's specifications, scan points are measured to an accuracy of 8 mm at a range of 200 m, under control conditions. Scans are taken on a stop-and-go basis with the surveyor stopping the scanner vehicle to carry out a scan at each of the required scan points. Approximate scanner point spacings at a range of 50 m for different scanner resolution settings are given in Table I.
Face mapping procedure
A standardized face mapping protocol was set up for the mine based on the mapping data requirements, accepted face mapping methodology, and the capabilities of the scanner system. In principle, as the final pit boundaries are mined out the survey department is dispatched to scan the exposed faces with the laser scanner. The scanner data is then used for face mapping and structural stability analysis by the geotechnical engineering section. The terrestrial laser scanner's associated software package is used to carry out face mapping on the laser scanning data. A key feature of the system is the scanner's ability to take a high-resolution concurrent digital photograph with a scan using a built-in camera. The system's software has the ability to reference individual scan points with the corresponding photographic pixel. A second software feature recognizes and connects adjacent scan points to create a 3D surface draped over the scan point cloud from the scanner's perspective. Through its built-in referencing system the software overlays the digital photographic image on the 3D surface representing the scanner point cloud with millimetre accuracy, as illustrated in Figure 5.
The scanner software allows for the accurate measurement of surface orientations through built-in geotechnical tools, as well as any other spatial measurement that may be required through a set of built-in CAD functions. For the Sishen mine face mapping procedure the following parameters were mapped for each scanned face.
► Discontinuity orientation (Figure 6)
► Discontinuity spacing and persistence, directly measured for exposed planes (Figures 7)
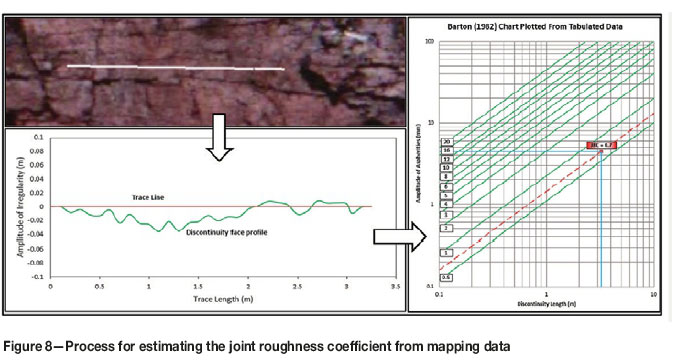
► Large-scale roughness for exposed discontinuity planes (Figure 8)
► The orientation and dimensions of the mapping face itself.
As a standard, when a structural feature is measured on a mapping face it is classified as either 'bedding', 'joint', 'fault', or 'other'.
With respect to large-scale joint roughness, a feature of the scanner software referred to as 'Colour by Distance from Object' was utilized in place of the built-in roughness analysis functionality. The specific tool allows for colour ranges to be set up on one CAD object based on the distance to a reference object. The tool allows for the export of distance measurements at discrete points on the object in question. If a straight line is traced along the portion of a scan surface representing a discontinuity surface, the tool can be used to determine the amplitude of the irregularities. This is then used to determine the joint roughness coefficient (JRC) from the Barton (1982) JRC chart, as illustrated in Figure 8.
Scanner accuracy will affect roughness measurements as an apparent roughness will be introduced to any surface by inaccuracy in the range measurement of individual scan points. By using measurements on flat reference surfaces and manufacturer-quoted accuracy, it was determined that the laser scanner will give reliable roughness measurements only for discontinuity traces greater than 2 m in length for typical scan ranges of between 50 m and 200 m. Scanner inaccuracy will prevent the reliable measurement of discontinuity roughness for shorter traces where the height of the surface irregularities is less pronounced.
Utilization of software features
A brief summary of how the terrestrial laser scanner system is used at Sishen mine has been given in the preceding section. It is, however, worth mentioning some of the other software features of this particular system that have been developed to aid in face mapping. These can be summarized as follows.
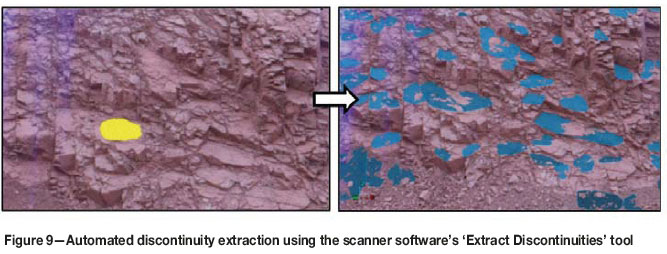
► 'Extract Discontinuities' is a tool that searches a mapping face for flat surfaces within a threshold dip and dip direction of a reference plane selected by the user (Figure 9). Although useful in speeding up the mapping process when well-defined joint sets are present, the tool does have drawbacks that need to be taken into account if it is to be used. Firstly, there is potential to introduce a bias towards user-selected orientations. Secondly, the software can at times be fooled into selecting loose material or partially obstructed portions of the face as discontinuity surfaces. Although useful if applied correctly, care must be taken by the user to ensure an accurate representation of the mapping face is captured. At Sishen, the approach was taken to manually map fewer planes, relying on human interpretation of the prevailing structural orientations, as opposed to relying on an automated function.
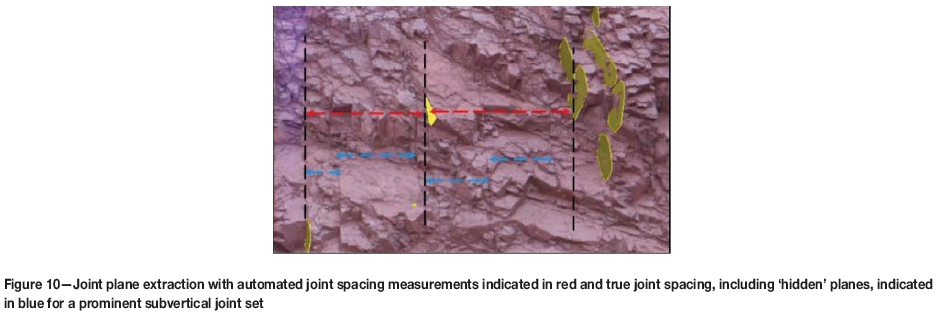
► Newer versions of the scanner software have a built-in joint spacing measurement function that uses extracted discontinuities to determine joint spacing. The function measures the perpendicular distance between sub-parallel joint planes that have been measured on a mapping face. This tool was found to be of limited use for determining joint spacing, as exposed planes on a mapping face seldom represent all the discontinuities of a particular set, as illustrated in Figure 10. Taking direct measurements between discontinuities using the software's CAD functionality (Figure 7) was found to be a more accurate and reliable means of determining discontinuity spacing.
► The software has a built-in function to evaluate and quantify the roughness of an exposed discontinuity surface. The function requires the user to select an input area of points representing the exposed plane, which is then analysed by the software to determine the degree of waviness of the plane. The user sets input parameters allowing the software to divide the surface of interest into cells for analysis, determine the analysis section orientation, and set the minimum number of analysis points. A report is then generated with a histogram showing the variation in dip across the analysis plane and section lines through the plane. At Sishen, the method outlined in the previous section was preferred over this built-in tool as it provided a repeatable method for producing JRC values, an output that can be easily applied when estimating joint strength during design analysis.
► Built-in stereonet functionality allows the user to plot orientation data and carry out kinematic analysis.
Data mangement procedure
In order for laser scanner face mapping to be a useful source of geotechnical data for geotechnical design, analysis, and risk assessment processes, the following is required.
► A standardized face mapping procedure whereby all required mapping parameters are captured
► A data management system that allows for efficient storage, access, querying, and reporting of face mapping data.
Figure 11 illustrates the data management storage system that was developed at Sishen to handle geotechnical face mapping data from the routine mapping exercises carried out during pit deployment. The system integrates the scanner software, Microsoft Excel, and the Acquire geological database system.
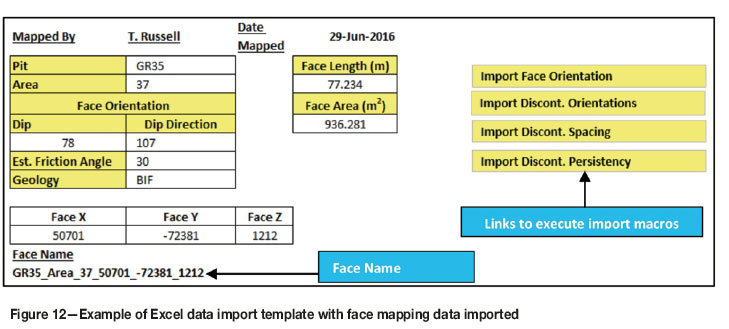
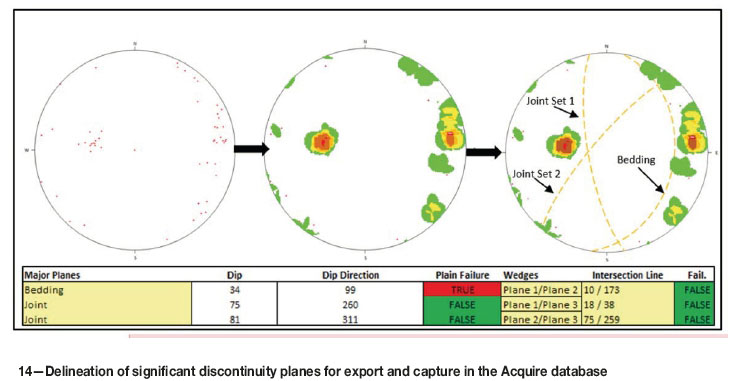
The scanner software has functionality that allows for the export of the various individual parameters in text or CSV format. For data management at Sishen, an Excel template (Figures 12 and 13) was set up to carry out kinematic analysis, delineation of predominant discontinuities (Figure 14), and rock mass rating (Figure 15) before importing the relevant data into the mine's Acquire geotechnical database.
Data storage and analysis
An effective geotechnical database requires the data to be organized in such a manner that it can be accessed and queried to produce relevant and meaningful information to aid in the design process.
The following generic relational data model was applied to fit into the Acquire data model, used to accommodate Sishen's geotechnical face mapping data. The schematic table layout in Figure 16 was found to represent a simple and robust method of storing mapping data. The Face Mapping Collar table is a parent table containing information pertaining to each mapping face as a whole. This is related to the Face Mapping Detail table through the Face ID field, which represents the primary key. Other relevant fields can either be added to the Face Mapping Collar table if a single record is applicable to the face as a whole, or to the Face Mapping Detail table if several values (e.g. Schmidt hammer test results) are to be added.
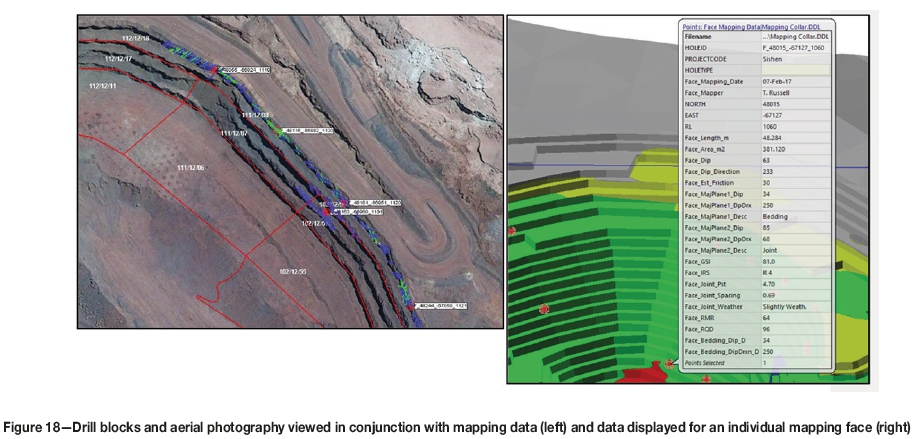
Once captured in the Acquire database, mapping data can be accessed by any third-party software package capable of connecting through an open database connectivity (ODBC) link with the database. At Sishen, the Micromine 3D modelling software package has been adopted for the purpose of analysing designs and incorporating spatial geotechnical data into the design and analysis process. ODCB links with the Acquire database allow borehole data, televiewer data from downhole surveys, and face mapping data to be plotted, with plots updating as data is added to the database. This geotechnical information can then be viewed in conjunction with relevant pit designs, structural models, mine planning data, and survey data (Figures 17 and 18). By integrating information from the mine's geotechnical database with various other sources of spatial data, the following can be carried out within the framework of the geotechnical design and risk assessment process.
► Planning for borehole drilling and face mapping programmes
► Geotechnical design sector delineation
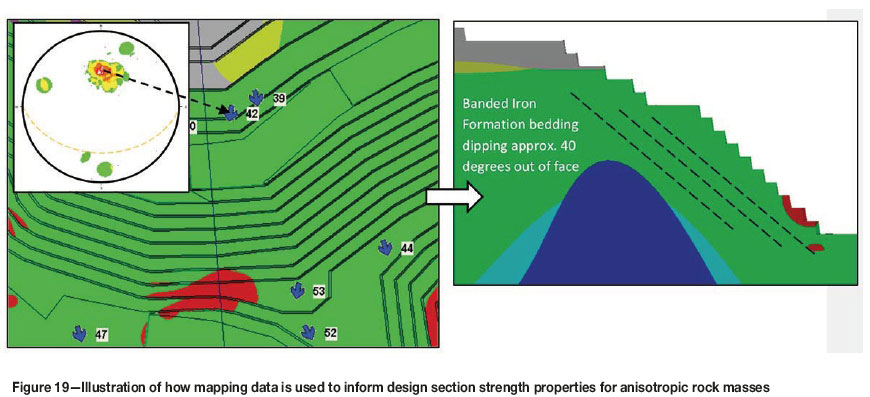
► Allocating structural orientations to specific geotechnical design analysis sections (Figure 19)
► Geotechnical hazard identification and production of geotechnical hazard maps
► Informing blast designs based on structural data. Access to the Acquire database through a Microsoft Excel ODBC link allows data to be queried based on various parameters, and statistical analysis to be carried out. Rock mass parameters from either face mapping or borehole logging data-sets can be queried with the required lithological and spatial constraints applied. This feeds into the geotechnical design process by providing up-to-date rock mass parameters. An illustration of an Excel mapping report sheet linking to the Acquire database is given in Figure 20.
Conclusion
It is clear from the available literature, and experience gained during usage on Sishen Iron Ore Mine, that the terrestrial laser scanner represents a far more practical, faster, and safer means of collecting face mapping data than manual techniques or using a stereo photo system such as Sirovision. No contact with the mapping face is required, which makes the system safer and allows for inaccessible rock faces to be mapped. The photographic overlay of the 3D mapping face automatically incorporated into the scanner software was found to be accurate and an excellent means of interpreting structural and rock mass features on the underlying scan surface. It was, however, evident that the remote data produced by the scanner was not always adequate on its own as a source of geotechnical information, and some form of ground-truthing of rock mass conditions at the mapping face should be incorporated into a face mapping programme.
Face mapping data has proven invaluable in supplementing Sishen's borehole database as a source of information within various stages of the geotechnical design process. In the anisotropic lithologies that are prevalent at Sishen, confidence in bedding orientation relative to design slopes is critical for the evaluation of slope designs. Face mapping on the mine has been crucial in verifying the mine's structural model and will continue to add value as more pit boundaries are exposed and more faces are mapped.
In general the terrestrial laser scanner system in use at Sishen has proved to be an invaluable tool for geotechnical data capture, geotechnical hazard assessment, and structural mapping. The scanner facilitates collection of a large amount of geotechnical information that would otherwise not be obtained, and in a much shorter time than could be achieved by fieldwork. It also facilitates rapid collection of data in situations in which surface support such as wire mesh or shotcrete is to be applied to the rock face soon after excavation. The additional data available as a result of the laser scanning will enhance the quality of designs and hence reduce risk. It is therefore a tool of strategic importance.
References
Barton, N.R. 1982. Shear strength investigations for surface mining. Proceedings of the Third International Conference on Surface Mining, Vancouver, Canada. Society of Mining Engineers of AIME, New York. pp. 171-196. [ Links ]
Feng, Q. 2001 Novel methods for 3-D semi-automatic mapping of fracture geometry at exposed rock faces. PhD thesis, Division of Engineering Geology, Royal Institute of Technology (KTH), Stockholm, Sweden. 64 pp. [ Links ]
Feng, Q. and Röshoff, K. 2006. Semi-automatic mapping of discontinuity orientation at rock exposure by using 3D laser scanning techniques. Proceedings of the 10th Congress of the International Association/or Engineering Geology and the Environment (IAEG 2006) .The Geological Society, London. Paper no. 751. 5 pp. [ Links ]
Google Earth. 2017. Image ©2017 CNES/Airbus. [ Links ]
Kumba Iron Ore. 2015. Annual Report 2015. [ Links ]
Maptek. 2013. I-Site Studio training manual, version 4.2. Sishen Iron Ore Mine internal Maptek training course. [ Links ]
McQuillan, A. 2013. Comparison of photogrammetry and survey laser scanning output data for use in mapping joints in open cut highwalls. Proceedings of the 13th Coal Operators' Conference, University of Wollongong. Australasian Institute of Mining and Metallurgy and Mine Managers Association of Australia,. pp. 347-354. [ Links ]
Mortimer, B. 1995. Report on structural geological analysis - Sishen. Internal Report, Sishen Iron Ore Mine. 71 pp. [ Links ]
Read, J. and Stacey, P. (eds). 2009. Guidelines for Open Pit Slope Design. CSIRO Publishing, Collingwood, Victoria. 496 pp. [ Links ]
Slob, S. and Hack, H.R.G.K. 2007. Fracture mapping using 3D laser scanning techniques. Proceedings of the 11th International Congress of the International Society for Rock Mechanics, Lisbon, Portugal. pp. 299-02. [ Links ]
Paper received Dec. 2017
Revised paper received Apr. 2018

