


Services on Demand
Article
 English (pdf)
 Article in xml format
 Article references
Indicators

Related links
-
 Cited by Google
 -
 Similars in Google
Share

 Permalink
Journal of the Southern African Institute of Mining and Metallurgy
On-line version ISSN 2411-9717
Print version ISSN 2225-6253
J. S. Afr. Inst. Min. Metall. vol.118 n.11 Johannesburg Nov. 2018
http://dx.doi.org/10.17159/2411-9717/2018//v118n11a3
COPPER COBALT AFRICA
Copper electrowinning circuit design: optimized costing as a function of cell arrangement, productivity, rectiformer size, and throughput
E.L. FornerI; J. ScheepersI; A.J. du ToitI; G.M. MillerII
IDRA Projects, South Africa
IIMiller Metallurgical International (MMI), Australia
SYNOPSIS
The sizing, designing, and costing of copper electrowinning circuits requires an in-depth understanding of the fundamental relationships between circuit parameters and the practical operation requirements. The aim of this investigation was to optimize total copper electrowinning project cost by mapping the operating limits of key mechanical equipment. The model was compiled by mapping various cellhouse layouts in terms of number of cathodes per cell, crane productivity, stripping machine productivity, and rectifier-transformer (rectiformer) sizing using data tables for sensitivity analysis. These parameters were then collated and evaluated on a cost by size basis. The model provides an optimum band of operation for cellhouse productivity and project capital cost for a typical range of production throughputs, from 10 kt/a to 200 kt/a cathode copper. The information may be used as a high-level selection guide to assist with identifying a cost-effective copper electrowinning circuit design for a specific production rate. The data was validated and compared with existing copper electrowinning cellhouses around the world that typically install no more than 84 cathodes per cell.
Keywords: copper electrowinning, circuit design, production rate, cost optimization.
Introduction
The sizing, designing, and costing of copper electrowinning (EW) circuits require an in-depth understanding of the fundamental parameters as well as the practical requirements to optimize cellhouse productivity and capital cost. Although a significant amount of work has been done designing new copper electrowinning circuits, an in-depth evaluation of world operating data reveals that the number of cathodes per cell, which affects cellhouse layout and productivity, is not consistent for a specific production rate (Anderson et al., 2009; Robinson et al, 2003, 2013). Based on this premise, Kafumbila (2017) suggested that there are unanswered questions, such as 'why are the numbers of cathodes per cell different for copper production rates of 20 kt/a and 40 kt/a?
In this paper, data tables are employed to map the operating limits and costs of key Cu EW equipment. An overall Cu EW project cost map is then compiled by collating optimum cellhouse layout (number of cathodes per cell), optimum crane productivity, optimum stripping machine productivity, and associated costs. Fundamentally, Excel data tables allow one to perform sensitivity analysis by exploring many scenarios within a specific formula/model, for up to two variables. The variables evaluated for Cu EW include:
1. Production tonnage
2. Number of cathodes per cell.
Major costed mechanical equipment included the following items:
► Anodes and cathodes
► Cathode washing, stripping, and handling system
► Polymer concrete cells
► Rectifiers and transformers (including shorting frame, trunk, and apron busbar system)
► Cellhouse overhead cranes.
Copper electrowinning design and sizing
Basis ofcircuit design
Faraday's Law is applied as the basis for sizing each Cu EW circuit for a specific production rate (Equation [1]).
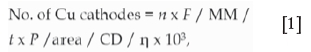
where n is the number of transferred electrons. F is Faraday's constant (C/gmol). MM is the molecular mass of Cu (g/mol). t is time (s); P is production rate (kg h/Cu). area is plating area (m2). CD is current density (A/m2). and n is the current efficiency (%).
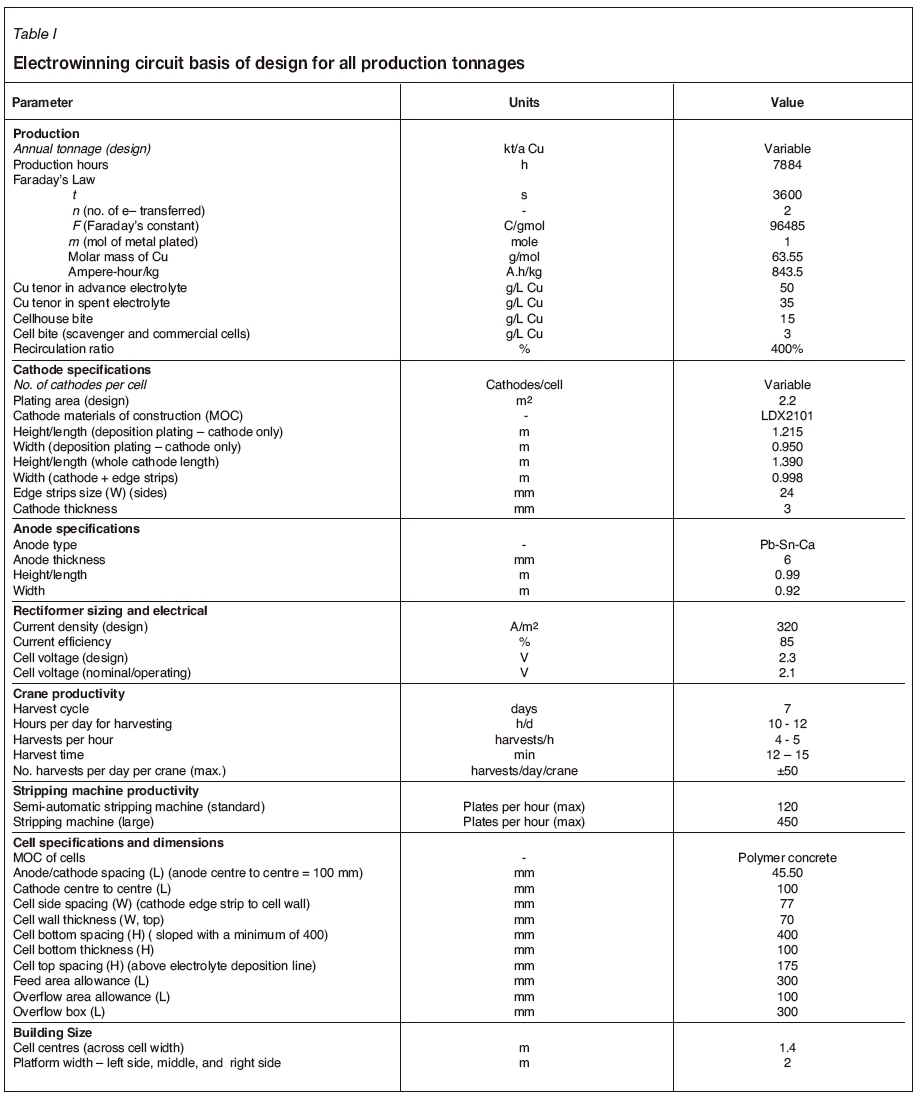
The technical design parameters are specified in Table I. Once the number of cathodes per cell is specified then other parameters like the number of anodes, rectifier amperage, number of cells, and transformer voltage can be determined. Each piece of major EW equipment is discussed in the sub-sections to follow, regarding optimization of productivity and cost
Crane productivity
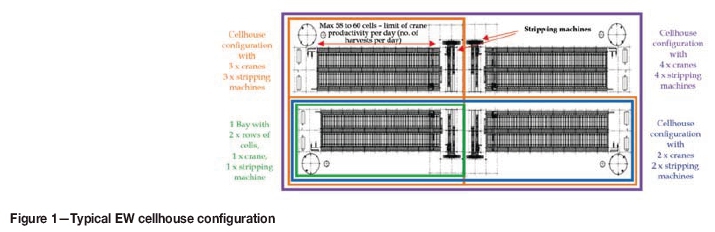
Typical configurations of key Cu EW cellhouse equipment are presented in Figure 1. The primary parameters used in determining the crane productivity are the harvest cycle and harvest time (crane travel time). For the purposes of this paper, it is assumed that all cathodes in the cellhouse are harvested over a period of 7 days with every third cathode being harvested per cell. Typically, about 50 harvests per crane per day are possible if it is assumed that there are roughly five harvests per hour and a 10-hour harvesting time per day.
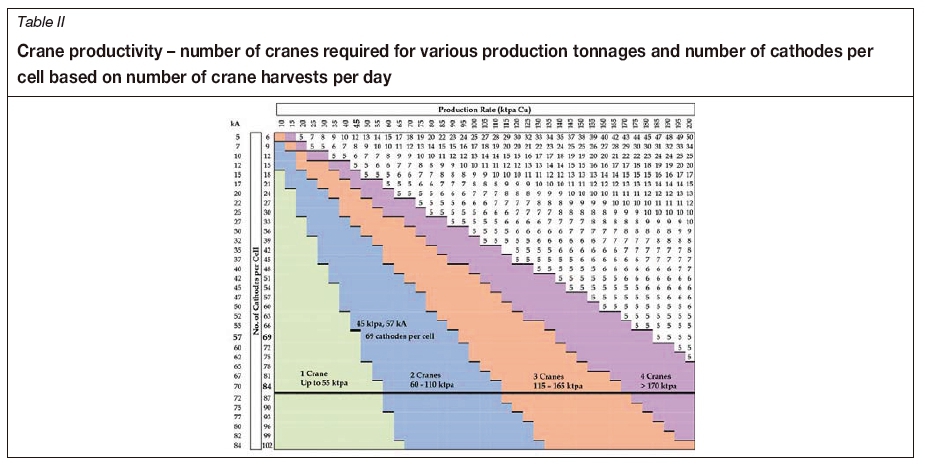
The crane productivity is shown in Table II. World operating data shows that Cu EW cellhouses do not typically have more than 84 cathodes per cell (depicted by the bold black line across all throughputs in Table II) (Robinson et al., 2013). Black horizontal bars denote the limit for crane utilization in terms of number of cathodes per cell for each throughput. Once the crane productivity limit is determined, it follows that the limits of four main parameters in the EW cellhouse design are specified, namely:
1. Maximum building length (maximum number of cells per row): 60 cells per row in the cellhouse (120 total cells) is the absolute maximum limit set by crane productivity. Total voltage is calculated from the total number of cells and cell potential.
2. Minimum number of cranes required for cathode harvesting for a specific production rate (assuming that most cellhouses install less than 84 cathodes per cell):
► It is possible to harvest cathodes for production rates less than 55 kt/a Cu with only one crane
► 60 kt/a Cu to 110 kt/a Cu requires two cranes
► 115 kt/a Cu to 165 kt/a Cu requires three cranes
► Greater than 170 kt/a Cu requires at least four cranes.
3. Minimum number of cathodes per cell: By limiting the number of cells to a maximum of 60 per row, the minimum number of cathodes per cell is limited for each production tonnage. 4. Minimum rectifier amperage possible in operation: Because the rectifier amperage is determined by number of cathodes per cell and Faraday's Law, the minimum possible operating rectifier amperage is then determined. Rectiformer sizing for all the production tonnages aims to minimize rectifier amperage, which then minimizes cost (number of cathodes per cell, which gives approximately 116 cells per bay, i.e., two rows of approximately 58 cells).
Referring to points 1 to 4 and the bold black horizontal bar in Table II, for a throughput of 45 kt/a it is possible to harvest the required number of cathodes using one crane if there are 69 cathodes per cell or more. This results in a minimum rectifier amperage of 57 kA. Theoretically, it would be possible to harvest up to 65 kt/a with only one crane with 102, or more, cathodes per cell.
Other cellhouse arrangement considerations include the following (Miller, 2018):
► One cannot have more than one crane operating in a single bay due to the risk of collision
► One can, however, have two cranes operating in two separate bays feeding the same stripping machine but at the cost of anti-collision instrumentation and controls
► The biggest improvement to crane productivity is obtained by using auto-positioning for both lift and replacement activities: laser sight on cell and cathode positions, and the use of positive alignment systems like Rhino Horn anode insulators.
Cathode stripping machine productivity
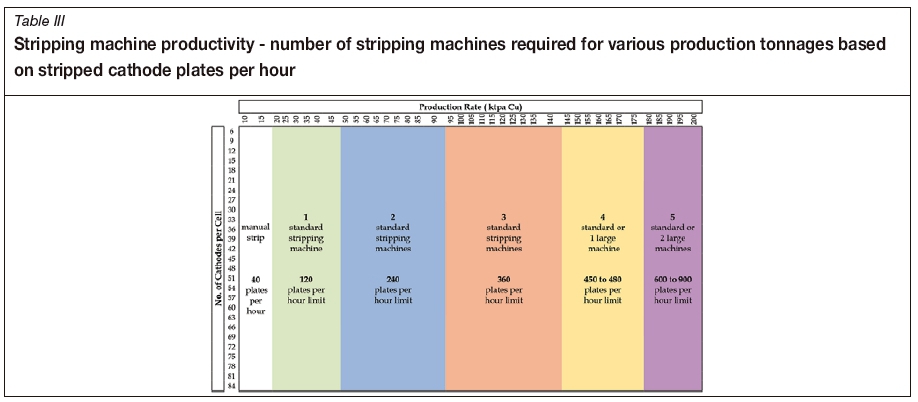
The cathode stripping machine productivity is represented in Table III and determines the number and size of stripping machines required for each production rate.
Table III shows that the number of cathode plates stripped is independent of number of cathodes per cell and is only dependent on production rate (total number of cathodes). A 'standard' stripping machine can accommodate an absolute maximum of 120 plates per hour, while one 'large' stripping machine can strip an absolute maximum of 450 plates per hour. It is assumed that, for production rates less than 15 to 18 kt/a Cu, cathode handling and washing is performed by a machine while stripping is performed manually (Garbutt, 2018).
Rectiformers
Rectiformers (rectifier-transformer pairs) are sized based on the nominal production tonnage at design current densities of 320 A/m2. No extra margin is included in the production tonnage. The design margin is accounted for in the rectifier amperage capability to operate at higher current density (Miller, 2018). Depending on rectiformer supply and sizing, the cell design can be modified to suit. In terms of the electrical arrangement, it is not recommended to have, for example, one rectiformer with two operating cranes. The electrical circuits need to be partitioned accordingly.
Building utilization
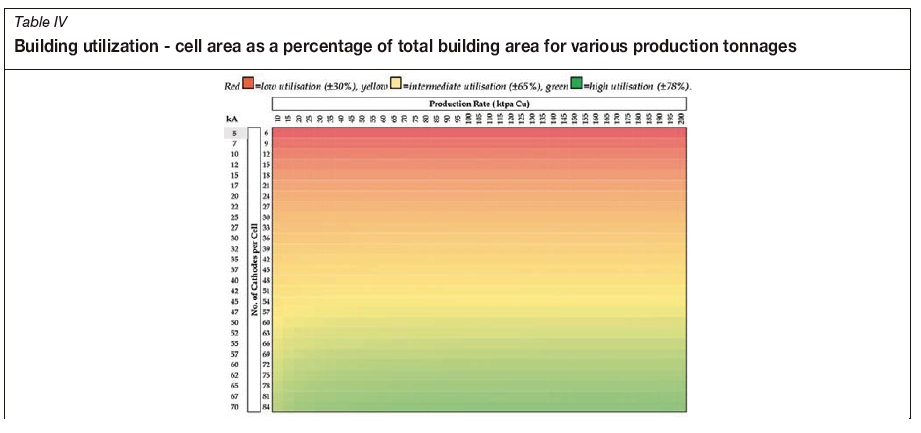
Another variable to consider is the relative cost of the building to house the cells. Building utilization is shown in Table IV. Each column is formatted per column (per production rate).
► Building utilization (%) = Cell area/Total area
► Total area = Cell area + Platform area:
- Cell area: The cell area is determined by multiplying the number of cells by cell centre-to-centre width.
- Platform area: A minimum walkway of 2 m either side of the two rows of cells and down the middle is required to prevent a dropped electrode shorting between the building steel and the last anode in the cell, or across the centre aisle from first anode to last anode.
Referring to Table IV, it is clear that building utilization is relatively constant across different production tonnages but increases percentage-wise as the number of cathodes per cell increases. The rectifier amperage is constant for a specific number of cathodes per cell and increases proportionally with increasing number of cathodes per cell.
Financial evaluation
Analysis was conducted on a bare-bones basis, in real terms, and excludes the effects of taxes, interest, or financing terms. The costs should be regarded as budget values with ±30% estimation accuracy.
Modelled cost parameters
► Overhead cranes-The cost of one crane was multiplied by the number of cranes required for each production rate, determined from Table II.
► Stripping machines-The cost of one standard/large stripping machine was multiplied by the number of stripping machines required for each production rate, determined from Table III. The minimum cost was taken when there was an option of multiple 'standard' stripping machines or fewer 'large' stripping machines. It was assumed that cathodes are stripped manually for productions rates less than 15 kt/a Cu; however, there is still an associated cost applied for cathode handling and washing.
► Rectiformers-Each rectiformer and busbar system was costed from budget quotations from ABB (Oberholzer, 2018). The range costed included: 20 kA, 30 kA, 40 kA, and 60 kA. One rectifier and two transformers (12-pulse configuration) totalling 250 V can cater for 116 to 120 cells per bay.
► Building utilization-Theoretically, the building cost increases with a longer narrower building having a lower percentage of the floor space used for cell placement. Initially, the intention was to adjust the capital cost (CAPEX) estimate with a cost per area of EW floor space (US dollars per m2). This would allow for increased cost as the number of cathodes per cell decreased; however, when the final Cu EW project costs were examined, it was found that the building utilization cost contributed less than 1% of the total CAPEX estimate. Consequently, building utilization was not included as a variable in the overall EW project cost but rather factored in the same manner as structural steel, platework, etc.
Capital costing and assumptions
The following assumptions were made in compiling the total copper EW cost.
► The CAPEX estimates were based on the use of typical EW design parameters for compiling calculations, which were then used to size major equipment. Major mechanical equipment included anodes and cathodes, cathode washing and stripping system (including ancillaries), EW polymer concrete cells, rectifiers and transformers (including shorting frame, trunk, and apron busbar system), and cellhouse overhead cranes.
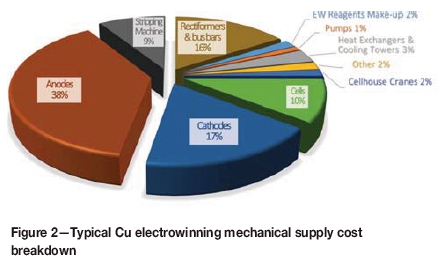
► A breakdown of the cost contribution of each piece of major equipment is provided in Figure 2. Anodes, cathodes, and rectiformers are the largest cost contributors to the total mechanical supply cost. It has been seen from recent studies that anode cost can contribute as much as 50% to mechanical supply cost, depending on the lead price at the time.
► Mechanical equipment cost and rectiformer costs were determined from recent studies, DRA's internal database, and selected vendor quotes (Garbutt, 2018; Oberholzer, 2018).
► Internal DRA factors were applied to the mechanical supply costs (including rectiformers) for civils, structural (supply and erection), platework (supply and erection), mechanical erection, piping (supply and installation), electrical, control and instrumentation (supply and installation), transport, project services, and preliminary and general costs. Owners' costs were excluded.
Sensitivity analysis
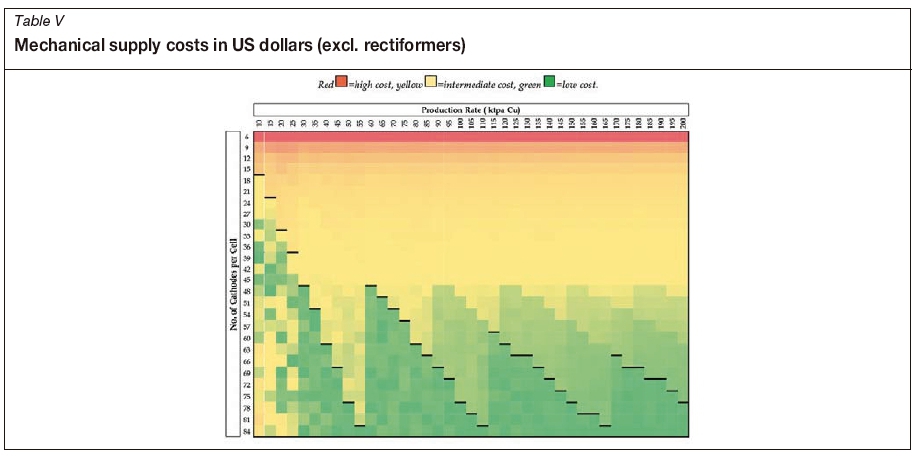
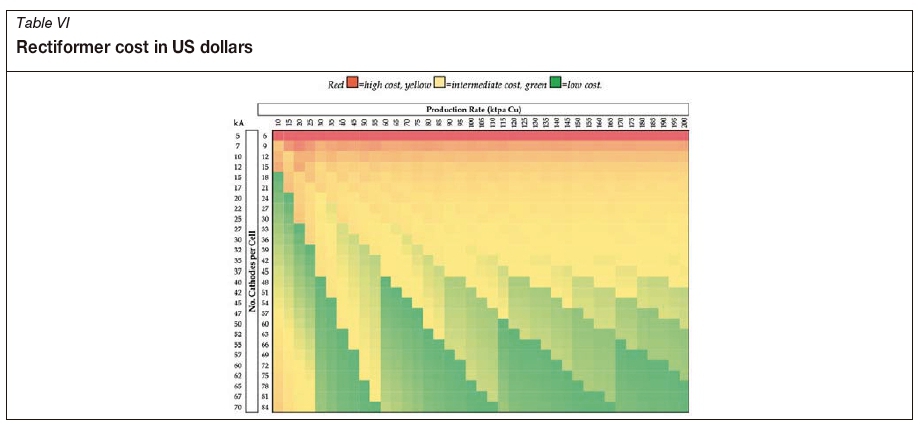
Sensitivity analysis was performed using the data tables to map ranges of costs based on two main variables: namely, production tonnage and number of cathodes per cell. Mechanical supply costs, excluding rectiformer cost estimates, are summarized in Table V. Rectiformer costs are shown in Table VI.
All data tables in this section are formatted per column (per production rate). This means that 'low costs' for two different production rates are not necessarily the same, i.e., the formatting shows a relative low/intermediate/high cost for a specific column (production rate) and should not be compared with another column. Black horizontal bars depict the limit of crane productivity, in terms of number of cathodes per cell, for a specific production rate.
A number of observations can be made from the data in Tables V and VI.
Mechanical supply costs (excluding rectiformer costs)
► Table V shows that as the number of cathodes per cell increases, the mechanical supply cost decreases. The 'low cost' range starts at: US$4.2 million for 10 kt/a Cu; US$14 million for 45 kt/a Cu; US$35 million for 110 kt/a Cu; US$50 million for 165 kt/a Cu; and US63 million for 200 kt/a Cu.
► Because the total number of cathodes and anodes required remains constant for a specific production rate, regardless of number of cathodes per cell, higher production rates (total number of cathodes) become more economical due to the base cost of the cell mould. The stripping machine and overhead cranes costs also become more economical when these pieces of equipment operate at high utilization.
Rectiformer costs
Table VI shows that rectiformer cost increases with the number of cathodes per cell and number of rectiformers required per cellhouse. This can be attributed to the directly proportional relationship between number of cathodes per cell and rectifier amperage. The 'low cost' range starts at: US$1.5 million for 10 kt/a Cu; US$2.4 million for 45 kt/a Cu; US$5.8 million for 110 kt/a Cu; US$9.5 million for 165 kt/a Cu; and US$13.3 million for 200 kt/a Cu.
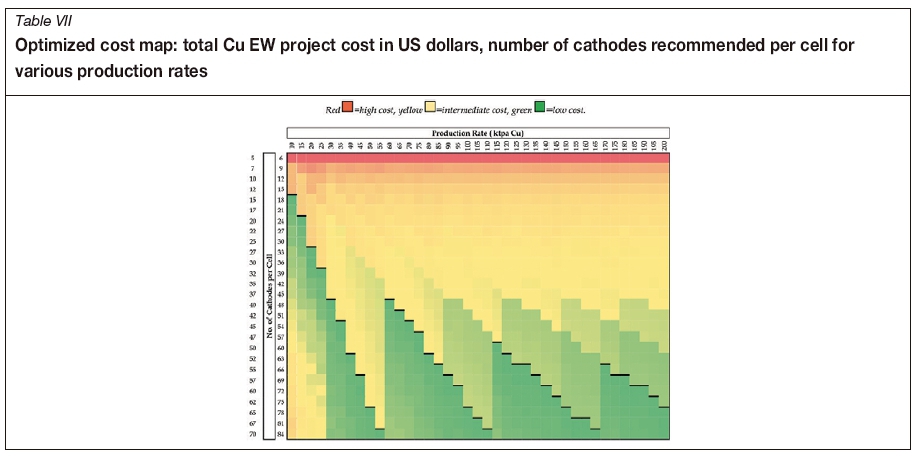
Table VII shows a combination of mechanical supply cost and rectiformer cost factored for total Cu EW project cost. The bold black lines indicate the limit of crane productivity (approximately 116 to 120 cells). Costs range from US$18.8 million for 10 kt/a to US$249 million for 200 kt/a in the low-cost ranges.
Figure 3 represents the economy of scale achieved at higher production rates within a specific band of throughputs. The absolute minimum cost per ton of copper across all columns (production rate of 165 kt/a Cu) was determined and then subtracted from the minimum cost per ton of copper for each column. The percentage increase above 165 kt/a was then graphed.
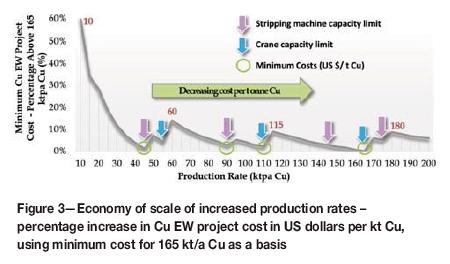
Economy of scale is reduced at the beginning of a band, for example, the highest cost peaks are seen at production tonnages of 10, 60, 115, and 180 kt/a Cu. These peaks result from the jump from n number of cranes to n+1 number of cranes, as the utilization/productivity limit is reached and production rate increases. Intermediate cost peaks are seen at production tonnages of 20, 50, 95, 145, and 170 kt/a Cu as stripping machine capacity is reached. Because the stripping machine cost contributes a larger proportion to mechanical supply than crane cost, minimum costs are seen before the jump from n stripping machines to n+1 stripping machines.
A production tonnage of 165 kt/a copper has the best economy of scale because one 'large' stripping machine is more cost-effective than four 'standard' stripping machines.
In a scenario where a large production capacity is required, for example 180 kt/a, and capital is limited in the beginning of a project, the cost map suggests that the best project cost would be achieved if modules/cellhouses of 45 kt/a are added progressively.
Model validation against existing data
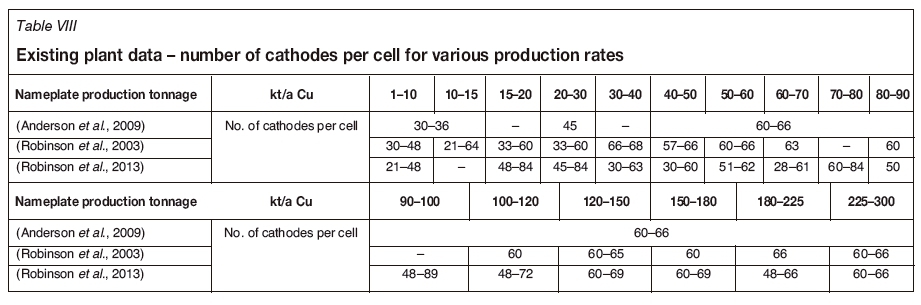
The world operating data for Cu EW is summarized in Table VIII (Anderson et al., 2009; Robinson et al., 2003, 2013). Ranges of number of cathodes per cell are listed for each nameplate production rate.
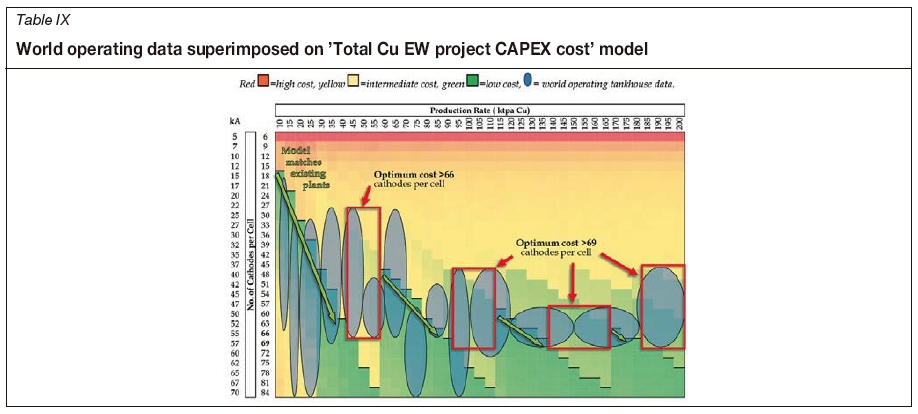
Table IX shows the number of cathodes per cell for optimum productivity and lowest total EW project cost with the world operating data superimposed (indicated by blue circles). Theoretical evaluation shows lower cost potentials for higher throughputs before including another cellhouse set.
It can be noted from Table IX that existing Cu EW installations often fall within the recommended ranges for number of cathodes per cell; however, they are not always at the optimum value for cellhouse productivity and lowest Cu EW project cost.
Green arrows indicate areas where the model matches existing world operating data. Throughputs of 45 to 55 kt/a Cu are particularly interesting because the world operating data shows that these plants were designed to operate with 30 to 66 cathodes per cell. On the contrary, the cost map suggests that the project capital costs could have been minimized by increasing the number of cathodes per cell to 66 or more. In the same manner, lower project costs could have resulted from installing more than 69 cathodes per cell for production rates of 90 to 110 kt/a Cu, 140 to 165 kt/a Cu, and 185 to 200 kt/a Cu.
Conclusions and recommendations
The aim of this paper was to optimize total Cu EW project cost by mapping productivity and arrangement of major Cu EW cellhouse equipment. A number of findings emerged.
► 58 to 60 cells per row of cells is the absolute maximum limit of crane productivity with each cellhouse bay having two rows of cells.
► One crane can be utilized for production tonnages up to 55 kt/a, assuming a minimum of 84 cathodes per cell (typical of world operating data).
► A 'standard' stripping machine can accommodate an absolute maximum of 120 plates per hour.
► Anodes contribute the highest proportion to Cu EW mechanical equipment cost.
► EW cellhouse floor area utilization is insignificant in terms of total project cost, although further work is recommended for projects in cold climates.
► Economy of scale is evident in dollars per ton Cu as production rate increases.
► A production tonnage of 165 kt/a copper has the best economy of scale, in terms of total project cost, for the range 10 to 200 kt/a Cu.
► Large nameplate production rates would achieve the lowest project capital cost when built in 45 kt/a Cu modules, should capital be constrained. Data tables were used as a sensitivity analysis tool to determine the optimum Cu EW cellhouse arrangement and cost, by changing the variables: number of cathodes per cell and Cu cathode production rate. The optimum number of cathodes per cell, in terms of total project cost, for each production rate was determined and validated against existing world operating tankhouse data.
Acknowledgements
Our thanks to ABB and Glencore Technology: to ABB for their comprehensive rectiformer costing, and to Glencore Technology for stripping machine costing.
References
Anderson, C.G., Giralico, M.A., Post, T.A., Robinson, T.G., and Tinkler, O.S. 2009. An update: selection equipment sizing and flowsheet applications in copper solvent extraction. Recent Advances in Mineral Processing Plant Design. Malholtra, D., Taylor, P., Spiller, E., and LeVier, M. (eds). Society of Mining Engineers, Littleton, CO. [ Links ]
Garbutt, P.J. 2018. Budget quote for 120 plate per hour, 450 plate per hour cathode stripping systems and cathodes. Africa Co-ordinator, Glencore Technology, Brisbane, Australia. [ Links ]
Kafumbila, J. 2017. Design of copper electrowinning circuit using conventional cells https://www.911metallurgist.com/blog/wwp-content/uploads/2015/11/Design-Copper-Electrowinning-Circuit.pdf [accessed 25 January 2018]. [ Links ]
Oberholzer, K. 2018. Budget estimates for rectifier-transformer pairs for various copper electrowinning production tonnages. Business Development Manager - Rectifiers, ABB, Modderfontein, South Africa. [ Links ]
Robinson, T., Davenport, W.G., Jenkins, J., King, M., and Rasmussen, S. 2003. Electrolytic copper electrowinning - 2003 world tankhouse operating data. Global Cu EW Survey spreadsheet. Proceedings of Copper2003: Vol. V, Copper Electrorefining and Electrowinning. Dutriza, J.E. and Clements, C.G. (eds). Canadian Institute of Mining, Metallurgy and Petroleum, Montreal. pp. 3-66. [ Links ]
Robinson, T.G., Sole, K.C., Sandoval, S., Moats, M.S., Siegmund, A., and Davenport, W.G. 2013. Copper electrowinning - 2013 world tankhouse operating data. Global Cu EW survey spreadsheet. Proceedings of Copper- Cobre Conference 2013: Vol. 1. Gecamin, Santiago, Chile. pp. 3-14. [ Links ]

