


Services on Demand
Article
 English (pdf)
 Article in xml format
 Article references
Indicators

Related links
-
 Cited by Google
 -
 Similars in Google
Share

 Permalink
Journal of the Southern African Institute of Mining and Metallurgy
On-line version ISSN 2411-9717
Print version ISSN 2225-6253
J. S. Afr. Inst. Min. Metall. vol.118 n.10 Johannesburg Oct. 2018
http://dx.doi.org/10.17159/2411-9717/2018/v118n10a8
Graphical analysis of underground coal gasification: Application of a carbon-hydrogen-oxygen (CHO) diagram
S. Kauchali
School of Chemical & Metallurgical Engineering, University of the Witwatersrand, South Africa
ABSTRACT
Underground coal gasification (UCG) is recognized as an efficient mining technique capable of chemically converting the coal from deep coal seams into synthesis gas. Depending on the main constituents of the synthesis gas, chemicals, electricity, or heat can be produced at the surface. This paper provides a high-level graphical method to assist practitioners in developing preliminary gasification processes and experimental programmes prior to detailed designs or field trials. The graphical method identifies theoretical limits of operation for sensible gasification within a thermally balanced region, based primarily on the basic coal chemistry. The analyses of the theoretical outputs are compared to actual field trials from sites in the USA and Australia, with very favourable results. A South African coal is studied to determine the possible synthesis gas outputs achievable using various UCG techniques: controlled retractable injection point (CRIP) and linked vertical wells (LVW). For CRIP techniques, an important result suggests that pyrolysis, and subsequent char production, are important intermediate phenomena allowing for increased thermal efficiencies of UCG. The conclusion is that South African coals need to be studied for pyrolysis-char behaviour as part of any future UCG programme. The results also suggest that UCG with CRIP would be a preferred technology choice for Bosjesspruit coal where pyrolysis dynamics are important. Lastly, the use of CO2 as oxidant in the gasification process is shown to produce syngas with significant higher heating value.
Keywords: Underground coal gasification, pyrolysis, char, thermal balance.
Introduction and literature survey
Coal is a commonly utilized fossil fuel, providing over 40% of global electricity demand and about 90% of South Africa's primary energy needs. However, less than 20% of the known world resources are suitable for possible extraction using conventional surface and underground mining techniques (Andrianopolous,, Korre, and Durucan, 2015). Underground coal gasification (UCG) has the potential to recover the energy stored in coal in an environmentally responsible manner by exploiting seams that are deemed unmineable by traditional methods. The UCG process, if successfully developed, can increase coal reserves substantially. For example, in the Limpopo region of South Africa alone, the estimated potential for UCG gas, based on existing geological records, is over 400 trillion cubic feet (TCF) natural gas equivalent - this is about a hundred times more gas than the existing 4-TCF Pande-Temane natural gas field reserve in Mozambique (de Pontes, Mocumbi, and Sangweni, 2014).
Sasol has been producing synthesis gas from surface gasifiers for over 60 years using South African bituminous coal that is mined using traditional methods (van Dyk, Keyser, and Coertzen, 2006). The authors acknowledge that South Africa will, for many years, rely on its abundant coal resources for energy, with gasification technology playing an enabling role.
The gasification propensity of low-grade South African coal was studied by Engelbrecht et al. (2010) in a surface fluidized bed reactor. The coal samples from New Vaal, Matla, Grootegeluk, and Duvha coal mines were high in ash (up to 45%), rich in inertinite (up to 80%), had a high volatile matter content (20%) and low porosity. The study established that these low-grade South African coals were able to gasify to produce syngas for downstream processes.
UCG is a thermo-chemical process which converts coal into a gas with significant heating value. The process requires the reaction of coal in air/oxygen (and possibly with the addition of steam and carbon dioxide) within the underground seam to produce synthesis gas (syngas). The primary components of syngas are the permanent gases hydrogen, carbon monoxide, carbon dioxide, and methane along with tars, hydrogen sulphide, and carbonyl sulphide. The ash is deliberately left below the ground within the cavity. A typical gasification cavity is carefully controlled to operate just below the hydrostatic pressure to ensure ingress of subsurface water into the cavity and the retention of products within the gasification system. The nature of UCG processes are such that a limited number of parameters can be either controlled or measured. Furthermore, UCG processes require multidisciplinary integration of knowledge from geology, hydrogeology. and the fundamental understanding of the gasification process.
Recent review articles by Perkins (2018a, 2018b) provide an excellent basis for UCG practitioners. Perkins (2018a) covered the various methods of UCG as well as the performance of the methods at actual field sites worldwide. Of particular interest are the descriptions for drilling orientations, linking, and operational methods utilized for UCG: linked vertical wells (LVW), controlled retractable injection point (CRIP), and the associated variations. The factors affecting the performance of various UCG trials were studied as well as an assessment of economic and environmental issues around UCG projects. Guidelines are provided for site and oxidant selection based on field trials from the USA, Europe, Australia, and Canada.
Huang et al. (2012) studied the feasibility of UCG in China using field research, trial studies, and fundamental laboratory work comprising petrography, reactivity, and mechanical tests of roof material. In contrast, Hsu et al. (2014) performed a laboratory-scale gasification simulation of a coal lump and used X-ray tomography to assess the cavity formation. The cavity formation in the experiment was consistent with a teardrop pattern typical in UCG trials. The cavity shape and effect of operating parameters on the UCG cavity during gasification were studied by Jokwar, Sereshki, and Najafi (2018) using commercial COMSOL software.
Andrianopolous, Korre, and Durucan (2015) developed models to represent the chemical processes in UCG. In this study, models previously developed for surface gasifiers were adapted for UCG processes. The molar compositions and syngas production from the models were compared to reported results from a laboratory-scale experiment. A high correlation of the experimental and modelling results was achieved.
Zogala (2014a, 2014b) studied a simplistic coal gasification simulation method based on thermodynamic calculations for the reacting species as well as kinetic and computational fluid dynamics (CFD) models. Mavhengere et al. (2016) developed a modified distributed activation energy model (DAEM) for incorporation into advanced CFD calculations for gasification processes.
Yang et al. (2016) reviewed the practicalities of worldwide UCG projects and research activities over a five-year period. Their studies included developments in computational modelling as well as laboratory and field test results. The techno-economic prospects of combining UCG with carbon capture and storage (CCS) was also discussed.
Klebingat et al. (2018) developed a thermodynamic UCG model to maximize syngas heating values and minimize tar production from early UCG field trials at Centralia-PSC, Hanna-I, and Pricetown. The optimization suggested that tar production in the field trials could be eliminated, with significant improvements to the syngas heating values.
UCG development has been largely concerned with establishing methods to enhance well interconnectivity as well as techniques for drilling horizontal in-seam boreholes. In addition, methods are sought for the ignition of the coal as well as appropriate process control to ensure syngas quality. Site selection criteria have been considered crucial, while the contribution from laboratory work is considered to be limited. This undelines the need for site-specific piloting and testing.
In this study, the focus is restricted to the development of the UCG process based on the inherent chemical nature of coal and the specific reactions required to complete the conversion of solid coal into syngas. A graphical method is presented that allows an engineer with a basic competence in chemistry to develop high-level UCG processes without the need for detailed studies of kinetics, equilibrium, geology, and hydrogeology. The information obtained from such an exercise provides a target for the subsequent, and costly, field trials. The results obtained from the high-level graphical analyses are compared to UCG outputs from the Rocky Mountain (USA) and Chinchilla (Australia) trials. An interesting outcome is that the field trial outputs lie in a predictively narrow region, regardless of the UCG technique used. This is useful when new designs, with different coals, are being planned for UCG. Furthermore, the underground gasification of a South African coal from Bosjesspruit mine is studied to determine the possible regions of operation for producing syngas with the highest heating value suitable for power generation. A key result here shows that the preferred method for applying UCG to the coal from Bosjesspruit mine is the CRIP method, whereby the coal undergoes pyrolysis and char production prior to gasification.
Development of a graphical method for gasification reactions
The representation of gasification reactions on a bond equivalent phase diagram was advocated by Battaerd and Evans (1979). The bond equivalent phase diagram is a ternary representation of carbon, hydrogen, and oxygen (CHO) where species are represented by the bonding capacity of the constituent elements. To obtain the bond equivalent fraction for a species CxHyOz, the contribution by carbon is 4(x), hydrogen is 1(y), and oxygen is 2(z), which is normalized for each species. Thus, CH4 (methane) is represented by the midpoint between C and H. Similarly CO2 (carbon dioxide) and H2O (water) are midway between C-O and H-O respectively. CO (carbon monoxide) is one-third between C-O, as shown in Figure 1. According to Kauchali (2017), the important gasification reactions are obtained by considerations of the intersection of the feed (coal)-oxidant (steam, oxygen, or carbon dioxide) with the following lines: H2-CO, H2-CO2, H2-CO, CH4-CO and CH4-CO2 (Figure 1). These intersections represent the stoichiometric region in which sensible gasification occurs - outside of these regions an excess amount of coal (carbon) or oxidants is evident, implying that they do not react within the gasification system. A further analysis of the intersections indicates the inherent thermal nature of the reactions, some of which are endothermic while others are exothermic. The endothermic and exothermic nature of the important reactions will be further explained in the examples that follow from the various field trials.
In an idealized underground gasification process the system must be overall thermally balanced so that there is no net heat released or added to the cavity. This requirement further limits the region of operation of thermally balanced gasification reactions.
In addition, the following criteria (Wei, 1979; Kauchali, 2017) are used to decide on reactions that will form the overall mass and energy balances:
► Feed components may not appear in the product. For example, any gasification reaction that uses steam/oxygen as oxidant cannot have water as a product.
► The reactions on the CHO diagram represent the maximum region they enclose - mathematically, the intersection points represent the extreme points of a linearly independent reaction system.
► The extreme reactions points, representing overall stoichiometry, will lie on either of the lines H2-CO, H2-CO2, H2-CO, CH4-CO and CH4-CO2.
Methodology and approach for graphical analysis of UCG processes
The graphical representation of the UCG processes is depicted on a ternary CHO diagram. The three different coals (USA, Australia, and South Africa) and the oxidants (steam, oxygen or carbon dioxide) are represented on the diagrams as feed points. From the representation of the feed points and the various intersections with the product lines (H2-CO, H2-CO2, H2-CO, CH4-CO and CH4-CO2), a region of stoichiometrically acceptable gasification products is obtained. This stoichiometric region is a mass balance region indicating the possible combinations of elements (C, H, and O) resulting from the various reaction schemes during gasification. This stoichiometric region thus represents the maximum allowable area and possible products that can be obtained. Once the reactions governing the stoichiometry are obtained, the possible pairing of endothermic-exothermic reactions can be established. This requires the thermodynamic properties (heat of formation) of each species participating in the reaction. The combinations of the reaction pairs (exothermic and endothermic) lead to thermally balanced points where the reactions have a heat of reaction of zero (kJ/mol). This thermally balanced point represents a 'balanced' UCG process and is also plotted on the CHO diagram. Depending on the number of possible exothermic and endothermic stoichiometric reactions, a number of thermally balanced points exist. A study of the thermally balanced reaction points will result in identifying a smaller subset of reactions that will form the basic reactions, i.e. the extreme reactions that will form a boundary around all other thermally balanced reactions. These extreme reactions are referred to as 'linearly independent thermally balanced reactions' and are unique for every coal used. The linearly independent reactions are also plotted on the CHO diagram and the region enclosed by them is shaded to indicate the 'thermally balanced region' for the specific coal. These calculations can be repeated for chars resulting from the drying and pyrolysis of the parent coal, provided that the data is available.
The information thus obtained enables the determination of important gasification parameters such as the type of oxidants to use, the ratio of C:H or C:O going into the gasification process, the UCG technique required for maximum energy, and product recovery.
The following sections essentially provide the graphical development for a US and an Australian coal, and South African coal and char.
Analysis of Rocky Mountain (USA) field trials
Subbituminous coal from the Rocky Mountain site was gasified using UCG (Dennis, 2006). The coal had a chemical formula CH0.811O0.167 and a calculated heat of formation (from coal CV) of -203.1 kJ/mol. Table I represents the ultimate analysis. In Table II, the syngas output from the two UCG operations employed is shown, namely extended linking well (ELW) / linked vertical well (LVW) and controlled retractable injection point (CRIP) (Dennis, 2006). The ELW technique used two vertical wells about 40 m apart but linked to a horizontally drilled gas production well. The CRIP method used two directionally drilled horizontal wells into the coal seam: one for steam and oxygen injection and the second for syngas recovery. The ELW and CRIP methods produced syngas with different compositions.
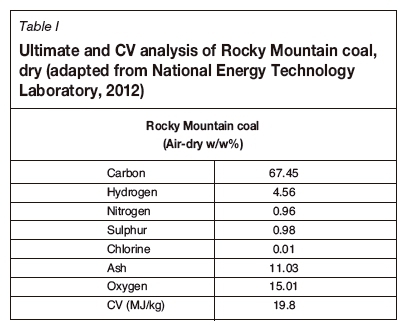
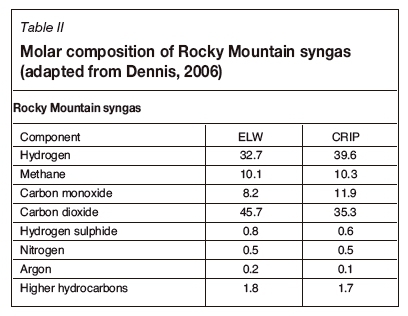
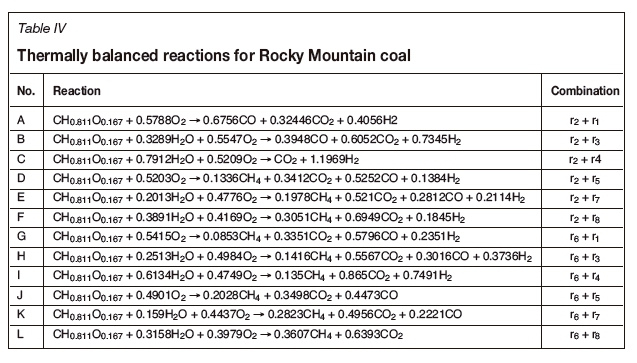
In the final technical report on the site, Dennis (2006) discussed two technologies, both using a combination of steam and oxygen as oxidants. The report details the dry gas composition for ELW and CRIP operations. The ELW site used a steam to oxygen ratio of approximately 1.88 and the CRIP site a ratio of approximately 2.04. Tables III and IV represent the stoichiometric reaction scheme adapted for the Rocky Mountain coal and the thermally balanced reactions respectively. Table V lists the standard heat of formation per compound required to determine the heat of reaction for the respective systems for all samples considered in this study. In Table V, the standard heat of formation for coal was calculated from the coal CV, assuming total combustion to liquid water and carbon dioxide only. For the char, an estimate of the CV of char from South African coals was used as derived by Theron and le Roux (2015).
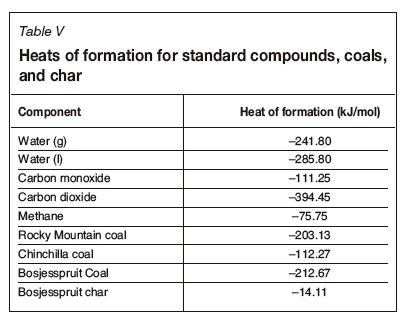
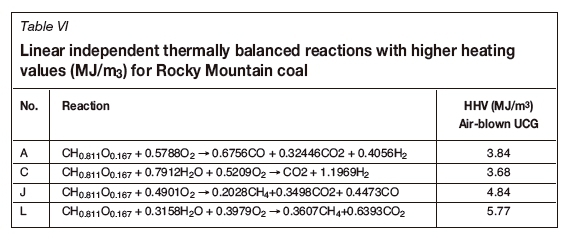
Table III is obtained by consideration of the intersection of the line joining Rocky Mountain coal with oxygen/steam and the lines H2-CO, H2-CO2, H2-CO, CH4-CO and CH4-CO2 (Figure 1). It is noted that eight reactions (r1 to r8) form the basis of the stoichiometric region within which gasification occurs. Moreover, two of these reactions are exothermic: r2 and r6. Table IV is thus obtained by taking linear combinations of exothermic-endothermic pairs such that the overall heat of reaction is zero, leading to a further 16 reactions. At these conditions the gasification reactions are considered to be thermally balanced and are considered the 'desirable' operation from a mass and energy perspective. For UCG, this implies that the cavity is 'self-sustaining' from an energy perspective and assuming that there are no heat or mass losses from the system.
A matrix analysis of the thermally balanced reactions in Table IV indicates that there are in fact only four linearly independent thermally balanced reactions (zero heat of reaction). Also included are the calculated standard state higher heating values (HHV), in MJ/m3, of the syngas produced (with air as the source of oxygen), as given by Li et al. (2004).
Figure 1 illustrates the thermally balanced region (shaded grey area) based on the four basic reactions A, C, L, and J. It is of interest to note the position of the syngas (X) from the ELW and CRIP UCG field trials, which the proximity of the field trial results relative to the theoretical developments (grey shaded region) based only on the coal thermodynamic properties. Furthermore, it is noted that the theoretical HHV ranges from 6.95-14.34 MJ/m3 (for pure oxygen blown) with an average of 10.64 MJ/m3 and confirms the actual values of about 9.5 MJ/m3 reported by Perkins (2018a). The highest HHV reported at L is not achievable due to equilibrium considerations, as the high temperatures required for gasification favour the destruction of methane and the production of CO2, leading to lower HHV values.
Analysis of Chinchilla and Bloodwood Creek (Australia) field trials
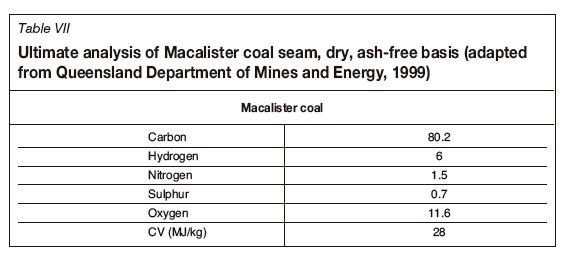
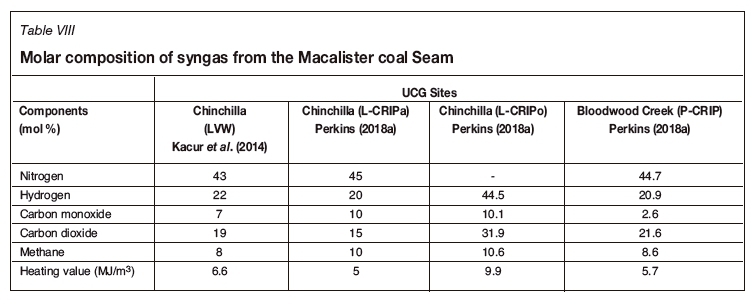
The Australian UCG projects were performed on the Macalister coal seam of the Walloon Coal Measures. At the Bloodwood Creek location the coal seam was about 200 m deep and 13 m thick, while at the Chinchilla, the depth was 130 m and the seam thickness 4 m. Coal quality data was obtained from the Queensland Department of Mines and Energy (1999) with respect to the use of Walloon coals (sub-bituminous) for power generation. Though analysis of the coal was reported on both the as-received and dry ash-free basis, the product gas was reported (in Kacur et al., 2014) only on a moisture-free basis. For this reason, the Macalister coal points are plotted as dry only, as seen in Table VII. Table VIII provides the syngas compositions obtained from various UCG methods and trials (Queensland Department of Mines and Energy, 1999).
The chemical formula for the Macalister coal seam is CHa898Oa108, with the heat of formation being -112.27 kJ/mol. Table IX considers the eight balanced stoichiometric reactions for gasification of Macalister coal with steam and oxygen. Table X provides the thermally balanced reactions associated with pairing the two exothermic reaction (r2 and r6) with the other endothermic reactions. Table XI lists the four independent linear equations for the Macalister coals.
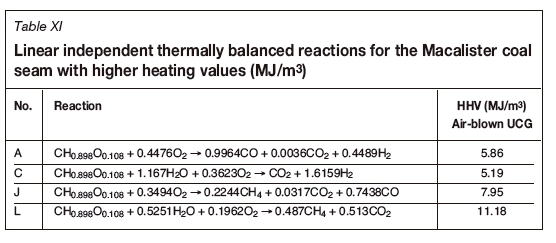
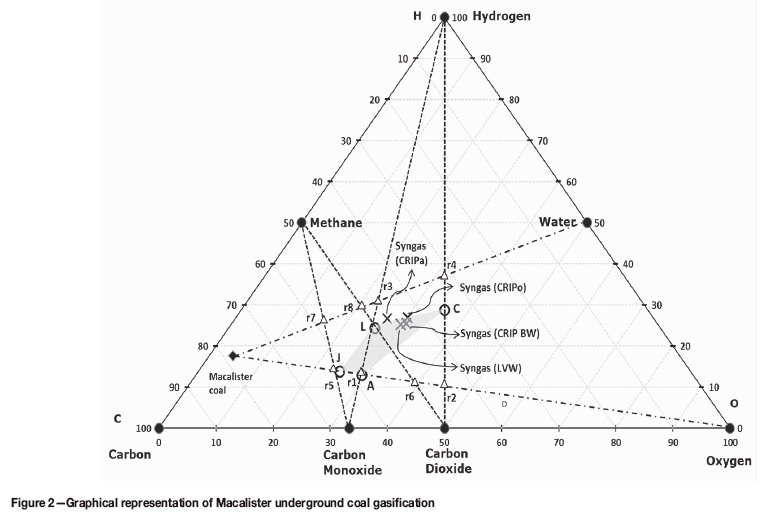
Figure 2 represents the gasification propensity of the Macalister coal. The thermally balanced region, represented by the shaded grey area, outlines the possible region where favourable UCG conditions may occur. The field test results (X) of the syngas composition from Chinchilla and Bloodwood Creek fall within the thermally balanced region. This confirms the method of UCG operation practised by the operators. Of particular interest is that all UCG methods (CRIP or LVW etc.) appear to operate within or near the thermally balanced region. The range of HHV for the UCG syngas is predicted to be within 5.19-11.18 MJ/m3 (Table XI). The Macalister coal seam data exhibits another interesting feature in that a portion of the thermally balanced region crosses the H2-CO line toward the CH4-CO line, indicating that methane formation at equilibrium (high temperature) may be feasible. This could also be a possible reason for the presence of coal seam methane in Australian coals, not seen in USA coals (Figure 1). Lastly, the operation of a UCG cavity for power generation at L (where the HHV appears to be the highest) may not be feasible due to the equilibrium being favoured to H2-CO. However, the equilibrium may be favourable at J, allowing for the production of methane and hence a higher heating value syngas (7.95 MJ/m3) may be obtained from air-blown gasification only without the need to use steam. The natural ingress of water into the cavity may not allow for air-blown UCG only and in this case, to obtain the highest HHV, the UCG would be operated along line J-L and not L-C as trialled by the different sites. It is noted that points along L-C for the field trials were to produce syngas for downstream liquid fuels production.
Gasification analysis of South African Bosjesspruit coal for UCG
Based on the findings from the CHO diagrams for US and Australian coals developed here, this study attempts to predict syngas production by UCG of a South African coal from Sasol's Bosjesspruit Colliery. The colliery is based in the Highveld Coalfield, South Africa. The bituminous coal is high in ash and typically inertinite-rich. The CHO diagram is used to demonstrate the stoichiometric region in which sensible gasification (i.e. conversion of solid coal to syngas) occurs. From the analysis of the thermally balanced reactions, a region for UCG is determined from which various syngas compositions are analysed for downstream processes: syngas for the Fischer Tropsch (FT) process requiring 2H2:1CO ratios and syngas for power production. An analysis of the ELW and CRIP methods for UCG of Bosjesspruit coal will be studied. Lastly, the feasibility of using CO2 as oxidant for UCG is considered.
Characteristics of Bosjesspruit coal
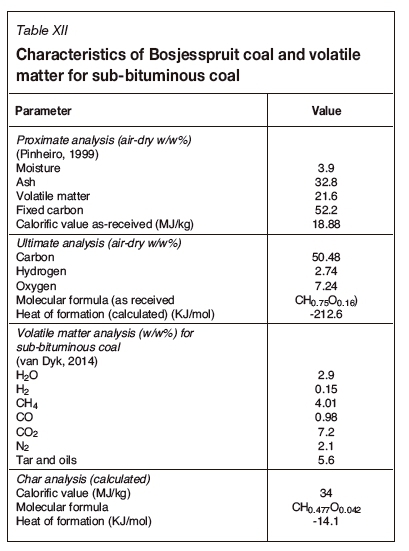
The characteristics of the Bosjesspruit coal are provided in Table XII, from which the molecular formula is determined to be CHa75Oa16 (for coal as received), with the heat of formation being -212.6 KJ/mol (Pinheiro, 1999). It must be noted that the volatile matter and char analyses used here were not determined experimentally but are derived from another South African sub-bituminous coal (van Dyk, 2014). The molecular formulae and heats of formation of Bosjesspruit coal and the Rocky Mountain coal are similar.
Analysis of UCG for Bosjesspruit coal and char
An analysis of the Bosjesspruit coal, similar to the US and Australian coals, is considered based on the details in Table XII. The oxidants are assumed to be air and steam, from which Tables XIII and XIV are derived for the stoichiometric basis reactions and the four thermally balanced independent reactions respectively. Table XV and Table XVI are for the char resulting from the drying and pyrolysis of the Bosjesspruit coal. The char analyses for the US and Australian coals have not been considered due to lack of information on the pyrolysis and char products of those coals.
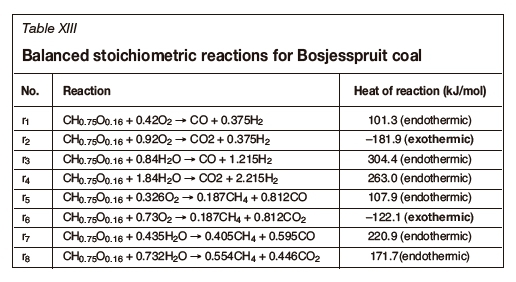
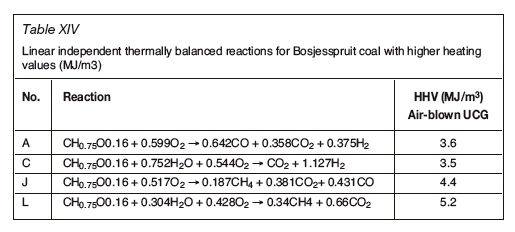
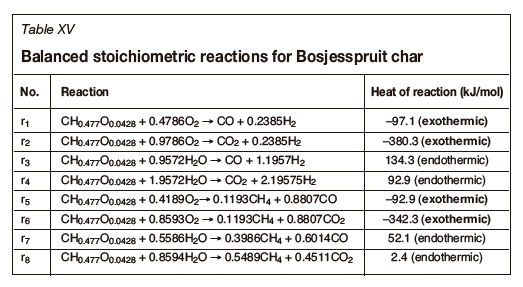
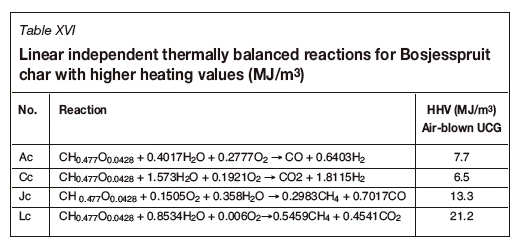
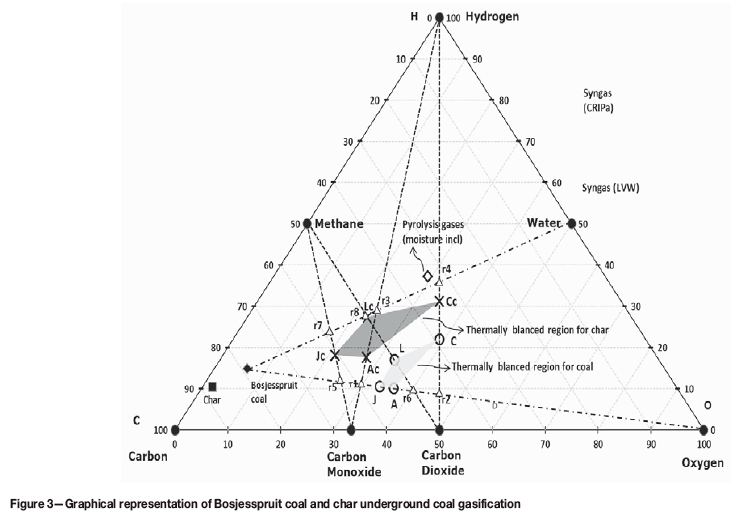
Figure 3 represents the gasification reactions for the Bosjesspruit coal and char. The thermally balanced region for coal is represented by the light grey area bounded by points A,C,L, and J, and for the char by Ac, Cc, Lc, and Jc (dark grey). There is a resemblance to Rocky Mountain coal (Figure 1) as both the molecular formulae and heat of formation values are similar, and hence the thermally balanced regions appear very similar. The syngas resulting from the CRIP method for Rocky Mountain coal appears to be an outlier from the thermally balanced region in Figure 1. However, if the similarity of the Bosjesspruit coal is applied to the Rocky Mountain coal, then the Bosjesspruit char thermally balanced region will be sufficient to predict the Rocky Mountain char gasification behaviour. In this case, the CRIP result for Rocky Mountain coal would fall within the char gasification thermally balanced region. This is an important result, suggesting that UCG using CRIP leads to pyrolysis and subsequent char gasification, which is not prominent in LVW methods.
The effect of coal drying and pyrolysis is evident from Figure 3, where the char thermally balanced region has significantly enlarged with a higher achievable HHV (6.521.2 MJ/m3) than for coal (3.5-5.2 MJ/m3). This thermally balanced region is more efficient and shows the importance of allowing the coal to dry and pyrolysis to occur prior to gasification. Also, the equilibrium at Jc is favourable, thus allowing the production of methane and carbon monoxide with higher HHV (13.3 MJ/m3) with air as oxidant.
LVW vs. CRIP for Bosjesspruit coal
The models for UCG methodologies are complex (Perkins, 2018a). Andrianopolous, Korre, and Durucan (2015) attempted to model LVW and CRIP. Their description of the mechanisms for CRIP suggests that there are roof-top and floor-bottom (spalled roof material that falls to the bottom) gasification steps resulting in different gas compositions that ultimately mix and exit the reactor cavity. This suggests that there is a greater degree of drying and pyrolysis products mixing with the syngas from char gasification. In comparison to the LVW method, the high-temperature gasification zone is localized near the reactor injection point, implying that any pyrolysis product from freshly exposed coal surfaces will eventually react to form the final exit gases. The implication of this analysis is that LVW follows the UCG thermally balanced results obtained for coal (Figure 3 - light grey area), while CRIP follows the char reactions (Figure 3 - dark grey area). These results for LVW (or ELW) are confirmed by the USA (Figure 1) and Australian (Figure 2) trials, where both ELW/LVW lie within the thermally balanced region for the coals (not char). This leads to the conclusion that South African coals need to be studied further to determine the pyrolysis-char behaviour prior to deciding on the UCG method. The results also suggest CRIP would be the preferred technology choice for Bosjesspruit coal, where the pyrolysis dynamics are important.
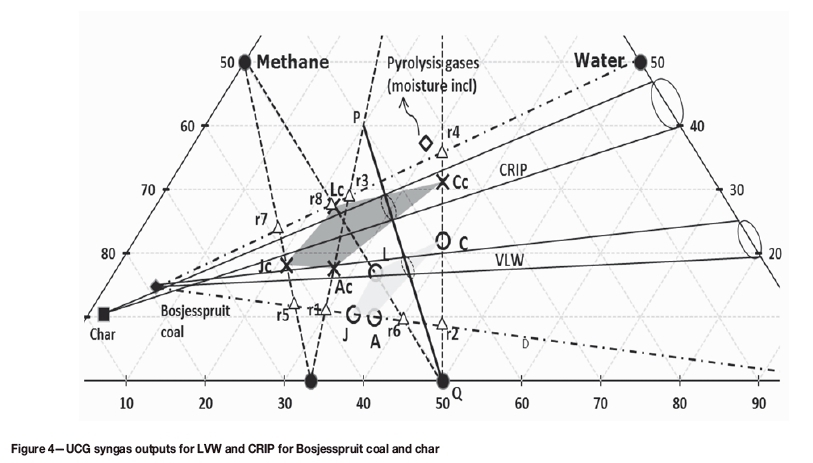
Predictions of syngas output for LVW and CRIP for Bosjesspruit coal
Based on the analysis above, Figure 4 depicts the possible outputs for CRIP and LVW (dotted semicircles) with the optimal steam-oxygen ratios (solid semicircles) for liquid fuel production. The outputs are based on the assumption that field trials will obtain gasification outputs similar to surface gasifiers, which are typically designed for 2H2:1CO - this ratio is satisfied along line PQ in Figure 4. The estimated HHV for CRIP would be around 8 (max. 13.3) MJ/m3 and 3.5 (max. 4.4) MJ/m3 for LVW. However, for power generation the UCG CRIP would operate close to Jc, where the maximum equilibrium HHV is 13.3 MJ/m3 for an air-blown system.
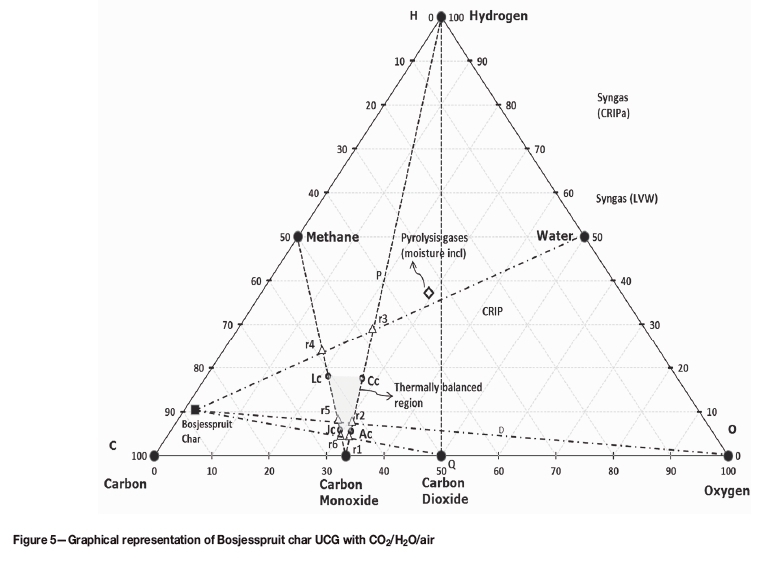
Analysis of UCG for Bosjesspruit char and CO2/ steam/air oxidants
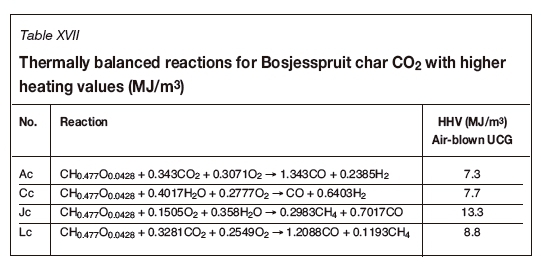
A CO2-fed UCG process is possible where a source of pure CO2 is available, as would be the case at Sasol's facility in Secunda where near-pure CO2 is vented to the atmosphere. Perkins and Vairakannu (2017) considered oxidant and gasifying medium selection in UCG processes and discussed the use of CO2/O2. Figure 5 and Table XVII indicate the theoretical feasibility of operating a UCG process with CO2/steam/air injection with Bosjesspruit charred coal. Of particular interest is that the syngas output from such a process will comprise predominately CO, H2, and CH4, with significantly high HHV values ranging from 7.3 to 13.3 MJ/m3. A sensible strategy for operating a UCG site with CO2 injection would be to operate near the thermally balanced line joining Jc and Lc (Figure 5), and preferably slightly to the right-hand side so that the cavity is operating 'hot'. The advantage of operating on the 'hot' side is that the excess heat can be used to create the char required for better thermodynamic efficiency of the system.
Conclusions
The CHO phase diagram proved to be a useful tool for analysing gasification systems, and in particular for UCG where a limited number of control parameters exist. The development of a thermally balanced system for the coals allowed the prediction of the syngas output within a narrow region - these regions were tested for US and Australian field trials and were found to correlate with reasonably accuracy. This method was able to predict, without prior knowledge of the UCG technique employed, the flow rates of oxidants, reaction kinetics, heat and mass transfer kinetics, and hydrogeology. It was shown that only four reactions govern the output of any thermally balanced UCG system.
A South African coal was assessed and the effects of pyrolysis were shown to enhance the thermodynamic efficiency of the system, leading to a key conclusion that the determination of pyrolysis propensity and char characteristics should form part of any future UCG programme. It was suggested that the CRIP method be used for the Bosjesspruit coal, where a theoretical maximum syngas HHV can be obtained (13.3 MJ/m3) when air is used as oxidant. The use of CO2 in addition to steam and air indicates that a UCG process for the Bosjesspruit char would be possible and capable of producing syngas with a HHV value as high as 8.8 MJ/m3.
Acknowledgements
A part of this work was presented at the workshop held in 2016 by the South African Underground Coal Gasification Association (SAUCGA). Also, my thanks to Keeshan Moodley for the presentation, development of the ternary CHO diagram, and some of the literature field data collation.
References
Andrianopoulos, E., Korre, A., and Durucan S. 2015. Chemical process modelling of underground coal gasification and evaluation of produced gas quality for end use. Energy Procedia, vol. 76. pp. 444-453. [ Links ]
Battaerd, H.A.J. and Evans, D.G. 1979. An alternative representation of coal composition data. Fuel, vol. 58, no. 2. pp.105-108. [ Links ]
De Pontes, M., Mocumbi, P., and Sangweni, C.J. 2014. Gas resources and reserves in Southern and East Africa. Proceedings of the FFF Gas Conference, Johannesburg, 21 May. Fossil Fuel Foundation. [ Links ]
Dennis, S. 2006. Rocky Mountain underground coal gasification test project (Hanna, Wyoming): Final technical report for the period 1986 to 2006. National Energy Technology Laboratory, US Department of Energy. pp. 1-51. [ Links ]
Engelbrecht, A.D., Everson,R.C., Neomagus, H.W.P.J., and North B.C. 2010. Fluidized bed gasification of selected South African coals. Journal of the Southern African Institute of Mining and Metallurgy, vol. 110. pp. 225-230. [ Links ]
Hsu, C., Davies, P.T., Wagner N.J., and Kauchali S. 2014. Investigation of cavity formation in lump coal in the context of underground coal gasification. Journal of the Southern African Institute of Mining and Metallurgy, vol. 114. pp. 305-309. [ Links ]
Huang, W.G., Wang, Z.T., Xin L., Duan T.H., and Kang G.J. 2012. Feasibility study on underground coal gasification of No. 15 seam in Fenghuangshan Mine. Journal of the Southern African Institute of Mining and Metallurgy, vol. 112. pp. 879-903. [ Links ]
Jowkar, A., Sereshki, F., and Najafi, M. 2018. A new model for evaluation of cavity shape and volume during underground coal gasification process. Energy, vol. 148. pp. 756-765. [ Links ]
Kacur, J., Durdan, M., Laciak, M., and Flegner, P. 2014. Impact analysis of the oxidant in the process of underground coal gasification. Measurement, vol. 51. pp. 147-155. [ Links ]
Kauchali, S. 2017. Development of sustainable coal to liquid processes: Minimising process CO2 emissions. South African Journal of Chemical Engineering, vol. 24. pp.176-182. [ Links ]
Klebingat, S., Kempka, T., Schulten, M., and Azzam, R. 2018. Optimization of synthesis gas heating values and tar by-product yield in underground coal gasification. Fuel, vol. 229. pp. 248-261. [ Links ]
Li, X.T., Grace, J.R., Lim, C.J., Watkinson, A.P., Chen, H.P., and Kim, J.R. 2004. Biomass gasification in a circulating fluidizing bed. Biomass and Bioenergy, vol. 26. pp.171-193. [ Links ]
Mavhengere, P., Vittee, T., Wagner, N.J., and Kauchali, S. 2016. An algorithm for determining kinetic parameters for the dissociation of complex solid fuels. Journal of the Southern African Institute of Mining and Metallurgy, vol. 116. pp. 55-63. [ Links ]
Perkins, G. 2018a. Underground coal gasification - Part I: Field demonstrations and process performance. Progress in Energy and Combustion Science, vol. 67. pp. 158-187. [ Links ]
Perkins, G. 2018b. Underground coal gasification - Part II: Fundamental phenomena and modeling. Progress in Energy and Combustion Science, vol. 67. pp. 234-274. [ Links ]
Perkins, G. and Vairakannu, P. 2017. Considerations for oxidant and gasifying medium selection in underground coal gasification. Fuel Processing Technology, vol. 165. pp. 145-154. [ Links ]
Pinheiro, H.J. (ed.) 1999. A techno-economic and historical review of the South African coal industry in the 19th and 20th centuries, and analyses of coal product samples of South African collieries 1998 - 1999. SABS Bulletin 113. pp. 68-74. [ Links ]
Queensland Department of Mines and Energy 1999. Utilisation of Walloon coals of Southern Queensland for power generation, Department of Mines and Energy, Queensland, Australia. pp. 1-38. [ Links ]
Theron, J.A. and le Roux, E. 2015. Representation of coal and coal derivatives in process modelling. Journal of the Southern African Institute of Mining and Metallurgy, vol. 116. pp. 339-348. [ Links ]
Van Dyk, J.C., Keyser, M., and Coertzen, M. 2006. Syngas production from South African coal sources using Sasol-Lurgi gasifiers. International Journal of Coal Geology, vol. 65. pp. 243-253. [ Links ]
Van Dyk, J.C., Waanders, F. and Brand, J. 2014. Applying Thermo 350M underground: A FactsageTM equilibrium study for undergound coal gasification. Proceedings of the GTT Workshop, Aachen, Germany, July 2014. [ Links ]
Wei, J. 1979. A stoichiometric analysis of coal gasification. Industrial & Engineering Chemistry Process Design and Development, vol. 18, no. 3. pp. 554-558. doi: 10.1021/i260071a034 [ Links ]
Yang, D., Koukouzas, N., Green, M., and Sheng, Y. 2016. Recent development on underground coal gasification and subsequent CO2 storage. Journal of the Energy Institute, vol. 89. pp 469-484. [ Links ]
Zogala, A. 2014a. Critical analysis of underground coal gasification models. Part I: equilibrium models - literary studies. Journal of Sustainable Mining, vol. 13, no. 1. pp. 22-28. [ Links ]
Zogala, A. 2014b. Critical analysis of underground coal gasification models. Part II: kinetic and computational fluid dynamics models. Journal of Sustainable Mining, vol. 13, no. 1. pp. 29-37. [ Links ] ♦
Paper received Apr. 2018
Revised paper received Sep. 2018

