


Serviços Personalizados
Artigo
 Inglês (pdf)
 Artigo em XML
 Referências do artigo
Indicadores

Links relacionados
-
 Citado por Google
 -
 Similares em Google
Compartilhar

 Permalink
Journal of the Southern African Institute of Mining and Metallurgy
versão On-line ISSN 2411-9717
versão impressa ISSN 2225-6253
J. S. Afr. Inst. Min. Metall. vol.118 no.10 Johannesburg Out. 2018
http://dx.doi.org/10.17159/2411-9717/2018/v118n10a6
Temperature and electrical conductivity stratification in the underground coal gasification zone and surrounding aquifers at the Majuba pilot plant
L.S. Mokhahlane; M. Gomo; D. Vermeulen
Institute for Groundwater Studies, University of the Free State
SYNOPSIS
Underground coal gasification (UCG) is a chemical process that converts coal in situ into a gaseous product at elevated pressures and temperatures. UGC creates an underground cavity that may be partially filled with gas, ash, unburned coal, and other hydrocarbons. A water stratification assessment can help assess the diffusion effects within the underground cavity. In this study we assessed the stratification by comparing the electrical conductivity (EC) profiles of background boreholes to the verification borehole that was drilled after gasification was complete. Stratification was seen in all boreholes, including the cavity borehole. The EC levels were lower in the cavity, which may be due to the dilution induced by injecting surface water during quenching of the gasifier. The thermal gradients showed a steady increase in temperature with depth, with higher temperatures measured in the verification borehole. This temperature increase suggests that heat is still being retained in the cavity, which would be expected. This study serves as the preliminary investigation of the stratification of temperature and EC, and will be followed by in-depth surveys that cover all the groundwater monitoring wells in the different aquifers at the site.
Keywords: stratification, underground coal gasification, Majuba pilot plant, electrical conductivity, temperature, aquifer.
Introduction
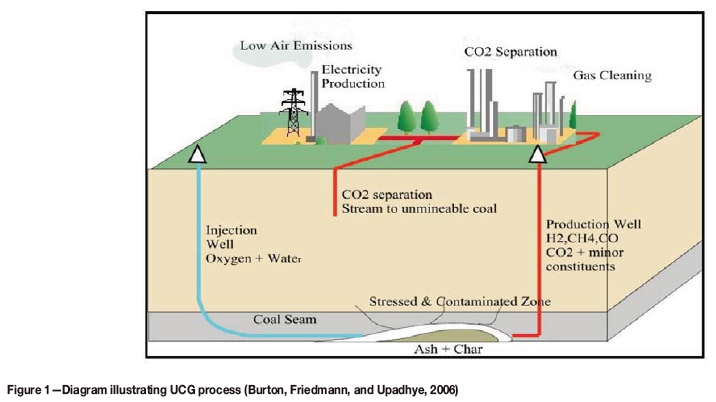
Underground coal gasification (UCG) is a technology that seeks to exploit coal reserves through gasification of in situ coal and extract a synthetic gas that can be used for electricity generation (Burton, Friedmann, and Upadhye, 2006). This is achieved by injecting oxidants through boreholes into the coal seams to induce gasification. The resultant synthetic gas (methane, hydrogen, and carbon monoxide) is piped to the surface via production wells, as seen in Figure 1. The UCG process offers some environmentally friendly outcomes such as no process tailings, reduced sulphur emissions, and low discharge of ash, mercury, and tar. The UCG cavity is, however, a source of gaseous and liquid pollutants (Liu et al., 2007). Since the UCG process occurs in a natural environment, this raises concern about the impacts on the regional groundwater system.
The by-products of gasification can react with the surrounding strata or be dissolved in groundwater (Krzysztof and Krzysztof, 2014).
However, this is unlikely to occur during gasification as the pressure in the cavity and the connected gas-filled voids must be kept below the hydrostatic pressure of the aquifer. This ensures that contaminants are always contained in the gasifier, as groundwater flows towards the cavity. A groundwater sink hence develops in the cavity as the gasifier consumes groundwater through evaporation, chemical reactions, and as part of the syngas in production wells.
Stratification is the vertical distribution of salinity, pH, and temperature of groundwater in a stepwise or layered manner (Ryuh et al., 2017). Stratification within an underground cavity associated with coal mining is common in the Karoo coal-bearing formations (Johnstone, Dennis, and McGeorge, 2013). UGC creates an underground cavity as a result of coal being gasified in situ. Groundwater is an important input in the gasification process as water in the gaseous phase takes part in various chemical reactions to produce hydrogen gas, which forms part of the synthetic gas product. Upon completion of the gasification process, groundwater levels are expected to rebound in the gasification zone and the groundwater flow to resume. The geochemical evolution of the UCG cavity will proceed as a result of interactions between groundwater and the various residue products in the cavity, including ash, unburned coal, heat-affected surrounding strata, and hydrocarbons. Assessment of stratification in the UCG cavity is important as it may point to chemical processes such as diffusion, which may influence the evolution of contaminants. Johnstone, Dennis, and McGeorge (2013) reported stratification in cavities in coal mines at Ermelo, Mpumalanga Province, which showed groundwater quality evolves from sulphate-type water to sodium-type water due to the action of sulphate-reducing bacteria. The stratification led to the scrapping of the planned plant for treatment of decanting groundwater as the water quality at the top of the cavity was better than that at the bottom.
Groundwater contamination can be assessed using the source-pathway-receptor model in which the polluted groundwater travels through a flow path in order to impact a receptor or user of the resource. This study aims to assess the pathway section of the model using a borehole that intersects the gasification zone or cavity (source). This borehole is termed the verification borehole, and two other boreholes are used for comparison and as background boreholes. The water quality is assessed using electrical conductivity (EC). Temperature is assessed as an additional parameter but does not necessarily relate to the EC.
Study area
The initial groundwork on UCG at the Majuba coalfield began around 2005 and a pilot plant was successfully commissioned in January 2007, with product gas being co-fired into the nearby Majuba power station by October 2010.
The Majuba pilot plant was successfully operated until September 2011, when decommissioning commenced with the shutdown of the gasifier (G1). Shutdown of G1 continued until May 2013 and involved complex activities included quenching using surface water and rebounding of the natural groundwater head. The successful performance and shutdown of the Majuba UCG pilot plant is a significant step towards full commercialization of UCG technology, as this was the first UCG plant in Africa. The shutdown of G1 presented an opportunity to investigate some of the key environmental questions regarding groundwater contamination.
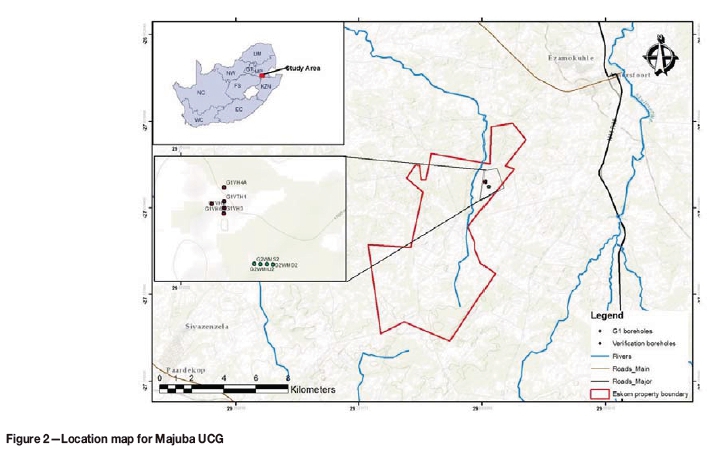
The Majuba UCG pilot plant is located in South Africa's Mpumalanga Province, about 35 km north-west of the town of Volkrust. The site covers an area of around 60 ha on the eastern bank of the Witbankspruit (Figure 2). The topography is characterized by regular hills, attributed to erosion of the underlying dolerite sill.
Geology
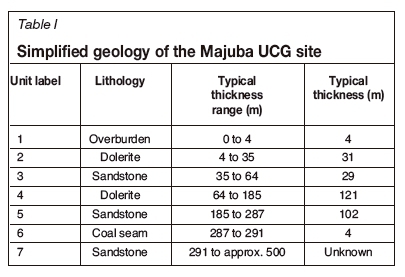
The Majuba UCG site falls within the Vryheid Formation of the Lower Ecca Group, which is part of the Karoo Supergroup. The Karoo sequence is generally characterized by interbedded layers of sandstone, shale, and mudstone, with intrusive dolerite sills and dykes. At Majuba there are two dolerite sills. The shallower dolerite extends from roughly 70 m deep to around 170 m. The deep dolerite is located at around 50 m below the Gus coal seam, but in at other localities it transects the seam. A simplified geological profile of the Majuba UCG site is given in Table I.
Hydrogeology
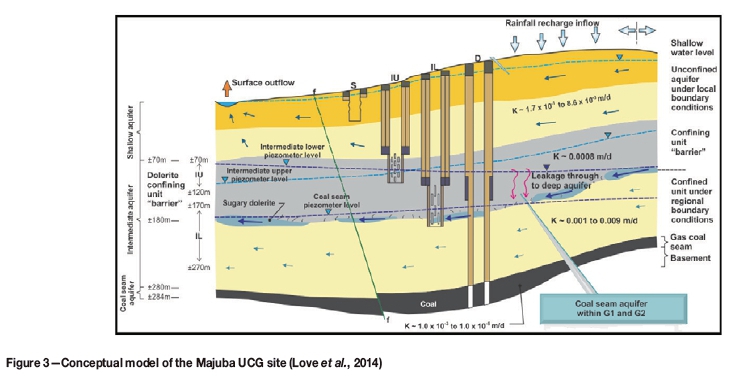
Three distinct overlying groundwater systems are present at the Majuba UCG site, as seen in Figure 3. The upper weathered (shallow) aquifer is usually low-yielding (range 110 m3/d) owing to its trivial thickness, but the water quality is good due to years of groundwater flow through the weathered strata. It is estimated that the shallow aquifer can go as deep as 70 m. It is underlain by the intermediate aquifer. Groundwater flow through the intermediate aquifer is mainly through fractures, cracks, and joints as the Karoo sediments are excessively cemented, which prevents any substantial infiltration of water. The aquifer can be divided into three zones - the intermediate upper aquifer, intermediate lower aquifer, and the coal seam (deep) aquifer, as seen in Figure 3. The coal seam aquifer is at a depth of around 280 m and is underlain by the Dwyka sediments. The groundwater in the coal seam aquifer is of poor quality and can generally be classified as saline. The groundwater monitoring network had been placed in such a way that all the aquifers are monitored (Figure 3).
Methodology
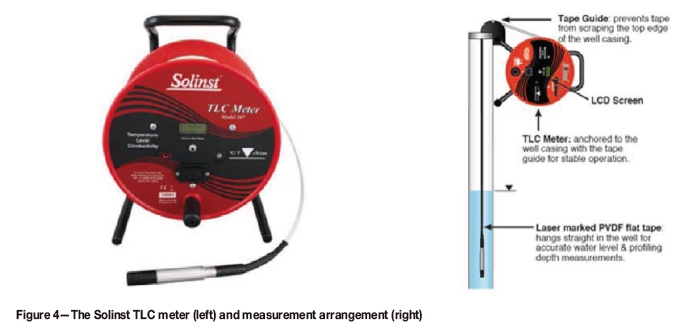
Three boreholes with depths of around 290 m were selected for this study. Two of the boreholes were groundwater monitoring boreholes for monitoring the coal seam aquifer within the production zone. The other was the verification borehole, which was drilled into the UCG cavity after the gasification process was concluded. The monitoring boreholes were used as background as they are outside the gasification zone and hence the geochemistry is not expected to be influenced by the gasification process or its products. The verification borehole intersects the UCG cavity and hence provides useful information on the geochemical evolution of the gasification zone. Down-the-hole profiles of temperature and electrical conductivity (EC) were taken in order to investigate water stratification in the coal seam aquifer and UCG cavity. Stratification in old coal mine voids in the region has been reported by Johnstone, Dennis, and McGeorge (2013). This has resulted in dilution of polluted water, thereby eliminating the need for water treatment. A Solinst TLC (temperature, level, and conductivity) meter similar to the one depicted in Figure 4 was used to profile the EC down the borehole. Water level measurements can be read off the marked flat reeled tape made of polyvinylidene fluoride (PVDF) material. EC and temperature measurements are displayed on a convenient LCD display. The probe was lowered to the bottom of the borehole and depending on the measurement interval selected, measurements of temperature and EC were recorded simultaneously at each depth.
Results and discussion
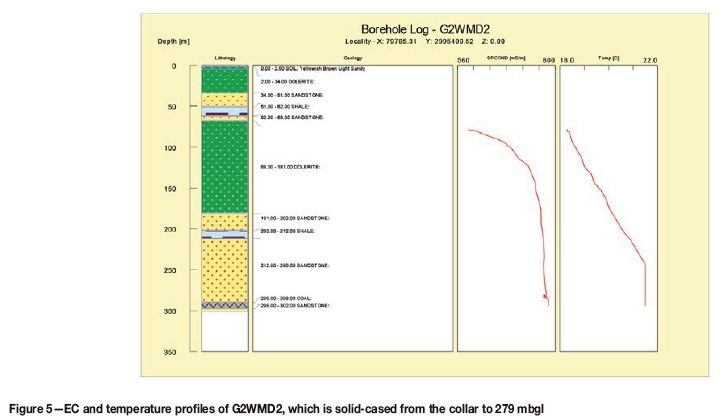
The electrical conductivity and temperature profiles for the groundwater monitoring borehole G2WMD2 are shown in Figure 5. G2WMD2 is a monitoring borehole within the production zone that is used to monitor the coal seam aquifer (deep aquifer). The borehole is solid-cased from surface to 279 m, the depth of the coal seam.
The EC of the water increases with depth, with a maximum of 780 mS/m measured at a depth of 294 m below ground level (mbgl). The temperature also increases with depth until 244 mblg, where it levels off at 21.5°C. The EC profile shows erratic behaviour around 283 mbgl, which is approximately where the casing ends and is possibly a groundwater flow zone. This may be the best location to take groundwater samples as it might be where fresh water from the aquifer is flowing, as the borehole is cased above this point. Deeper than this a general trend of increasing EC is seen in the profile.
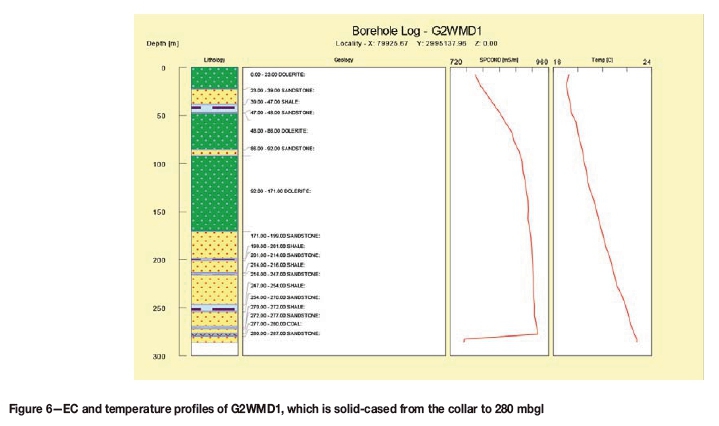
The EC and temperature profiles for the groundwater monitoring borehole G2WMD1 are shown in Figure 6.
A similar trend of increasing EC and temperature to that observed in G2WMD1 was seen in G2WMD2. There is a drop in EC at depths greater than 283 mblg. This is also where the casing ends and possibly represents an area where fresh aquifer water is flowing. The drop in EC suggests that fresh aquifer water is of a better quality than the stagnant water in the well. Purging of the borehole might lead to a better EC profile in terms of water quality. In contrast to G2WMD1, the temperature increases with depth without levelling off.
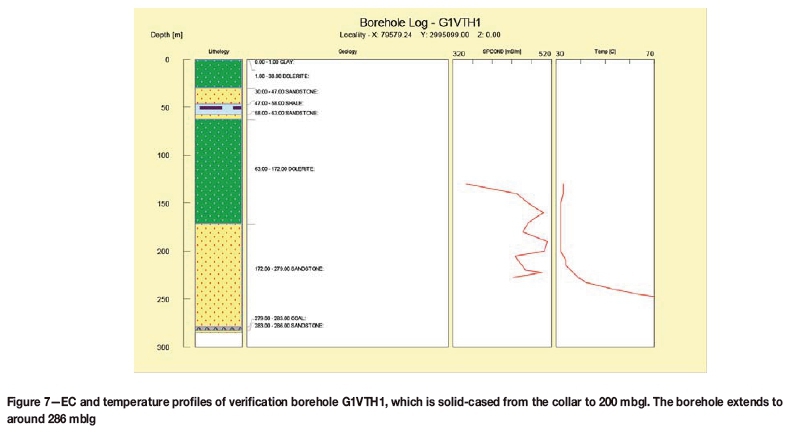
The EC and temperature profiles for the verification borehole G1VTH1 are shown in Figure 7.
G1VTH1 is the verification borehole drilled after gasification, and the EC and temperature profile are for the area in the borehole where water was encountered. The EC profile shows erratic behaviour, while the temperature increases with depth but levels off at a depth of 220 mbgl. The maximum temperature of 70°C was measured at a depth of around 250 m. The maximum temperature in G2WMD2 was 21.5°C, while in G2WMD1 it was 22.8°C. The erratic behaviour of the EC in G1VTH1 may be due to groundwater flow zones or fractures intersecting the well. This needs further investigation, but in general the EC is much lower in the verification borehole than in the monitoring boreholes. This could be due to dilution by surface water that was introduced into the cavity during quenching of the gasifier.
Conclusions
The EC and temperature are stratified in all the boreholes (both monitoring and verification). The stratification in EC shows that the quality of water higher up in the well is better than that towards the bottom. The EC was erratic in the verification borehole but again the general trend indicated better quality water in the upper part of the well than in the gasification zone. This suggests that in the event of fractures forming due to roof collapses or any other event that could create a flow path between the cavity water and the shallower strata, the water quality will not be uniform throughout the hydraulic connection. Better quality water will tend to be located at the shallow levels, with poor quality water concentrated at the bottom. This may be due to chemical processes such as diffusion and needs further investigation. Johnstone, Dennis, and McGeorge (2013) found a similar trend in groundwater in an underground cavity induced by coal mining. There is a general increase in temperature in the verification borehole. This is expected at UCG sites, since it is a result of heat remaining in the UCG cavity even two years after the gasifier was shut down. The EC profile shows better quality water in the verification borehole than in the monitoring boreholes. This could be due to dilution by surface water introduced during quenching. The EC profile results were not related to groundwater transmission zones in the monitoring boreholes G2WMD1 and G2WMD2. This is due to the boreholes being cased for their entire length until the coal seam depth.
References
Burton, E., Friedmann, J., and Upadhye, R. 2006. Best practices in underground coal gasification. Lawrence Livermore National Laboratory, US Department of Energy. [ Links ]
Craig, H. and Gordon, L,1.1965. Deuterium and oxygen 18 variations in the ocean and the marine atmosphere. Proceedings of Stable Isotopes in Oceanographic Studies and Paleotemperatures, Laboratorio di Geologia Nucleate, Spoleto, Italy. Tongiogi, E. (ed.). V. Lishi e F., Pisa. pp. 9-130. http://climate.colorado.edu/research/CG/ [accessed 5 July 2018]. [ Links ]
Gordon, J.J., Edward, T.W.D., Bursey, G.G., and Prowse, T.D. 1993. Estimating evaporation using stable isotopes: Quantitative results and sensitivity analysis for two catchments in northern Canada. Nordic Hydrology, vol. 24, no. 79. pp. 79-94 [ Links ]
Johnstone, A., Dennis, I., and McGeorge, N. 2013. Groundwater stratification and impact on coal mine closure. Proceedings of the 13th Biennial Groundwater Division Conference, Durban, South Africa. http://gwd.org.za/sites/gwd.org.za/files/03_A%20Johnstone%20et%20al_Groundwater%20Stra tification%20and%20impact%20on%20coal%20mine%20closure%20final.pdf [accessed 5 July 2018]. [ Links ]
Love, D., Beeslar, M.J., Blinderman, M., Pershad, S., van der Linde, G., and van der Riet, M. 2014. Ground water monitoring and management in underground coal gasification. Proceedings of Unconventional Gas - Just the Facts, Pretoria, South Africa, 18-19 August 2014. Groundwater Division of the Geological society of south Africa and Mine water Division of the water institute of south Africa. [ Links ]
Krzysztof, K. and Krzysztof, S. 2014. Chemical and toxicological evaluation of underground coal gasification (UCG) effluents: The coal rank effect. Ecotoxicology and Environmental Safety, vol. 112. pp. 105-113. [ Links ]
Mook, W.G. 2000. Environmental Isotopes in the Hydrological Cycle, Volume 1: Introduction. IHP-V, UNESCO, Paris. 280 pp. http://www.iaea.or.at/programmes/ripc/ih/volumes/volumes.htm [accessed 14 July 2015]. [ Links ]
Liu, S., Li, J., Mei, M., and Dong, D. 2007. Groundwater pollution from underground coal gasification. Journal of China University of Mining and Technology, vol. 17, no. 4. pp. 0467-0472. [ Links ]
Govere, J.M., Durrheima, D.N., Coetzee, M., and Hunt, R.H. 2001. Malaria in Mpumalanga Province, South Africa, with special reference to the period 1987-1999. South African Journal of Science, vol. 97, no. 1-2. pp. 55-58 [ Links ]
Ryuh, Y.-G., Do, H.-K., Kim, K.-H., and Yun, S.-T. 2017. Vertical hydrochemical stratification of groundwater in a monitoring well: implications for groundwater monitoring on Co2 leakage in geologic storage sites. Energy Procedia, vol. 114. pp. 3863-3869. [ Links ]
Paper received Apr. 2018;
Revised paper received Aug. 2018

