


Services on Demand
Article
 English (pdf)
 Article in xml format
 Article references
Indicators

Related links
-
 Cited by Google
 -
 Similars in Google
Share

 Permalink
Journal of the Southern African Institute of Mining and Metallurgy
On-line version ISSN 2411-9717
Print version ISSN 2225-6253
J. S. Afr. Inst. Min. Metall. vol.118 n.8 Johannesburg Aug. 2018
http://dx.doi.org/10.17159/2411-9717/2018/v118n8a3
SOCIETY OF MINING PROFESSORS 6TH REGIONAL CONFERENCE
Geological mapping and modelling training in the University of the Witwatersrand Mine Tunnel, South Africa
C. Birch
School of Mining Engineering, University of the Witwatersrand, South Africa
SYNOPSIS
A simulated mine tunnel, stope, lamp room, and refuge chamber have been built in the basement of the School of Mining Engineering in the Faculty of Engineering and the Built Environment at Johannesburg's University of the Witwatersrand (Wits). Mock-ups are widely used in the mining industry to conduct training in a safe controlled environment.
This tunnel has been utilized for the past four years as part of the Advanced Mineral Resource Management Geological Modelling module. Students are required to map geological features depicted in the tunnel and link these to the information from a provided borehole database. This borehole database needs to be validated before the students create a 3D geological model that represents Bushveld Complex Critical Zone stratigraphy. Leapfrog Geo provides the software used for this assignment and they present two days of practical training in the creation of geological models to the students.
Students have been very positive about the learning experience and the majority of them have produced acceptable geological models. This combination of geological mapping in a simulated mine environment and the creation of a 3D geological model appears to be unique to Wits.
Keywords: geological modelling, mock-up, geological mapping, Leapfrog Geo, training, education.
Introduction
There are many people with vast experience in mining who never had the opportunity to attend full-time at a university or other tertiary institute. Their lack of formal academic qualifications and skills related to research and writing is hampering their promotional prospects. To address this gap, the Advanced Mineral Resource Management (MRM) programme was developed more than a decade ago in conjunction with a steering committee from the University of the Witwatersrand (Wits) School of Mining Engineering and the mining industry.
Eighteen modules are offered, all of which are run as short five-day courses that are assessed by means of examinations and assignments. The students, while completing the modules, develop presentation, writing, and research skills. Students find they are more confident in expressing their ideas verbally as well as in written form after completing the programme. The students on the Advanced MRM programme are predominantly non-graduate geological technicians, surveyors, mine planners, evaluation specialists, mining engineers, and plant metallurgists. Some of the students are university graduates and are doing the programme to supplement their mineral resource management skills. All the modules are considered to be at the South African National Qualifications Framework (NQF) Level 6.
Geological Modelling is one of the modules that form part of the Advanced MRM programme. For the past three years, the assignment exercise required for this module has been based on the Wits Mine Tunnel. Geological modelling training is primarily conducted in a classroom environment. Geological modelling courses are presented by institutes like the Geological Society of South Africa (Geological Society of South Africa, 2017) as well as the software providers (Leapfrog, 2017a) and consulting firms (SRK Consulting, 2017). Most of these courses target professionals working in the industry and are often focused on a specific software package or specialized task. None of the current courses found during an online search link basic geological mapping with creating a 3D geological model.
The Mine Tunnel
Mock-ups and simulators are well-established training tools in the mining skills development space. Many mines have mock-up stopes and tunnels to conduct basic mining training, including drilling, blasting, cleaning, and tramming activities. Mock-ups allow training to be conducted in a controlled, safe environment free from noise and other hazards found in the mining environment (Cirda Minerals Processing, 2007). Access to the mock-up is easy and not restricted by the constraints imposed by the production environment. Certain specialist contractors have built dedicated mock-ups specifically for their types of mining activities. An example of this is the shaft-sinking mock-up at Bentley Park (Carletonville) built by Murray & Roberts Cementation Training Academy (Murray & Roberts Cementation, 2007).
The Wits Mine Tunnel forms part of the Wits DigiMine Project (University of the Witwatersrand. 2015). Portions of the Chamber of Mines building on the West Campus have been converted into a 'mine'; with the roof of the building representing the 'surface', the stairwell representing the 'shaft', with the mock mine stope, lamp room, rescue chamber and tunnel located in the basement. The facilities cost approximately R15 million and were built with sponsorship from Gold Fields, New Concept Mining, and Sibanye (University of the Witwatersrand, 2015). The newly formed Wits Mining Institute is conducting extensive research in the mock-ups, including developing advanced software linking the sensors in the stope and tunnel to high-technology infrastructure, including a control room that monitors real-time ground movement, underground airflow modelling, and personnel access control and tracking (Engineering News, 2016).
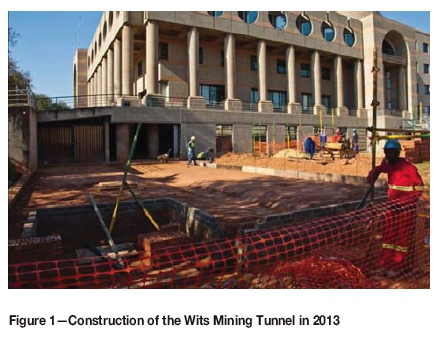
The mock-up of the tunnel formed the first phase of the project (University of the Witwatersrand, 2015). This tunnel was established as a way to facilitate teaching and learning. The tunnel is 70 m long and construction took place in 2012/2013 (Figure 1).
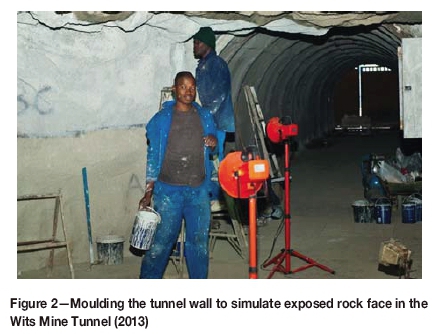
As part of the teaching and learning functions of the tunnel, a decision was made to simulate geology onto the walls of the tunnel. This included moulding the walls to simulate rock and painting the walls to represent various lithologies. A dyke and a fault are also included in the simulation (Figures 2 and 3). The portrayal of the rock types and structures was conducted with assistance from the School of Geosciences at Wits. The bulk of the tunnel has sets installed and additional shotcrete is applied. Geological mapping in this portion is not possible. The sets were installed to investigate the propagation of radio waves through this type of tunnel support as part of the DigiMine project.
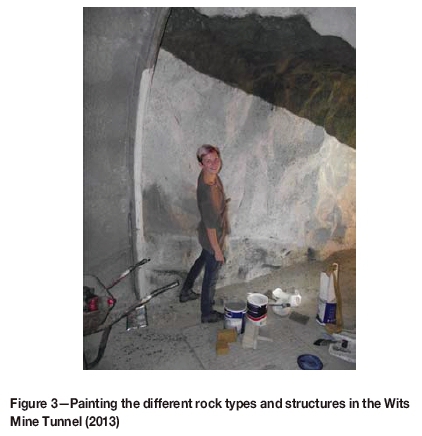
The design portrays the rock types found in the Upper Critical Zone of the Bushveld Complex. These include dark grey/black to represent the melanocratic chromite-rich layers, light blue-grey to represent the leucocratic layers like anorthosite, and browns to represent the pyroxenite and norite layers. A fault is visible in two portions of the tunnel (the main portion as well as a spur). A dyke is also visible and is painted black.
There is no intersection visible between the fault and the dyke (it would occur in the portion of the tunnel where sets are installed). The age relationship between the dyke and the fault is thus open to interpretation and can really be determined only when the borehole information is included in the analysis. Students need to interpret the movement on the fault and determine if it is a normal or a reverse fault. Most students interpret the fault in the main portion of the tunnel correctly as a reverse fault and then get confused because in the spur it appears to be a normal fault. It is only after detailed inspection of the colours of the layer do they realize the one layer is darker than the other, and then they correctly interpret it as the same reverse fault as observed in the main portion of the tunnel.
Geological modelling
A geological model is a computerized representation of lithological, structural, geochemical, geophysical, and diamond drill-hole data on and below the Earth's surface (Fallara, Legault, and Rabeau, 2006). Geological models for sub-surface interpretation are generally based on limited data. They simplify complex environments and give scientists the ability to visualize interactively the interpretation of the subsurface geology. The application of geological models to mining enables the prediction of the presence, tenor, and spatial position of potentially economic mineralization. These predictions involve risk and require decision-making (Hodkiewicz, 2012).
An understanding of the potential, as well as limitations, of geological models is considered important in the Advanced Mineral Resource Management programme and thus the Geological Modelling module was created in 2012. Suitable software was required for the practical component of the module and Leapfrog Geo agreed to provide the software, as well as training for the delegates in the basic use of the program.
Traditional models (also referred to as explicit models) are created using wireframes based on the geological logging of boreholes. This type of modelling is time-consuming and a good understanding of the geology is needed for it to be effective. In this type of model, strings link the borehole intersections with the orebody. Implicit geological modelling, on the other hand, is a technique that uses a radial basis function to establish and update geological models relatively quickly and efficiently from borehole data, outcrop data, manually interpreted vertical or horizontal sections, and structural data. The radial basis function allows scattered 3D data-points to be described by a single mathematical function. Models can be isotropic, meaning without any trends or anisotropic, where there is a distinctive directional bias. Once anisotropy is identified from the data, this may be introduced into the modelling process. The implicit modelling process can also automatically split the model into fault blocks with the fault positions included in the data. Assays and any coded drill-hole data, such as lithology and alteration, can be interpolated (Hodkiewicz, 2012). Leapfrog Geo software is an example of this new approach to geological modelling. Implicit modelling is gaining acceptance in the industry, although it is important not to treat the software as a 'black box' and to constantly review and manually edit the computer-generated model (Birch, 2014).
Geological Modelling module
The Advanced MRM Geological Modelling (MRM 5) (Wits Enterprise, 2017) course commences with the students examining the geological information that is available for use in compiling the computer-generated geological models. Traditional methods of geological modelling are considered, and the advantages of using computer-generated geological models are debated.
The aim of this course is to:
-
Provide a theoretical basis for ensuring that the geological orebody model used is representative of the orebody from which it was derived
-
Ensure congruency between all types of geoscientific information used in the compilation of the geological orebody model
-
Understand the geological modelling work flow
-
Highlight and emphasize the importance of the orebody model and the role of geological input in maintaining the credibility of the model
-
Link the geological model back to the South African Code for the Reporting of Exploration Results, Mineral Resources and Mineral Reserves (the SAMREC Code) and understand the importance of compliant reporting.
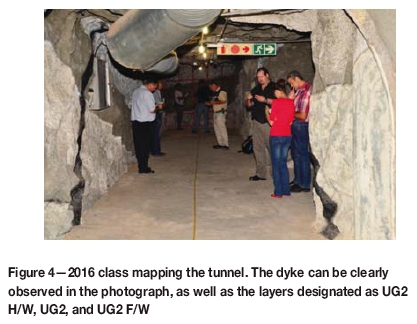
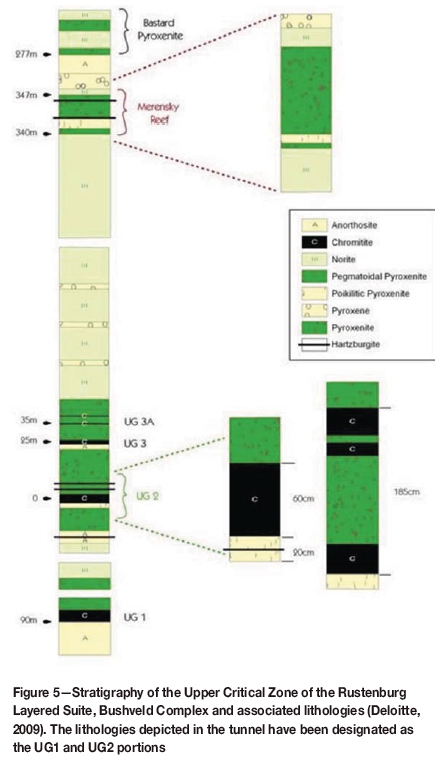
The assessment of the module is weighted 70% for the examinaton and 30% for the assignment. The assignment is conducted in two phases. The first phase is a practical geological mapping exercise conducted by the students in the Wits Mine Tunnel (Figure 4). The second phase is done by the students in their own time and requires the validation and correction of the supplied borehole database, selecting an appropriate modelling method using Leapfrog Geo (Leapfrog, 2017b), and linking the 3D model derived from the borehole data with the observations from the tunnel. The students are also required to link the simulated lithologies in the tunnel and borehole database with the types of lithologies that one would expect in the Upper Critical Zone of the Rustenburg Layered Suite in both the eastern and western limbs of the Bushveld Complex (Figure 5). The simulated stratigraphy presented in the borehole database and tunnel has been designated as the UG1 and UG2 layers. They are, however, a very loose representation of how these particular layers would appear realistically (for instance, the stratigraphic separation between the UG1 and UG2 is far greater than is depicted in the tunnel.
The Wits Mine Tunnel has been the venue for the mapping component for the 2014, 2016, and 2017 Geological Modelling module (the course was not run in 2015). Prior to 2014, a generic model representing Merensky Reef stratigraphy was utilized, where the students were supplied with a borehole database as well as a surface map. There was no practical mapping exercise.
Geological modelling assignment
Mapping exercise
Students are expected to record the relationships between the stratigraphic layering, dyke, and fault and gather sufficient information to ensure that the computer-generated model derived from the supplied borehole data is consistent with what can be observed in the tunnel. Sketches, as well as photographs of the various features, are required to be included in the assignment report. A 60 m soft tape is used as a reference and a clinorule is supplied to measure dip angles. For many of the students on the module, this is their first experience in recording geological information. Most of the students have experience of the underground environment and are familiar with the concepts of dip and strike. Discussions about concepts like true stratigraphic thickness and apparent dip take place during the mapping exercise.
Modelling exercise
The practical assignment is based on a borehole data-set of simulated Upper Critical Zone data supplied by Leapfrog South Africa. The database was created specifically for the module and includes 24 boreholes. The simulated stratigraphy includes:
-
UG2 hangingwall
-
UG2 A
-
UG2 B
-
UG2 footwall
-
UG1 hangingwall
-
UG1
-
UG1 footwall.
Fault and dyke intersections are included in the borehole logs. Leapfrog South Africa also modified the data-set to include some obvious and some not so obvious data errors. The students are required to validate the data and produce a geological model. The Leapfrog Geo software has a built-in data validation tool which identifies missing information from the supplied borehole files (collars, survey, and geology). For example, one borehole does not have a collar file and thus cannot be located in 3D space. There are also inconsistencies between the maximum depths in the collar file and the geology file and overlaps between sections in the geology file. What the validation tool does not identify is that one of the collar files has an incorrect elevation and one survey file has an incorrect depth. A stratigraphic intersection thickness in one of the borehole files is very unrealistic compared to the same layer in the other boreholes. Effects like faults causing duplication of strata are covered by the course, and so the relationship between this abnormal thickness and known faulting is discussed. These types of errors can be identified only by visualizing the borehole traces in 3D space.
A large portion of the focus of the course is related to validating databases and ensuring only clean data is used for creating the geological models. Errors in data, as well as identifying poor quality sampling and reviewing the QA/QC processes, are extensively covered during the theoretical portion of the course. Thus the students are required to keep detailed notes during their data validation exercise, report on all the errors identified, and explain how these were rectified.
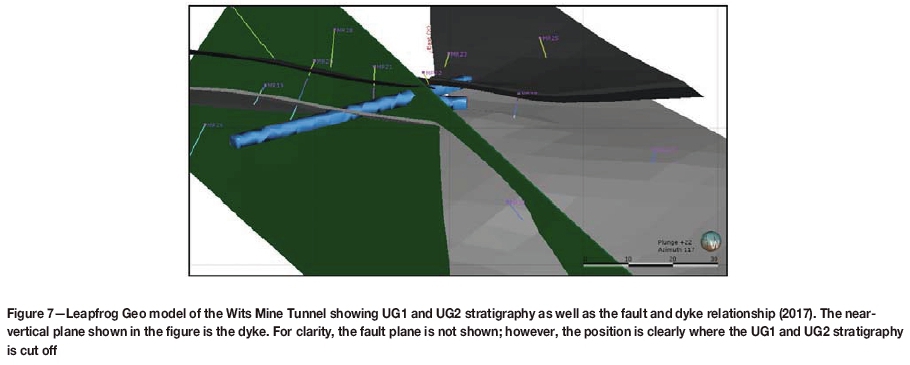
The model can be created using two broad modelling techniques - modelling the stratigraphic contact surfaces individually or modelling the stratigraphic units as a single set. Students are encouraged to experiment with these methods as well as to try different age relationships between the stratigraphic units, fault, and dyke. Ultimately, the aim is to create a model that was broadly consistent with the observations made in the tunnel (Figures 6 and 7).
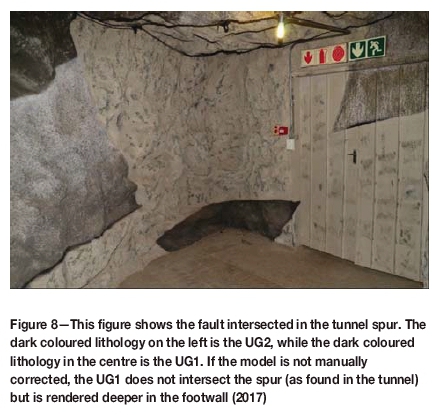
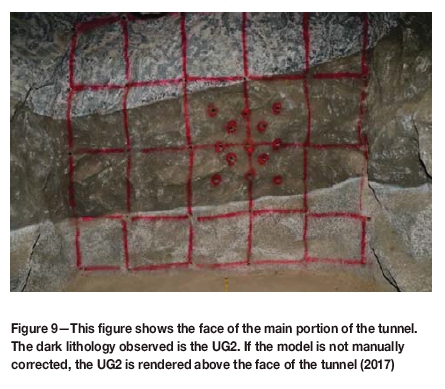
Finally, students are required to make manual adjustments to the lithological contacts to concur with the observations made during the mapping exercise. The two obvious corrections that are required are shown in Figures 8 and 9.
The students are required to save their final models in the Leapfrog Visualizer format and send this together with their reports for assessment. The models are assessed for accuracy compared to the observations in the tunnel, as well to ensure that all the database errors were noted and corrected. The age relationship between the stratigraphy, dyke, and fault is also considered.
Observations
The use of the Wits Mine Tunnel allows the students to do their own geological mapping. Prior to 2014 there was no practical mapping component for this particular course. The tunnel has allowed students to gain a greater appreciation of how geologists do geological mapping and gather the information required to create valid geological models. The implicit modelling method utilized by Leapfrog Geo is fast and simple, but even a simple model like the one created by the students for this exercise does not represent the identified geology perfectly. There is thus a greater appreciation of the limitations of this type of modelling and the need for manual interventions to force the model to honour the observations made in the tunnel.
Generally, the models received from the students are broadly correct (see Table I for a summary of performance). Some students failed to identify all the errors in the database, leading to some strange elements in their submitted models. In the 2017 class, all the students failed to adjust their models adequately to honour their mapping in the tunnel, while most of the students in the 2014 and 2016 classes did so. Changes to the Leapfrog Geo software have made this type of manipulation a multi-step process and this appears to have confused the students.
The feedback from the students based on their course review has indicated that the best part of the course was the practical modelling using the Leapfrog Geo software. Some students specifically commented on the tunnel mapping exercise as an enjoyable and valuable aspect of the course.
The pass rate for the Geological Modelling assignment ranges from 67% to 88% for the period that the tunnel has been the assignment topic. In 2014, fewer students passed the assignment than passed the course overall. This trend reversed in 2016 and 2017, where more students passed the assignment than the overall course.
Conclusions
The Wits Mine Tunnel was created in 2012/2013 to allow research and teaching to take place in a simulated underground environment in the School of Mining Engineering at the University of the Witwatersrand. The tunnel is part of a complex that includes a mine stope, rescue chamber, and lamp room and is is linked to a control room that forms part of the DigiMine Project (University of the Witwatersrand, 2015). This tunnel has been used for the Advanced MRM Geological Modelling (MRM 5) course in 2014, 2016, and 2017. The students map the tunnel and the mapping is combined with a borehole database for the students' assignment. They are required to use Leapfrog Geo software to create a 3D geological model and ensure that it is an accurate representation of the geology observed in the tunnel.
Mock-ups of the mining environment are not unique to the University of the Witwatersrand and are found in training centres around the mining industry. There are, however, no other examples noted where the geological information presented in the mock-up has been linked to digital information. This linking has given the students the opportunity to gather their own geological information to understand the full process of creating geological models. Students have been very positive about the learning experience and this type of learning is considered very beneficial to them. The mock-up is accessible without any special logistical requirements, meaning it can be easily accessed and simulated underground teaching takes place in a well-ventilated, cool, and safe environment.
References
Birch, C. 2014. New systems for geological modelling-black box or best practice? Journal of the Southern African Institute of Mining and Metallurgy, vol. 114, no. 12. pp. 993-1000. [ Links ]
Cirda Minerals Processing. 2007. Education and training in mining. https://www.mining-technology.com/contractors/project/murray_roberts/pressreleases/press25/ [accessed November 2017]. [ Links ]
Deloitte. 2009. Technical report: Lebowa Platinum Mine, Limpopo Province, South Africa. https://wvww.sec.gov/Archives/edgar/data/1028277/00011931251 1020420/dex994.htm [accessed November 2017]. [ Links ]
Engineering News. 2016. New Wits Mining Institute to focus on innovation. http://www.engineeringnews.co.za/article/new-wits-mining-institute-to-focus-on-innovation-2016-06-30 [accessed November 2017]. [ Links ]
Fallara, F., Legault, M., and Rabeau, O. 2006. 3-D Integrated geological modeling in the Abitibi Subprovince (Quebec, Canada): Techniques and applications. Exploration and Mining Geology, vol. 15, no. 1-2. pp. 27-41. [ Links ]
Geological Society of South Africa. 2017. GSSA 3D Geomodelling Workshop. https://gssaconferences.co.za/3d-geomodelling/ [Accessed November 2017]. [ Links ]
Hodkiewicz, P. 2012. Leapfrog: new software for faster and better 3D geological modelling. https://www.leapfrog3d.com/__data/assets/pdf_file/0017/539/new-software-for-faster-and-better-3d-geological-modelling.pdf [Accessed June 2013]. [ Links ]
Leapfrog. 2017a. Training calendar. http://www.leapfrog3d.com/training-and-support/training/training-calendar [Accessed November 2017]. [ Links ]
Leapfrog, 2017b. Leapfrog Geo. http://www.leapfrog3d.com/products/leapfrog-geo [accessed November 2017]. [ Links ]
Murray & Roberts Cementation. 2007. Innovative training facility established for the mining industry. http://www.cementation.murrob.com/news_pr_2007-05-01a.asp [Accessed November 2017]. [ Links ]
Council for Geoscience. 2000. Bushveld Complex, South Africa - Simplified geology and selected platinum, chromite and vanadium deposits. http://www.geoscience.org.za/images/Maps/bushveldcomplex.gif [accessed November 2017]. [ Links ]
Council for Geoscience. 2017. Downloadable material. http://www.geoscience.org.za/index.php/publication/downloadable-material [ Links ]
SRK Consulting. 2017. Elements of structural geology for geological modelling course. https://www.srk.co.za/en/landing/la-elements-structural-geology-geological-modelling-course [accessed November 2017]. [ Links ]
University of the Witwatersrand. 2015. Accelerating digital mines. https://www.wits.ac.za/news/latest-news/general-news/2015/2015-06/accelerating-digital-mines.html [accessed November 2017]. [ Links ]
Wits Enterprise. 2017. MRM 5 - Geological orebody modelling. http://wits-enterprise.co.za/c/mrm-5-geological-orebody-modelling [accessed December 2017]. [ Links ] ♦
This paper was first presented at the Society of Mining Professors 6th Regional Conference 2018, 12–13 March 2018, Birchwood Hotel and Conference Centre, Johannesburg, South Africa.

