


Services on Demand
Article
 English (pdf)
 Article in xml format
 Article references
Indicators

Related links
-
 Cited by Google
 -
 Similars in Google
Share

 Permalink
Journal of the Southern African Institute of Mining and Metallurgy
On-line version ISSN 2411-9717
Print version ISSN 2225-6253
J. S. Afr. Inst. Min. Metall. vol.118 n.8 Johannesburg Aug. 2018
http://dx.doi.org/10.17159/2411-9717/2018/v118n8a1
SOCIETY OF MINING PROFESSORS 6TH REGIONAL CONFERENCE
The costs of sampling errors and bias to the mining industry
R.C.A. Minnitt
School of Mining Engineering, University of the Witwatersrand, South Africa
SYNOPSIS
South Africa's mineral commodities generate approximately R420 billion per annum from export earnings. Of that amount coal (28.1%), gold (15.2%), iron ore (14.5%), and platinum (21.7%) account for 80%, and together with chrome and manganese account for 88% of the earnings. Payment for these products is based on the metal content, and in the case of coal, the energy content. Traders rely on the analytical results from samples of the products to obtain a fair price and true value of the sale. This paper covers three main issues. Firstly, the thrust of interest in sampling of particulate materials is shown to be primarily due to the financial implications of poor sampling and the vibrant trade in these mineral and metal products in the USA between the 1850s and 1940s. The importance of correct engineering for cutter operation and good maintenance of cutters in general in the sampling of bulk commodities is emphasised. Secondly, simulation of a low-grade iron ore deposit demonstrates that the principal offending factor in sampling events is the sampling bias, rather than the sampling error. Whereas sampling error may account for as little as 0.0016% error in the mean grade, sampling bias, which can be positive or negative, may affect the mean grade by as much as 10%. Thirdly, the contribution of individual particles of iron ore, particularly those in the larger fractions of the size distribution, is investigated. Relatively small changes in mean grade of about 0.106 %Fe can result in losses to the supplier of about US$11 600 per 100 000 t shipment of iron ore, a substantial amount of nearly seven million dollars per annum. Together the three aspects, principles of correct cutter operation, the effects of bias on the mean grade of samples, and the effect of size distribution on sample extraction error, contribute to potential financial losses in the bulk commodities trade.
Keywords: sampling, error, bias, uncertainty.
Introduction
The theory and practice of particulate sampling grew out of the need for accurate assays of the grades of ores, concentrates, and coals that were traded in the mining areas of the USA and UK in the period between 1850 and 1930. The origins of sampling theory and practice are deeply embedded in the financial implications associated with sampling and follow-up trading of ores and concentrates. In fact, so prolific were the authors and writers about the issues involving the sampling of ores and concentrates that Sharwood and von Bernewitz (1922) from the US Bureau of Mines compiled a list of 906 pieces of literature on sampling up to July 1921. Some of the more famous sampling and blending authors of the time were Reed (1882), Brunton (1895), Hofman (1899), Warwick (1903), Rickard (1907), Richards (1908), Argall (1912), Woodbridge (1916), Pulsifer (1920), and Taggart (1927). Records indicate that the principal exponent of practical sampling was Henry Vezin, who apart from newspaper articles, wrote very little himself, but as early as 1850 had designed and published diagrams of his rotary sampler (Rawle, 2017). Vezin's outstanding design implies that he understood, even at this early stage, the principles of probabilistic sampling.. Although he never published it, Vezin's outstanding splitter design, examples of which are shown in Figure 1a and 1b, implies he understood, even at this early stage, the principles of probabilistic sampling, namely 'each and every fragment must have the same statistical opportunity as every other fragment of being in the sample'.

Table 2 in Volume 2 of Richards' 'Ore Dressing' (Richards, 1907, p. 850), extract shown below, provides a minimum mass calculation that he attributes to Vezin (1866), but which may have originated with Hofman (1899), a professor from Massachusetts Institute of Technology (MIT) (Rawle, 2017).
According to Rawle (2017), the superscript 14 next to Vezin's name refers to Hofman (1899), who in fact did not mention Vezin's name in the text.
The table quoted by Richards (1908) and attributed to Vezin provides data for sample mass and fragment size, which plots as a power curve with the equation as shown in Figure 2a, or alternatively, as a straight line on a log-log graph paper with an equation as shown in Figure 2b.
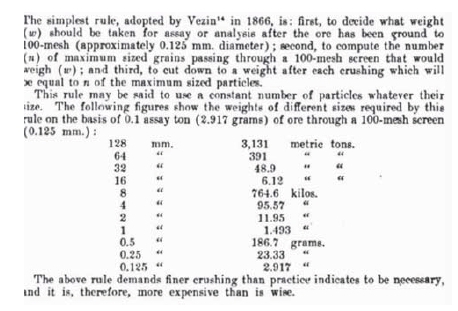
These data indicates that at an early stage (ca. 1866) Vezin had shown that the sample mass and the cube of the fragment size were related. Richards (1908) suggested the masses generated by Vezin's formula were too large, and arbitrarily changed the factor for fragment size in the equation in Figure 1a to  , although he provided no scientific grounds for doing so, a change that some have suggested set the science of sampling back 50 years. It was not until the 1950s that Pierre Gy set the record straight, restoring the factor to dN. Unfortunately, Vezin never published much of his research and it was left to Warwick (1903) to pull his work together in an excellent volume, entitled 'Notes on Sampling, after Vezin's death.
The following extract from Chapter 5, entitled 'Receiving, sampling, and purchasing on page 45 of Hofman's 1899 publication, refers specifically to the trade in gold- and silver-bearing ores (Rawle, 2017).
This extract from Hofman's document clearly illustrates that early authors understood that accurate assay values depend on a relationship between the size of ore fragments and the mass of the sample. Vezin's donation of his notes, reports, and calculations recorded in the Mining Reporter, Denver, Colorado of October 1901, was written up in eighteen parts and reported in the local newspaper by Arthur Warwick (Rawle, 2017). A further extract from 'Notes on Sampling, Warwick's (1903) compilation of Vezin's work, illustrates the scale of mining- and mineral-related financial transactions taking place in Colorado at the end of the 19th century.
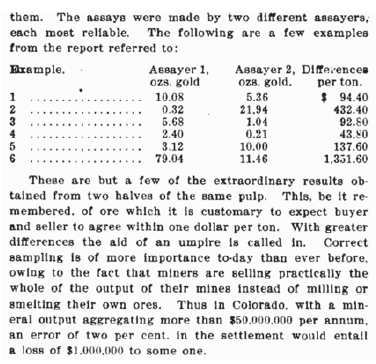
This also shows that the extensive research into sampling issues at the turn of the 19th century was motivated by the need to understand the scale of the losses that one or other partner would potentially face because of poor sampling practice. What these authors did not specify is the source of the errors. This paper aims to examine the effects of sampling errors and sampling bias on assays of traded commodities, and consequently the potentially incorrect payments to producers.
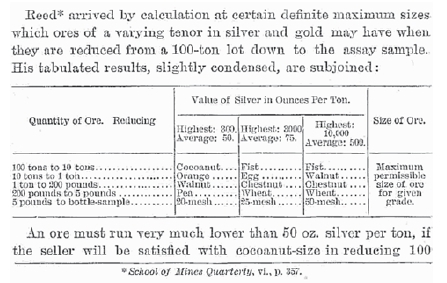
From a detailed historical investigation of the origins of sampling, Rawle (2017) concluded that sampling theory arose from two papers published by Reed (1882, 1885) in the Columbia School of Mines Quarterly. Reed's 1882 publication, 'Ore sampling is a key document in which he explained that the minimum sample mass is proportional to the cube of the nominal fragment top-size. He apparently quotes David Brunton on this matter, but without reference to his publications. Although there is no record of published work earlier than 1895, Brunton (1895) later wrote about the theory and practical aspects of sampling. Brunton made the astute observation that to be equally reliable two samples of a same material should be made of the same number of fragments, irrespective of the top particle size.'
Perhaps the first person to expound an equation for the variances of what is now known as the Fundamental Sampling Error was Robert Richards (1908), who published the 'Ore Dressing volumes, which are regarded as the de facto mining publications. Vezin, Brunton, and Richards all knew one another and met on a number of occasions (Rawle, 2017). Vezin outlined a calculation very early on (maybe even in the 1860s) based on a simple statistical analysis of a minimum of 10 000 particles needed in the 99th percentile of the size distribution. In the 1880s, Reed published a similar analysis that was used by Hofman (1901), and subsequently Richards (1908).
Nature of sampling errors
The historical background tells firstly of the huge body of research that had taken place up to the early 1950s, when Pierre Gy dedicated himself to a study of the sampling of particulate materials, and secondly, that this research was driven by financial concerns. Accordingly, Gy (2004) honed the issues around sampling into what is called the Theory of Sampling (TOS) from the 1950s onward, and particularly in the 1970s when his work started to appear in English.
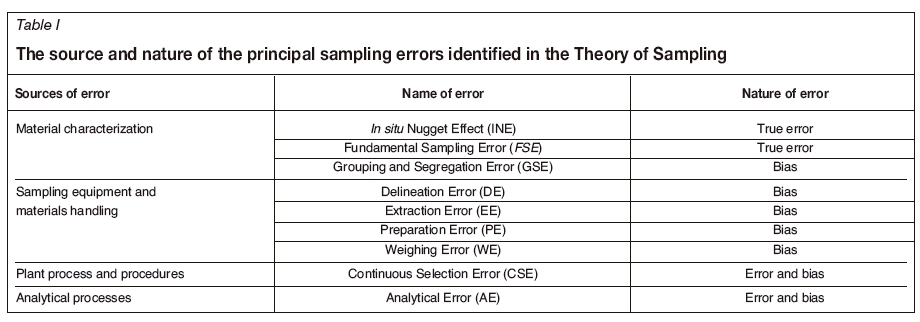
Gy (1953, 1967, 1976, 1979) was among the first researchers to name the different types of sampling errors and to identify the locations at which these errors were generated in the mining value chain. Gy's earliest taxonomy of sampling errors was simple, the source and nature of the sampling errors essential to an understanding of the financial implications of trusting a sample value being shown in Table I. The sources of sampling errors are categorized into four groups that deal firstly with the nature of the materials being sampled; secondly, the sampling equipment and materials handling; thirdly, the processes and procedures in the plant; and fourthly, with the analytical processes. This shows that sampling errors of the same or different types may occur at a number of different localities along the mining value chain. While some sampling errors arise predominantly in the early stages of the mining value chain, the same errors may re-occur later on at a different locality if the source and nature of such errors is not identified. For example, the Delimitation Error and Extraction Errors may occur during exploration, mine development, during grade control, and in the analytical laboratory (Pitard, 2006). Very often the sampling errors at different locations along the mining value chain vary in scale, rather than by type. Consequently, Delimitation and Extraction Errors at the exploration or mine development stages involve hundreds of tons of material, but these errors can also occur in the analytical laboratory where only a few tens of grams of material are being handled. Only the sampling errors associated with the materials themselves and those generated by materials handling are considered in this paper.
In a statistical sense, a sample is usually a small representative proportion of the lot, the total population. The information content of a single sample is small in that it provides a best, unbiased estimate of the mean value of the lot. In fact, the sample extraction process may have resulted in a biased sample, but this would never be known. Only when two or more, preferably many more, samples are assayed may it be possible to obtain a better estimate of the mean and begin to calculate the variability associated with these samples. Samples should bear the principal characteristic that they are representative of the lot from which they are drawn, and if representative, they are by definition unbiased. Furthermore, only correct samples, obeying the principle that every fragment in the lot should have an equal opportunity of being included in the sample, can be unbiased. Only samples that are collected according to an optimized sampling protocol will be representative. It is important not lose sight of the fact that samples are a first step in an investigation into the mean value for one or other characteristic of the population, the lot. Consideration of the spatial and directional reach of a sample value is important to sampling, but it is fundamental to the discipline of geostatistics. Sampling a stockpile by taking replicate samples over the surface of the pile will provide a more representative estimate if the footprint of the area within which samples are selected is bigger. Sampling a bigger area means the reach of the samples, the spatial influence of each sample, is extended. Samples extracted from flowing material streams, such as crushed ore on a conveyor belt, or leachate flowing in a launder of a hydrometallurgical process, are linearly separated in time and space. The space between samples and the size of the sample collected are crucial to obtaining an accurate estimate of the mean of the parent lot, the behaviour of the input material, and the ability of the plant to produce a product to customer specifications.
Sampling errors
Sampling errors arise because of both the constitutional and distributional heterogeneity of materials, broadly referred to as the materialization errors (Gy, 1967, 1979; Pitard, 1993). Three types of sampling errors arising from this heterogeneity have been defined, namely the In situ Nugget Effect (INE), the Fundamental Sampling Error (FSE), and the Grouping and Segregation Error (GSE).
In situ Nugget Effect
Pitard (2006) is the main proponent of the In situ Nugget Effect, the error arising from the presence or absence of gold nuggets in a piece of borehole core from a mineralized zone. Depending on the nature of the mineralization, nuggets may or may not be present. Solid gold nuggets may be up to several millimetres in diameter (in some cases much bigger). In some cases fine gold grains, about 50-70 ¡im in diameter, aggregate together to form nuggets up to 1000 ¡im in diameter. Such nuggets produce extreme variability in gold assay values from one drill-hole to the next. The INE can be reduced by increasing the diameter of the drill core.
Fundamental Sampling Error
The formula devised by Gy as early as 1952-1953 is given in Equation [1]. It relates the FSE to an ore-type-specific coefficient K, the diameter of the fragment size raised to the third power (dN), and inversely to the mass of the sample (MS).
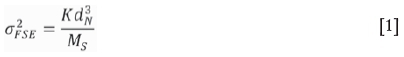
While it is clear that the FSE is inversely proportional to the mass (MS) of the sample, and hence can be controlled by the mass of the sample or the number of samples, as indicated in Equation [2], it also depends on how the mass is constituted.
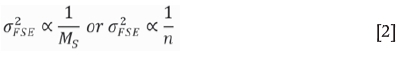
MS may represent a single, large sample, or it could represent a large number of small increments, n, composited to make up the sample. The FSE is an error variance in units of the analyte of interest.
The FSE arises from within-fragment and between-fragment variations in grain size, particle size, mineralogical composition or mineral constituents, density of the fragments, amount of gangue, and metal content from one fragment to the next. No matter how many samples are assayed, the results are always different from one another because of constitutional heterogeneity and the fact that only a portion of, and not the whole of, the population is sampled.
The FSE can be reduced to a minimum, but can never be eliminated. Oddly enough, it can also be calculated before the sample is taken, provided heterogeneity tests and essential material characterization have been carried out. Percentage precision, without any reference to units, is the coefficient of variation (standard deviation divided by the mean, multiplied by 100) used to compare one set of analyses with another. The parameters in the formula devised by Gy (1953, 1967) for the FSE indicate that larger sample masses, and in particular a reduction of fragment size, will improve the precision of the assays. The only way to ensure that the FSE is minimized is to ensure that the primary sample is collected according to the strict principles of the Theory of Sampling.
Grouping and Segregation Error
The Grouping and Segregation Error, another material-related source of error, arises from the tendency for grains or fragments of ore containing very dense target analytes to group under gravity and consequently segregate from the bulk of the ore. The behaviour of very dense fragments under gravity is much like that of a shoal of fish, which although not physically connected, segregates and moves under natural instinct as a group in water. A net thrown into a shoal will produce a catch - a strongly biased, non-representative distribution of fish in the ocean, as will a net that catches no fish. Sampling of strongly segregated particulate materials is typically clustered sampling in which groups of fragments (clusters) are extracted at random. The size of the clusters is critically important when sampling for genetically modified organisms (GMOs) in shipments of grain. If the clusters differ significantly in composition with respect to the target analyte due to the Grouping and Segregation Error, this can result in non-representative sampling. This so-called Grouping and Segregation Error (GSE) can be reduced during sampling processes, firstly by homogenizing the lot, and secondly by collecting and compositing numerous small increments rather than taking a single large sample. The principle of compositing numerous increments was well understood as early as 1882 by Reed (1882), who designed a shovel that could extract small increments from a lot.
While there are equations that relate the Grouping and Segregation Error to segregation and grouping coefficients, it is not possible to calculate the error, because the size of the error is transient and changes from one moment to another. It is, however, possible to identify, measure, and mitigate its overall contribution to particulate segregation and the distributional heterogeneity.
Sampling bias
Whereas sampling errors, namely the INE, FSE, and GSE, are due to variability in material composition or constitutional heterogeneity, sampling bias arises from materials handling, sampling equipment, and specifically interactions at the interface between the steel1 of the sampling tools and the broken ores. Biased sampling occurs when certain particles within the lot, due to their size, shape, density, or moisture content, are consistently favoured over others during the sampling process; the contribution to sampling bias due to weighing and moisture determinations is not considered in this discussion. This means that not every fragment has the same statistical chance of being in the sample. Sampling bias can be engineered out of sampling equipment provided that two principles, namely the Principle of Symmetry and the Principle of the Centre of Gravity (CoG), are upheld (Pitard, 1993). The Principle of Symmetry requires that the interaction of the steel of sampling equipment with fragments is exactly the same as it enters and exits the flowing stream of material. Sampling tools with thick walls (Figure 3a) and angles that are not steep enough (Figure 3b) are likely to introduce a bias. Good sampling cutter designs have sharp edges and angles with a≥ 70° as shown in the good design of Figure 3b.

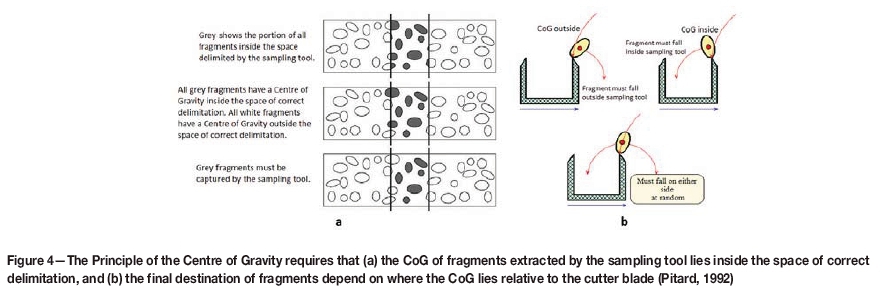
The Principle of the Centre of Gravity requires that fragments whose centre of gravity lies within the sampling tool must be included in the sample, whereas those whose centre of gravity lies outside the tool must not be part of the sample, as illustrated in Figure 4 (Pitard, 1992).
Sampling of bulk commodities such as iron ore, manganese, chromite, bauxite, limestone, and coal for commercial purposes or monitoring of processes that use these products, is standard practice in industry. A video documentary entitled 'Sampling of Bulk Commodities, Design and Operation of Sample Cutters' compiled and produced by Robinson and Holmes (1990) at the Commonwealth Scientific and Industrial Research Organisation (CSIRO), Australia describes nine necessary conditions for sample cutters to provide unbiased samples. The principle for cutters to deliver unbiased samples is that 'all particles should have an equal chance of being sampled' (0:01:10). The documentary examines the performance of sample cutters for bulk commodities and provides advice regarding cutter designs based on the work of Gy (1979).
Robinson and Holmes (1990) examined many types of sampling equipment used to sample flowing streams of material on a conveyor belt. Cross-stream cutters located at the end of a conveyor belt, where the cutter intersects the falling stream of material, are generally considered the most efficient and unbiased equipment. Cross-belt cutters intersect the material on the conveyor at some point along the length of the belt. Continuous research into cutter shapes and the angle at which the cutter intersects the moving stream of material has led to considerable improvement in the performance of cross-belt cutters. However, they suffer from the limitation that the material closest to the conveyor belt is generally under-sampled, and generally they are not highly recommended (Robinson and Holmes, 1990).
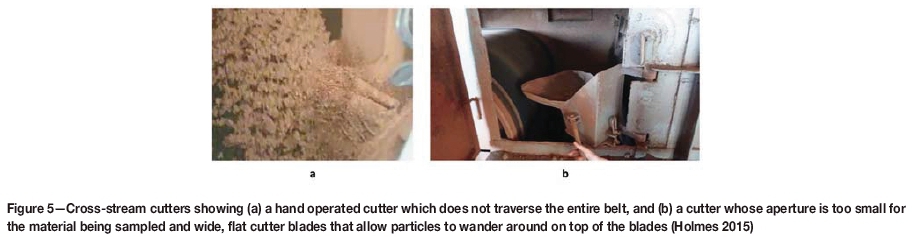
Robinson and Holmes (1990) described nine necessary conditions for cutters to be unbiased, some of which relate to cutter design and others to cutter performance. The basic principle of correct sampling requires that when the cutter moves through the stream of particles, it must intersect the entire stream rather than just a portion of the stream. The cutter in Figure 5a is too far forward, and does not appear to cut the entire stream, meaning the back of the stream is inadequately sampled. Adequately powered motors or hydraulic mechanisms able to drive the cutter through the moving stream at a constant speed are essential. Biased samples arise from hand-operated cutters as like shown in Figure 5b, because they cannot provide an even cut of the stream, nor does the cutter blade intersect the entire stream of particles.
Changes in the speed of the cutter as it moves through the stream during the sampling could introduce a bias. The highly abrasive environment in which the equipment operates means that cutter blades are subject to wear, so regular maintenance is required to ensure that the edges of the blades are sharp and straight. Wear and abrasion along the lips of the cutter could mean the size of the opening varies along the length of the cutter, being wider in the middle than it is at the ends. As a result, material along the centre of the stream is likely to be over-represented. An important aspect of cutter design is that the cutter must have sufficient capacity to hold all the material it extracts during a single traverse across the stream. The capacity of the cross-stream sampler shown in Figure 6a is too small, with the result that sample material falls out of the sampler onto the incoming stream once it has passed through the stream.
Loss of material from an overflowing cutter means the extracted sample cannot be correct or representative; it is biased. Losses of material from the sample, or extraneous additions of built-up material on the cutter blades, as shown in Figure 6b, mean samples will be either under-weight or contaminated. Cutter openings must be sufficiently wide that all particles have the opportunity of entering the sample cutter, and not as shown in Figures 5a and 6b. Gy (1979) suggested that cutter openings be at least three times larger than the nominal top size or the largest particle in the flowing stream. Where this is not the case, the largest particles interacting with one another at the cutter aperture could prevent other particles from entering the cutter. If the cutter aperture is too narrow, there is a possibility that larger particles could hit one cutter blade and bounce over the other blade, so that larger particles are under-represented. For cross-stream cutters it is essential that the cutter blades are at right angles to the trajectory of the falling stream. If the angle of the cutter blades to that of the incoming stream is small, large particles that should be included could hit the blades and easily bounce out of the cutter, resulting in a bias in which larger particles are under-represented. According to Van Niekerk (2017, personal communication) the +25 mm fraction of the lot tends to be missed during the sampling procedure. For Vezin samplers, such as those shown in Figure 1, the action is the same as a cross-stream sampler, but the cutter must move at constant speed, i.e. constant angular velocity, and the cutter blades must be radial to the centre of rotation, so that the falling stream is subjected to a constant cutting time irrespective of its position along the cutter. Swing-arm cutters and ramp cutters have openings that are at right angles to the stream and must move at constant velocity through the stream of particles. Significant research by the CSIRO into the size of cutter apertures, the speed of cutters, and the angle at which they intersect the stream, has provided the optimal conditions for cutter operation (Robinson and Holmes, 1990).
The principles for cutter operation in dry materials are essentially the same as for slurries and very moist streams of materials, except that there is no bouncing of the materials. For swing-arm and ramp cutters the bounces of particles are larger when the cutter enters the stream than when it exits. Particles that bounce sideways off cutter blades should not be able to bounce so far that they are not included in the sample (Robinson and Holmes 1990).
The study concluded that the simple aspects of cutter operation, such as routine maintenance, cutting the full stream, sufficiently wide cutter apertures and adequately powered motors are the most important (Robinson and Holmes, 1990). It is possible that uninformed operators could overlook deviations from standard sampling conditions and practices that may cause significant bias. Consequently, it is recommended here that an on-site competent person, who is fully aware of the principles of the Theory of Sampling, observes, audits, and verifies correct cutter operation at individual sampling locations on a regular, even weekly, basis to ensuring that no meaningful bias is introduced into samples.
Sampling uncertainty
Sampling uncertainty has to do with a model of statistical behaviour of sampling assays. Uncertainty can be established only when there is more than one measurement for which a variance can be calculated. Uncertainty defines an estimate of the statistical range within which a sample value could lie with a given level of confidence. The difference between an error and measurement uncertainty lies in the fact that an error is a mistake and implies responsibility, whereas measurement uncertainty implies no responsibility (Pitard, 2006). Uncertainty, an adjective describing an acceptance of a lack of knowledge in some measurements, can be aleatory or epistemic; aleatory uncertainty has to do with chance with no ability to predict the outcome, whereas epistemic uncertainty has to do with knowledge and an ability to predict the outcome. According to Gy (2004), sampling of particulate materials is always an aleatory operation.
Representation of sampling errors and bias
For illustrative purposes, this paper investigates the effect of sampling bias on the grade of iron ore and how such a bias affects the revenues derived from marketing of the product. A full description of the non-conditional Gaussian simulation product in a 1500x1500 m domain2 using normal-score transformations of a parent distribution of the percentage Fe content in iron ores is described in Minnitt (2013, 2017). The iron ore simulations produced in this way constitute the daughter distributions kriged into a 150x150 domain used in this analysis. The 150x150 domain provides a common starting point from which to compare the effect of introducing error and bias to the sampling of the iron ore distribution.
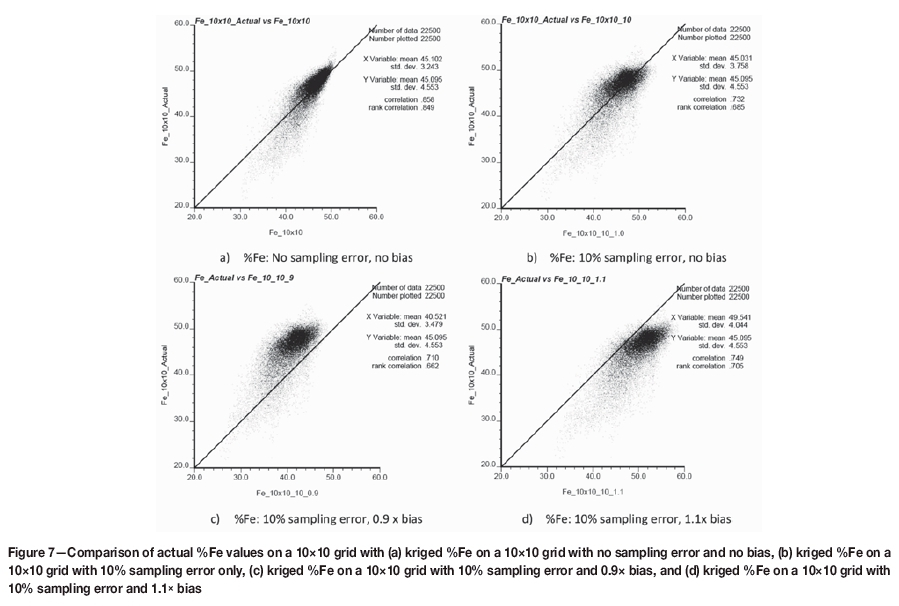
Four sampling events were defined in this study. The first produced a control data-set on a 10x10 grid, where the actual percentage Fe is plotted against the estimated percentage Fe with no error and no bias, as shown in Figure 7a. A second sampling event of the actual percentage Fe on a 10x10 grid is plotted against the estimated percentage Fe including 10% error, but with no bias, as shown in Figure 7b. A third sampling event of the actual percentage Fe on a 10x10 grid included 10% error with a 0.9x bias (Figure 7c), and a fourth event of the actual percentage Fe on a 10x10 grid included 10% error with 1.1x bias, as shown in Figure 7d. Without the influence from poor sampling, the scattergram would be a straight line lying at a small angle to the 45-degree line of the perfect estimator. The effect of the strong negatively skewed the distribution of iron ore grades is evident in the scattergrams (Figures 7a to 7d), causing the tail to extend to the lower left corner of the scattergram.
A comparison of grades of the actual and the kriged percentage Fe data on a 10x10 grid, shown in the scattergram in Figure 8, indicates that there is very good correspondence between the actual and kriged sets of data. Visually, the point cloud for the iron ore estimates is shifted upwards so that the bulk of the values lie slightly higher than the 45-degree line (Figure 8). The mean values differ by 0.007% Fe, while the standard deviation of the actual values tend to be somewhat larger than the kriged values. In the scatterplots in Figures 7a and 8, the actual 10x10 m block values on the y-axis are control data that is compared with the kriged 10x10 m blocks on the x-axis; there is no error or bias in this iron ore data.

As expected, the effect of adding 10% sampling error to the actual percentage Fe grades simply enlarges the point cloud of estimates, as shown in Figure 7b and Figure 9, indicating an increased variability of sample values around the perfect estimator and a negligible effect on the mean percentage Fe grade. Mean grade increases marginally (0.007%) from 45.095 to 45.102% Fe, but a 1.31% decrease in standard deviation from 4.553% Fe to 3.243% Fe is found, due to the smoothing effect commonly associated with ordinary kriging estimates (compare Figures 8 and 9).
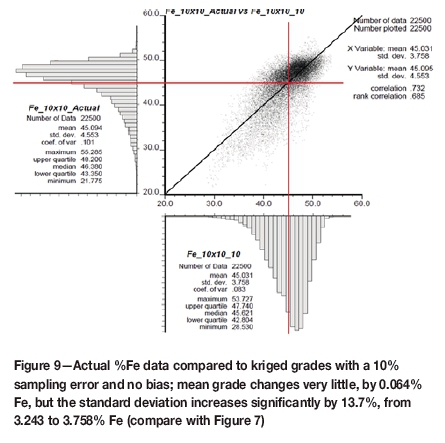
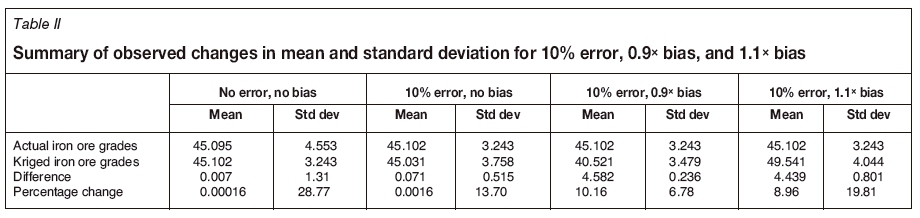
Assume now that the starting points are the ordinary kriged iron ore values with a mean of 45.102% Fe and standard deviation of 3.243% Fe. Introducing a 10% error into the sampling (with no bias) results in a negligible change from the actual to kriged mean value of about 0.0016% Fe. The standard deviation, however, increases from 3.243% to 3.758% Fe, a change of about 13.7% (Table II). This important result indicates that sampling errors arising from changes in constitutional heterogeneity simply expand the point cloud, resulting in greater variability of the grades, but negligible changes in the mean value.
However, when a bias is introduced, the scatterplots indicate that the effect of the bias on the mean value is much more severe than the effect of a 10% error, as is shown in Figures 7c and 7d.
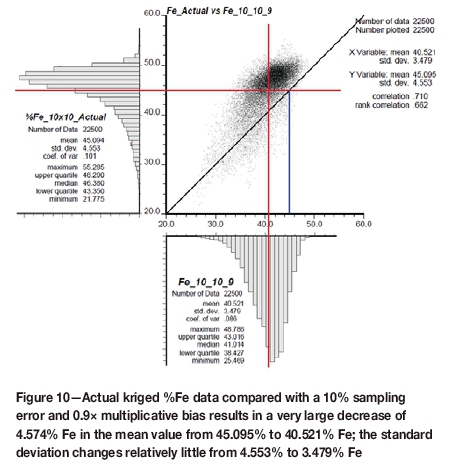
In the case of 10% sampling error plus a 0.9x multiplicative bias (Figures 10 and 7c), the mean decreases by 10.16% from 45.102% Fe to 40.521% Fe, and the standard deviation increases by 6.78% from 3.243 (Figure 9) to 3.479% Fe (Figure 10).
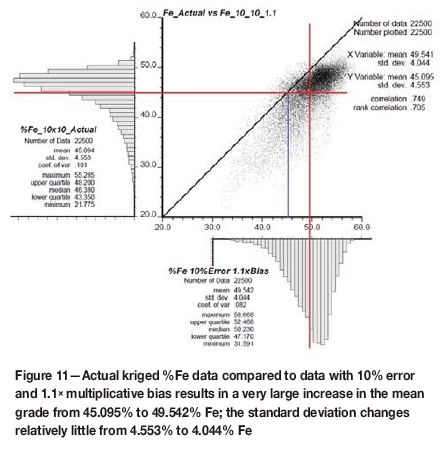
For the sampling error of 10% with a 1.1x multiplicative bias (Figures 7d and 11) the mean increases 9.10% from 45.102% to 49.541% Fe, and the standard deviation increases 19.81% from 3.243% to 4.044% Fe.
With no sampling error and no sampling bias the actual (y-axis) and estimated (x-axis) percentage Fe grades are closely clustered around the 45-degree line - the unbiased estimator. The variation in iron ore grades tends to average out to approximately zero with repeated sampling over time. The change in the spread of the histograms in Figures 10 and 11, because of the introduction of 0.9x and 1.1xmultiplicative bias, is large, changing the mean grade from 40.521% to 49.541% Fe, a difference of approximately 9.10% Fe. Negative sampling bias significantly decreases the mean grade by 10.16%, whereas a positive sampling bias significantly increases the mean grade by 8.96%. These biases are unrealistically high, but they provide an insight into the value-at-risk if biases were that high.
As already emphasized, generating biases this large in the iron ore industry is unlikely, but the example used here provides insight into how biases actually occur and how sampling bias, rather than sampling error, is the chief cause for concern in mineral and commodity trading. This is not to say that the FSE can be ignored, but rather to emphasise that sampling bias is a greater problem than sampling error because bias tends to be cumulative; it does not usually average out, even though it may change from time to time.
Financial impact of sampling error and sampling bias
Sales contracts between buyers and sellers of ores, concentrates, and metal products specify lower limits on grade and upper limits on deleterious elements for which penalties are payable. The financial consequences of systematic biased underestimation of the tailings grade are reported by Carrasco, Carrasco, and Jara (2004) for a tailings dump due for sale to another company. Approximately 96 000 t of tailings, supposedly containing 0.15% Cu but actually containing 0.20% Cu, reported to the dump every day. The bias of 0.05% Cu amounts to 48 t of copper per day, or 17 520 t of copper every year. At a copper price of US $6800 per metric ton, this represents an annual loss of approximately US$120 million (Lachance et al., 2014). Statistical analysis of the sampling procedures and metal accounting systems are shown to provide control measures allowing allocations of gold contributions from different shafts to be established with confidence in the gold mining industry (Bartlett, Korff and Minnitt, 2014).
Iron ore contracts are quoted in US cents and the internationally agreed-upon unit of measure for iron ore pricing is the dry metric ton unit (dmtu). A dmtu consists of 1% of iron (Fe) contained in a ton of ore, excluding moisture. Iron ore is typically sold from South Africa at between 62% Fe and 66% Fe (Otto, 2018, personnel communication), so assuming a price of US$70 per ton for iron ore at a mean grade of 63.805% Fe would make the dmtu price US 109.7 cents per ton. The price per ton is calculated by multiplying the cents per dmtu price by the percentage of iron content, so a 100 000 t shipment of iron ore with a grade of 63.805% Fe should earn the producer or cost the customer about US$7.0190 million. For a 10% sampling error due to variations in the constitutional heterogeneity, the difference in %Fe on a lot with a grade of 63.805% Fe is 0.0016% (column 4, Table II), or 0.102% Fe, resulting in a US$11 230 difference, or 0.00116%, in the value of a 100 000 t shipment. Holmes (2013) indicates that the overall precision for iron ore grade specified in ISO 3082 varies depending on the size of the shipment, and could vary from 0.17 to 0.275% Fe for shipments varying from over 270 000 t to less than 15 000 tonnes, respectively.
For a swing arm (falling stream) cutter sampling iron ore at a nominal top-size of 32 mm with a flow rate of 10 000 t/h, equivalent to 2777 kg/s, at a belt speed of 4.3 m/s there is about 646 kg on each metre of the belt. Cutter speeds and cutter apertures on swing arm cutters vary from 200-800 mm/s and 30-100 mm respectively. These parameters mean that given that the mass of the average increment, given by Mass = (C*A)/(3.6*Vc), where Cis the flow rate of ore in tons per hour, A is the cutter aperture in metres, and Vc is the cutter speed in metres per second, the average primary cut could vary between 104 kg and 1388 kg, (Holmes, 2018, personal communication). The average increment would be about 463 kg every 10 000 t. A typical loading rate for iron ore in some South African facilities is 8 000 t/h with peaks up to 10 000 t/h, meaning a 100 000 t vessel could be loaded in approximately 10 hours (Steinhaus, 2017). When sampling lump ore according to ISO 3082 using minimum parameters, i.e., a loading rate of say 10 000 t/h, a cutter aperture of 100 mm, and a cutter speed of 0.6 m/s the sample would consist of 45 increments of 463 kg, giving a composite sample of about 21 t (Holmes, 2018, personal communication). So every 2222 t we take a 463 kg increment, therefore the sampling rate is 0.21 kg/t.
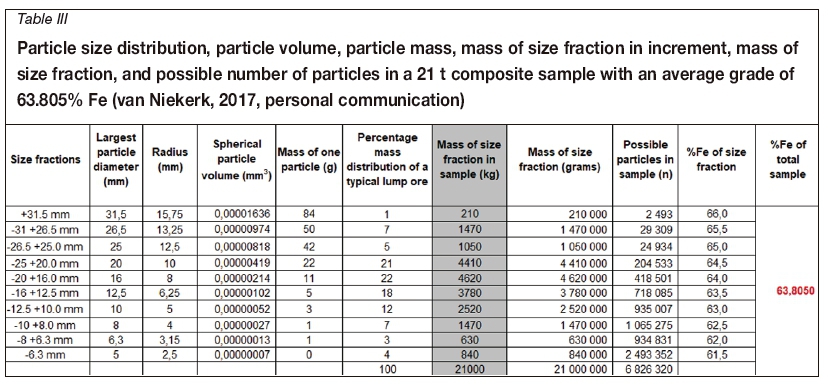
The grade of an iron ore assay is constituted from the contributions of individual fragments in a 21 t composite sample as shown in Table III (van Niekerk, 2017). Using a density of 5.15 g/cm3 the diameter, radius, volume, and mass of a single particle in each individual size fraction is calculated. Using the percentage mass distribution of a typical lumpy ore, the mass of the size fraction in the composite sample can be calculated. Knowing the mass of one fragment, it is possible to calculate the number of particles in each size class. It is well known that the larger fragments of iron ore tend to have higher grades than smaller fragments, so the iron content of each size fraction can be calculated and is aggregated for each size faction (Table III). The cumulative grade for the different size fractions in the 21 t composite sample of ore with a standard particle size distribution as shown in column 7 of Table III, gives an average grade of 63.805% Fe.
According to the most recent (fifth) edition of ISO 3082 (2017) for sampling iron ore, the overall precision at a 95% confidence level varies from 0.34% to 0.55% Fe for shipments from more than 270 000 t to less than 15 000 t, respectively. For a 100 000 t lot, the overall precision is 0.38% Fe as given in the ISO 3082 (2017, Table 1) iron ore standard.
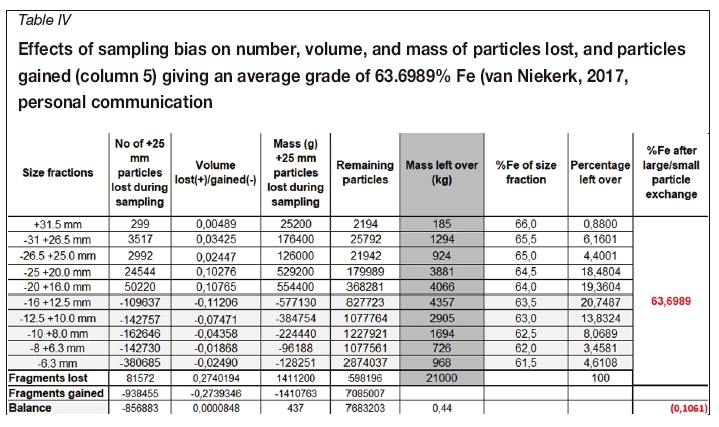
The question is: how easy is it to make an error like this? Assume a 21 t composite iron ore sample having a density of 5.15 g/cm3, and size fractions from -6.3 mm to +31.5 mm, is extracted during loading of a 100 000 t vessel. The following example is hypothetical and one could adjust the figures, but the assumption made here is that poor engineering or lack of maintenance of sampling equipment results in 12% of highgrade fragments, ranging from 20 mm to +31.5 mm, being excluded from the 21 t sample. However, as a corollary, the volume of large particles not collected in the sample means that space is available for an equal volume of small, low-grade particles in the range -6.3 mm to -16 mm to be added to the sample. It is suggested here that the biased sampling equipment creates an exchange mechanism whereby small volumes of the larger high-grade particles sizes excluded from the sample are replaced by an equal (or much smaller) volume of the smaller low-grade particles. Assuming that small, low-grade fragments replace large, high-grade fragments, the overall Fe grade of the sample is reduced from 64.805% to 63.69 %Fe, as indicated in Table IV. That is an exchange of about 6.72% of the large for small fragment sizes in the original 21 t composite sample. The percentage sample mass loss from the 100 000 t shipment is not as important as the loss of mass from the 21 t composite sample itself resulting in a biased sample (Holmes, 2018, personal communication).
According to van Niekerk (2017, personal communication) the +25 mm fraction of the lot tends to be missed during the sampling procedure. Assume further that the percentage of fragments lost from the four largest size fractions (+31.5 mm to +20.0 mm) shown in Table IV is 12%. This results in an exchange of 1411 kg of the larger fragments for 1411 kg of the smaller fragments giving an overall reduction in grade of 0.1061% Fe, due to bias in the sampling equipment (Table IV). During the sampling process approximately 0.6 million large particles exchange places with 7.08 million small particles in the stream (Table IV), giving rise to a negative bias in the sample. The exchanges are never actually seen because the particles simply fall back onto the incoming stream and continue to the loading bay of the vessel.
The difference between the unbiased (63.805% Fe) and biased (63.699% Fe) grades, shown in Tables III and IV, due to the exchange between higher- and lower-grade fragments produces a bias of 0.106% Fe. What is noteworthy is that the bias remains the same (0.106% Fe) irrespective of the mass of the composite sample collected for assay. The 0.106% Fe bias in the grade for a 100 000 t load at a price of US$70 per ton and the lot grade of 63.805% Fe would amount to a loss of US$11 600, not much on a load worth US$7.0 million. However, South Africa exports 60 Mt of iron ore annually, and if 100 000 t shipments are used this amounts to 600 ships annually. Thus the cumulative losses in a year could be as much as US$6.96 million.
Conclusions
Sampling errors are those variations in the grade of the target analyte that occur because of constitutional heterogeneity, essentially differences in composition from one fragment of ore to the next. Sampling errors have to do with variability in assay values around the mean grade. Experimentation with a simulated iron ore deposit indicates that the effect of sampling error up to 10% has little or no impact on the mean values, and as a result the financial implications of random variability in iron ores is negligible. Sampling bias, by contrast, has an enormously significant effect on the mean grade of ores and is mainly responsible for financial losses in mineral trade.
Sampling bias arises from poorly designed and poorly installed sampling equipment that consistently favours certain material characteristics in the ores being sampled. A 0.9* to 1.lx multiplicative sampling bias can result in major changes in the means of the sample values and as a result, significant financial losses or gains can be incurred if sampling bias is undetected. These levels of bias are extreme, but they serve to illustrate that it is bias rather than sampling error that is responsible for potential financial losses. Careful attention to sampling equipment performance and maintenance is essential if unseen financial losses in the trade of commodities are to be avoided.
It is suggested here, based on the particle size distribution, that an equal or smaller volume of small, low-grade fragments replaces relatively small volumes of the large, high-grade iron ore fragments, excluded from the sample due to biased sampling equipment. Current indications are that biases in South Africa's iron ore industry are about 0.01% Fe, with probable losses of less than $638 per shipment or less than US$383 000 per annum on 600 shipments. If the status quo is not maintained, biased sampling equipment could decrease the average grade of a 100 000 t shipment by 0.106% Fe, which would result in losses of up to US$6.69 nillion in revenue for the South African iron ore industry.
Acknowledgements
The review of this study and contributions by Dr Ralph Holmes, Chief Research Scientist, CSIRO Mineral Resources, Brisbane is gratefully acknowledged. The assistance of Professor Chris Prins, Anglo American Corporation, in the analysis of the iron ore data and compilation of the GSLib scripts for the computations is deeply appreciated. The inputs, help, and assistance from Mr Johan Feldtmann, Sishen Iron Ore Mine, and Mr Jan Erasmus, Sishen Iron Ore Mine, is gratefully acknowledged. Mr Peru van Niekerk and Mr Theunis Otto, Head of Mining, Anglo American Corporation both read versions of this manuscript and greatly assisted this research, and are gratefully acknowledged.
References
Argall, P.H. 1902. Sampling and dry crushing in Colorado. Excerptfrom the Transactions of the Institution of Mining and Metallurgy, vol. X. pp. 234-273, 290-299. [ Links ]
Argall, P.H. 1912. Western Mill and Smelter Methods of Analysis. Industrial Printing & Publishing Company, Denver, CO. [ Links ]
Bailey, E.C. 1909. Accuracy in sampling coal. Journal of Industrial and Engineering Chemistry, vol. 1. pp. 161-178. [ Links ]
Bartlett, H.E., Korff, L., and Minnitt, R.C.A. 2014. The allocation of gold production from multiple shafts feeding a common treatment plant using run-of-mine sampling of ore deliveries. Journal of the Southern African Institute of Mining and Metallurgy, vol. 114, no. 1. pp. 109-120. [ Links ]
Behre, H.A. 1927. Handbook of Ore Dressing. Taggart, A.F. (ed.). Section 21. Wiley. [ Links ]
Behre, H.A. and Hassialis, M.D. 1945. Sampling and testing. Handbook of Mineral Dressing: Ores and Industrial Minerals. Taggart, A.F. (ed.). Section 19. Wiley, New York. [ Links ]
Brunton, D.W. 1895. The theory and practice of ore sampling. Transactions of the AIME, vol. 25. pp. 826-844. [ Links ]
Carrasco, P., Carrasco, P., and Jara, E. 2004. The economic impact of correct sampling and analysis practices in the copper mining industry. Chemometrics and Intelligent Laboratory Systems, vol. 74, no. 1. pp. 209-213. [ Links ]
Gy, P.M. 1953. Error committed when taking a sample from a batch of ore (Erreur Commise dans le Prélèvement d'un Echantillon sur un Lot de Minerai). Congrès des ¡averies des Mines Mètalliques Françaises, Ecole des Mines de Paris. (Revue de l'Industrie Minerale). St. Etienne, France. pp.311-345. [ Links ]
Gy, P.M. 1967. Sampling of particulate materials (L'Echantillonnage des Minerais en Vrac). Revue de Industrie Minerale, vol. 1, special issue, 15 January 1967. [ Links ]
Gy, P.M. 1975. Theory and Practice of the Sampling of Particulate Materials (Theorie et Pratique de l'Echantillonnage des Matieres Morcelees). Editions PG, Cannes, France. 597 pp [ Links ]
Gy, P.M. 1979. Sampling of Particulate Materials - Theory and Practice. 1st edn. Elsevier, Amsterdam. 448 pp. [ Links ]
Gy, P.M. 2004. Part IV: 50 years of sampling theory-a personal history. Chemometrics and Intelligent Laboratory Systems, vol. 74. pp. 49-60. [ Links ]
Hofman, H.O. 1899. The Metallurgy of Lead and the Desilverisation of Base Bullion. 5th edn. Scientific Publishing Company, New York. [ Links ]
Hofman, H.O. 1901. The Metallurgy of Lead and the Desilverisation of Base Bullion. Scientific Publishing Company, New York. 559 pp. [ Links ]
Holmes, R.J. 2018. Personal communication. Chief Research Scientist, CSIRO Mineral Resources, Brisbane. [ Links ]
Holmes, R.J. 2015. Sample station design and operation. TOS Forum, no. 5. http://www.impublications.com/wcsb7 on 07/072018. pp. 119-128 [ Links ]
Lachance, L., Leroux, D., Gariépy, S., and Flament, F. 2014. Detecting sampling biases in metal accounting. Proceedings of Sampling 2014, Perth, Australia 29-30 July 2014. Publication Series no. 5/2014. Australasian Institute of Mining and Metallurgy, Melbourne. 96 pp. [ Links ]
Minnitt, R.C.A. 2013. Changes in deposit value associated with sampling error and sampling bias. Proceedings of the 6th World Conference on Sampling and Blending (WCSB6), Lima, Peru, 19-22 November 2013. Beriselli, J., Costa, J.F., Dominguez, O., Duggan, S., Esbensen, K., Lyman, G., and Sanfurgo, B. (eds.). Vol. 6. Sampling for Feasibility Studies and Process Control. pp. 89-90. [ Links ]
Minnitt, R.C.A. 2017. Poor sampling, grade distributions, and financial outcomes. Journal of the Southern African Institute of Mining and Metallurgy, vol. 117, no. 2. pp. 109-118. [ Links ]
Otto, T. 2018. Personal communication. Head of Mining, Anglo American Corporation and Kumba Iron Ore. [ Links ]
Pitard, F. F. 2017. Sampling systems for process control and metallurgical accounting. Short course presented at the 8th World Conference on Sampling and Blending (WCSB8), May 2017. [ Links ]
Pitard, F.F. 2006. The theory and practice of sampling. Short course presented through the Geostatistical Society of South Africa (GSSA) in the School of Mining Engineering, University of the Witwatersrand. [ Links ]
Pitard, F.F. 1993. Pierre Gy's Sampling Theory and Sampling Practice, Heterogeneity, Sampling Correctness, and Statistical Process Control. CRC Press. [ Links ]
Pulsifer, H.B. 1920. Ore sampling in Montana. Mining and Scientific Press, vol. 121. p. 866. [ Links ]
Rawle, A. 2017. Henry Vezin and early sampling practice. Malvern Instruments Inc., Westborough, MA. https://www.brainshark.com/malvern/vu?pi=167647466&b=1&tx=582613&c1=22 [accessed 2 December 2017]. [ Links ]
Reed, S.A. 1882. Ore sampling. School of Mines Quarterly, Columbia College, New York, vol. III, no. 4. pp. 253-260. [ Links ]
Reed, S.A. 1885. More remarks on ore sampling. School of Mines Quarterly, Columbia College, New York, vol. VI, no. 4. pp. 351-358. [ Links ]
Richards, R.H. 1908. Ore dressing. Engineering and Mining Journal, vol. 2. pp. 644-1236. [ Links ]
Rickard, T.A. 1907. Sampling and Estimation of Ore in a Mine. A Symposium of Mine Sampling by 27 Engineers. 5th impression. p. 222. Reprintedfrom Engineering and Mining Journal, vol. 75, 76, and 77. [ Links ]
Robinson, G.K. and Holmes, R.J. 1990. Sampling of bulk commodities, design and operation of sample cutters. AMIRA Project P313: Investigation of sample cutter operations. CSIRO, Division of Mineral and Process Engineering. [Video documentary, 11 minutes]. [ Links ]
Sharwood, W.J. AND von Bernewitz, M. 1922. Bibliography of literature on sampling to July 1921. Report of Investigations 2336. US Bureau of Mines. [ Links ]
SPO. Saldanha Port Operations. 2007. Conditions for vessels loading iron ore at the port of Saldanha. http://www.iss-shipping.com/Microsites/Document%20Library/Notice%20to%20Vessels.pdf [accessed 27 January 2018]. [ Links ]
Taggart, A.F. 1927. Handbook of Ore Dressing. Wiley, New York. 1679 pp. [ Links ]
Taggart, A.F. 1945. Handbook of Mineral Dressing: Ores and Industrial Minerals. Wiley, New York. [ Links ]
Van Niekerk, P. 2017. Personal communication. Marketing Division, Kumba Iron Ore. [ Links ]
Warwick, A.W. 1903. Notes on Sampling. Industrial Printing and Publishing Co., Denver, CO. [ Links ]
Woodbridge, T.R. 1916. Ore-sampling conditions in the West. Technical Paper 86. Bureau of Mines, US Department of the Interior, Washington. Government Printing Office. 96 pp. [ Links ] ♦
This paper was first presented at the Society of Mining Professors 6th Regional Conference 2018, 12–13 March 2018, Birchwood Hotel and Conference Centre, Johannesburg, South Africa.
1 One accepts that not all sampling devices are made of steel, but this Is the preferred material, especially In highly abrasive mechanical environments where cross-stream or cross-belt cutters move through a stream of Iron ore particles.
2 Domaln refers to an area over an ore deposit in which the mean grade remains relatively constant, i.e. there Is no trend.

