


Services on Demand
Article
 English (pdf)
 Article in xml format
 Article references
Indicators

Related links
-
 Cited by Google
 -
 Similars in Google
Share

 Permalink
Journal of the Southern African Institute of Mining and Metallurgy
On-line version ISSN 2411-9717
Print version ISSN 2225-6253
J. S. Afr. Inst. Min. Metall. vol.118 n.7 Johannesburg Jul. 2018
http://dx.doi.org/10.17159/2411-9717/2018/v118n7a11
PAPERS OF GENERAL INTEREST
Effects of coal mining on surface topography in South Africa - updates and extensions
J.N. van der Merwe
Visiting Professor, School of Mining Engineering, University of the Witwatersrand, South Africa
SYNOPSIS
Surface subsidence over coal mine workings received a great deal of attention in South Africa in the 1990s with the increased prevalence of high-extraction methods.
This paper updates and further develops previously published material, based on new data and better insights. This can be used for mine planning and for the evaluation of the long-term stability of the surface overlying coal workings.
Instead of just a single profile of subsidence in the case of high-extraction mining, upper and lower limits based on re-analysis of existing data are given. An improved method to predict the expected amount of subsidence in the case of pillar extraction is presented.
The predictions of the maximum amounts of subsidence and induced tilt in the case of pillar failure are updated by additional information that was obtained after the previous method was published.
A more realistic method for evaluating the possibility of sinkhole formation, based on a truncated cone model of the cavity, is presented. With the new model, two mechanisms of cavity arrest are evaluated, namely choking of the cavity by bulking of the collapsed material and wedging out of the cone before it reaches the surface.
A method to estimate the maximum width of subsurface erosion cavities, which takes account of the maximum volume of the reservior for the eroded soil as well as the strength of the overlying 'lid' of the cavity, is presented.
These updates illustrate the need for periodic review of all empirically derived methods.
Suggested default input values are presented but they should only be used as a last resort.
Keywords: subsidence, sinkholes, subsurface erosion, pillar failure.
Introduction
The Lily Mine collapse in 2015, caused by the failure of a crown pillar, highlighted the need to pay more attention to the effects of underground mining on the surface in South Africa. This topic was of great interest in coal mining in the 1990s, with the increased prevalence of high-extraction coal mining methods that invariably resulted in surface subsidence. The subsidence and methods for predicting it were described by several authors, such as Wagner and Schümann (1991), van der Merwe (1991), and Canbulat et al., (2002). However, since that time, the matter had been regarded as being under control and very little further development took place.
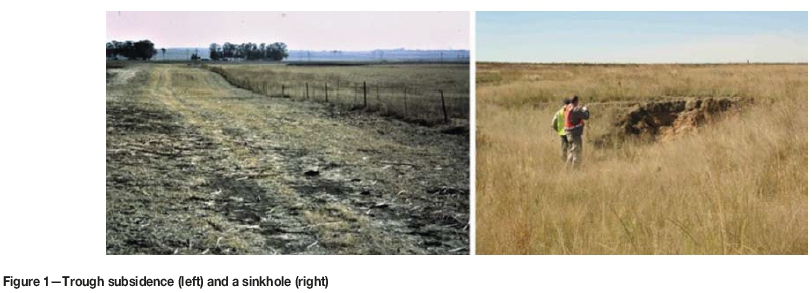
Shallow underground coal mining (i.e. mining depth from 20 m to 200 m), such as practiced in South Africa, can potentially result in two different types of surface disturbance.
The first is trough-like subsidence characterized by relatively wide areas with limited amounts of subsidence and gently sloping sides, and the second is pit-like subsidence, characterized by relatively small areas, greater depths of subsidence, and approximately vertical sides. Each of those can be further subdivided, as will be described in this paper.
The paper provides updates and further developments based on previously published material, incorporating new data and better insights. This can then be used for mine planning and for the evaluation of long-term stability of the surface overlying coal workings.
Most of the results presented in the paper were derived empirically, or were at least based on empirical observations followed by further analyses. It is thus important to be aware of the limits of applicability - depth of mining 20 m to 200 m, mining height 1.5 m to 6 m, bord width 5 m to 7.5 m, and panel width 80 m to 300 m.
Trough-like subsidence
The situations that can potentially result in trough-like subsidence are pillar failure and high-extraction mining methods like short- or longwalling or pillar extraction. This style of subsidence is characterized by relatively large areas of subsidence (approximately the same size as the underground mined panels) and limited depths of subsidence, less than the mining height (see Figure 1 for examples).
The majority of subsidence profiles can be classified as subcritical, meaning that the profiles are not characterized by a flat portion in the centre. According to Wagner and Schumann (1991) the critical panel width for supercritical profiles (i.e. with a flat portion in the centre) is between 1.7 and 3 times the depth of mining, while van der Merwe (1991) quotes a figure of 2.5.
There are distinct differences between the trough-like subsidence caused by high-extraction methods and that caused by pillar failure.
Subsidence caused by high-extraction mining
High-extraction mining typically results in smooth subsidence profiles with the vertical displacement less than the mining height.
Vertical subsidence
In the case of longwall mining in the absence of a strong layer such as dolerite in the overburden, the maximum amount of subsidence, Sm, according to van der Merwe (1991), is a function of the depth of mining, panel width, and mining height and is given by
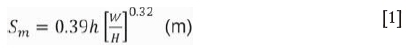
where
h = mining height (m)
H = mining depth (m)
W = panel width (m).
Subsequent routine observations by the author at several sites have indicated that for pillar extraction, Equation [1] should be modified by the incorporation of a modifying factor, fm:

where e is the areal extraction ratio, typically 0.75 or less for pillar extraction.
The full expression for the maximum subsidence is then
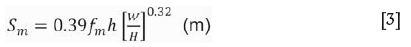
where fm = 1 for longwall mining.
The 'severity' of the profile is classified according to the Sm/H ratio, as given by van der Merwe and Madden (2010) and reproduced in Table I.
In the case of multiple seam mining, the subsidence caused by extraction of the first seam is given by Equation [3] while the additional subsidence caused by extraction of the subsequent seams is approximately equal to the full effective mining height of the additional seams (van der Merwe, 1986).
Shape of subsidence trough
According to van der Merwe (1991), the shape of the half-profile of the subsidence trough is described by
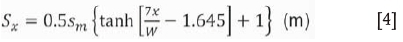
where Sxis the subsidence at a position x from the solid ribside measured toward the centre of the panel.
Inspection of the data on which Equation [4] is based indicated considerable variability (see Figure 2). Upper and lower limits were fitted to the family of curves derived by van der Merwe (1991) and these are described by Equations [5] and [6] respectively.

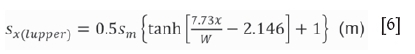

It is considered more reasonable to state that subsidence can be expected to be within the limits described by Equations [5] and [6]. These equations can also be used to evaluate the potential for further subsidence in the case where subsidence has already occurred - if the measured profile plots above the upper limit, it should be considered that there is potential for further subsidence in the future.
Another use of the equations is to construct three-dimensional plots of the subsidence, using the following method.
► Calculate maximum subsidence Sm, using Equation [3]
► Construct a subsidence half-profile for the length of the panel using either of Equations [4], [5], or [6]
► Construct successive transverse half-profiles, again using either of Equations [4], [5], or [6], but using the relevant Sx in that position for Sm in the equation.
It should also be noted that for single seam workings, meaningful subsidence from a structural point of view is contained within the mined panel delineated by inter-panel pillars, but that small amounts of subsidence do in fact occur over the solid areas as well. Between 1% and 5% of the maximum subsidence can be expected to occur directly over the edges of the underground panel.
Related elements of subsidence
Vertical subsidence per se is of major significance only where ponding may result. For all other purposes, the induced tilt and strain are more important. Figure 3 shows a simplified half-profile of a subsidence trough with exaggerated vertical scale, where the induced strain and tilt are also shown.
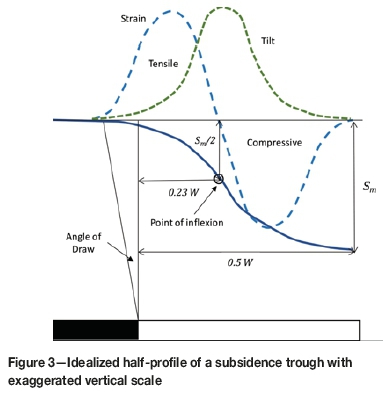
The point of inflection is important in subsidence engineering. It marks the position where half of the maximum subsidence occurs, which is also the position of maximum tilt and the position where the strain changes from tensile at the edges of the subsidence profile to compressive in the central region. It has been seen (van der Merwe, 1991) that the point of inflection typically occurs at a lateral position 0.23W from the solid edge of the underground panel.
The maximum tensile strain - which is where surface cracks can be expected - occurs at a position 0.12 W from the edge, and the maximum compressive strain - where compression ridges can occur - at a position 0.36W.
It has been shown (van der Merwe, 1991) that the magnitudes of tilt and strain can be determined based on the half-profiles of subsidence. However, due to the variability inherent in subsidence profile shapes, the real magnitudes are more variable than those predicted from the profiles. The maximum values to be expected, empirically based on measurement according to van der Merwe (1991), are: Tilt:

Compressive strain:

Tensile strain:

where Sm is the maximum subsidence (in metres) obtained by Equation [3].
Note that the magnitude of compressive strain is greater than the tensile strain, which is characteristic of subcritical subsidence profiles.
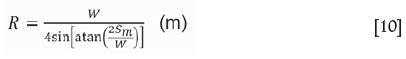
For certain structures the induced radius of curvature, R, is an important parameter. It can be estimated based on geometrical considerations by fitting a circle segment through the edges and centre of a subsidence profile:
Subsidence caused by pillar failure
There are distinct differences between the processes of subsidence caused by high-extraction mining and that caused by pillar failure (van der Merwe and Madden, 2010). The resulting subsidence also differs. There is a scarcity of data describing pillar failure subsidence, implying that the subsidence is predicted with lower confidence than that for high-extraction mining. The scarcity of data is due to the fact that pillar failure is a rare occurrence, with an estimated 0.3% of bord-and-pillar panels having failed in South Africa, based on information in van der Merwe and Matthey (2013). It is also not possible to know beforehand where and when such failures will occur, and consequently accurate elevations of the pre-failure topography can rarely be obtained.
Previously, indicative data by MacCourt, Madden, and Schumann (1986) was used to estimate the magnitude of subsidence that can be expected in the event of pillar failure. Their data has since been supplemented by new cases and the new database was re-examined (see Figure 4). The data is presented in Table II.
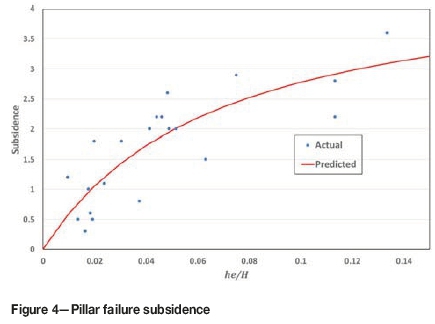
Subsidence due to pillar failure
It was found that the maximum subsidence is related to the equivalent mining height, he (i.e. the product of physical mining height and extraction ratio) and depth of mining, H, as follows:

Tilt due to pillar failure
The maximum tilt was also found to relate to heand H (see Figure 5). The relationship was found to be


Effect ofa dolerite sill
Subsidence may be arrested by the presence of a thick, strong layer in the overburden that is capable of bridging across the mined panel. In South Africa, dolerite sills frequently occur in the overburden and have received attention in this regard. Dolerite is known to be vertically jointed, and based on a modified key-block mechanism, van der Merwe (1995) derived the following expression for the minimum span required to result in sill failure:
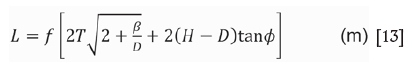

Equations [13] to [15] can be used to plan panel widths in order to control the state of the sill. The temptation to design for an intact sill in order to prevent subsidence from occurring over the long term should be avoided, as cases have been known where the sill was initially intact but failed several years after mining.
Sinkhole subsidence
Two sub-classes of subsidence are discussed under this heading. The first is sinkholes caused by progressive roof collapse from underground, which results in the sudden formation of a sinkhole when the cavity reaches the surface. The second is the occurrence of much smaller sinkholes caused by subsurface erosion, which is a consequence of trough subsidence that only manifests after a period of time ranging from months to decades.
Progressive roofcollapse
This mechanism is described in Canbulat et al., (2002), who derived an equation for the maximum height a cavity can reach before it is arrested by the increase in bulking from the collapsed material. Their equation, however, is only valid for a sinkhole with diameter equal to the width of bord intersections underground and for cavities with vertical sides. Neither condition is necessarily true.
A simplified cross-section of a cavity choked by rubble from the collapse is shown in Figure 6. It shows the cavity as a truncated cone, as opposed to a cylinder.

For the cavity to be choked by bulked rubble from the roof collapse, the bulked volume A in Figure 6 must be equal to the sum of volumes A, B, and C. Therefore,
/((Volume A) = Volume A + Volume Β + Volume C [16]
or
where K is the bulking factor. Then,

where f = ratio of bottom of sinkhole diameter to bord width (i.e. for sinkhole diameter equal to intersection width,f= 1.414)
DB= bord width
z = height of choked volume
zm= maximum height of cavity when it wedges out
Du = diameter of top of choked cavity

where h = mining height

where a = angle of repose of collapsed material.
Where the pillars are small, it is possible for the toes of the collapsed rubble to touch, restricting the volume available for the bulked material in the roadways - see Figure 6a. This can happen where the pillar width, w, is less than hcota. In that case, Equation [20] should be substituted with
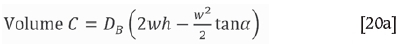
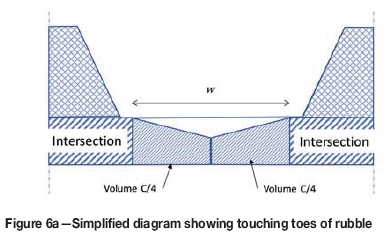
Equation [20a] should be used with caution as it is valid only if adjoining intersections collapse at the same time and extend at the same rate. Experience indicates that adjoining sinkholes very seldom form at the same time.
Also.

and

where φ is the caving angle.
Substitution of Equations [18] to [22] into [17] results in a cubic expression for z, which is easiest to solve by iteration. This is a much more complex equation than the one given in Canbulat et al. (2002), but is relatively easy to solve with commonly available calculation tools like Microsoft Excel®. This procedure allows for two mechanisms of termination of cavity growth, namely wedging out or choking by bulked roof material, and it is more generic as it allows for any inclination of the cavity sidewall or diameter of the cavity.
The maximum height of the cavity is then the smallest of z obtained with Equation [17] (termination by choking) or zm obtained with Equation [21] (termination by wedging out).
The intuitive method is to adopt the conservative approach by assuming vertical sidewalls and then using the original Canbulat et al., (2002) equation as it may be believed to represent the worst case. However, the cavity will in fact progress higher with inclined sidewalls than with vertical ones, and therefore the conservative approach is to use Equation [17]. The higher the cavity, the smaller the diameter of the hole at its upper end.
If the maximum height of the collapse reaches the bottom of the weathered rock or soil on surface, it should be assumed that a sinkhole will develop. It is then merely a matter of time before the soft materials collapse or are washed into the hole underneath.
This approach can be further refined by considering the stability of the 'lid' of the sinkhole in the case where the cavity is completely filled before reaching the bottom of the weathered rock. For this, it is considered that the 'lid' is loaded by the rock and soil above. The tensile strain then developed in the 'lid' is similar to that for a circular plate clamped around the edges (not, as previously assumed, a beam).
Then, the tensile stress developed in the plate is


where p = unit distributed load on clamped circular plate
Psolid= density of solid rock
Psoil= density of overlying soil
σt= tensile stress generated in lid (clamped circular plate)
σtm= tensile strength of lid
tw= thickness of weathered material on top
tl= thickness of unweathered rock above top of collapse cone.
Bulking factor
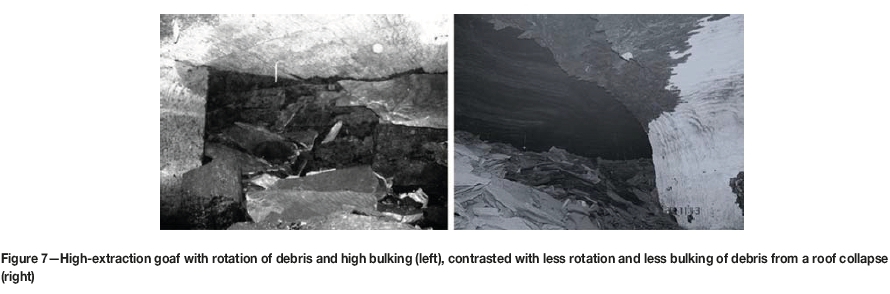
All the equations used for estimating the height of collapse are sensitive to the bulking factor. A commonly used guide is the one from Canbulat et al., (2002), contained in Table III, which originated from two older publications, Steijn (1983) and Wagner and Steijn (1979), reported in Sweby (1997). The data originated from measurements in longwall goafs, which can be expected to be different from collapses in a more confined area, such as a roadway intersection collapse. Less rotation of the broken rock and thus lower bulking factors can be expected in the latter case - this is borne out by observation of rubble at roof collapse sites (see Figure 7).
This is the only data gathered in South Africa to date, but it should be used with caution; using bulking factors greater than 1.25 are not advised and the conservative approach, in the absence of measured data on any specific mine, is to use a value of 1.1.
A comprehensive overview of bulking factors worldwide is given by Ofoegbu, Read, and Ferrante (2008). However, almost all the data presented is relevant to longwall mining goafs or bulk mining methods. A very wide range of bulking factors for the same rock types is reported, which highlights the need for local observation. Esterhuizen and Karacan (2007) used analytical methods to predict bulking factors based on the ratio of block size to collapse height. They found that as the fall height decreases towards the top of the collapse zone, the bulking factor decreases. This finding supports the notion that lower bulking factors may be expected at lower mining heights for the same rock types.
The above two findings lead to the conclusion that it may be misleading to use generic bulking factors and that local measurement at roof fall sites should be the preferred method to determine the input parameters.
The caving angle, φ
The conical collapse model is sensitive to the caving angle. If possible, this should be determined by observation at roof collapse sites or existing sinkholes. The only existing data in the public domain comes from longwall goaf observations, Sweby (1997) (see Table IV). Sweby (1997) remarked that the caving angle tends to be steeper for weaker rock masses, but did not quantify this statement - most probably due to lack of sufficient information.
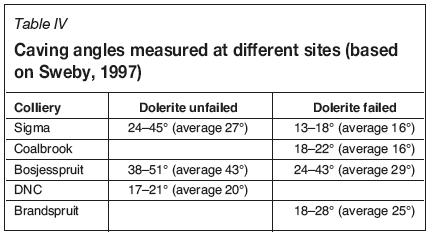
Note that in all cases, the caving angle is shallower where the dolerite sill has not failed, presumably due to the restraining effect of the intact sill at the top of the cavity. Observations at roof collapse sites over several years tend to support the caving angles given in Table IV, but this type of observation can be misleading as such observations are usually made very soon after the collapse occurred and the possibility that the angles may become steeper over time cannot be ignored.
Figure 8 illustrates the effects of bulking factor and caving angle on the maximum height of the cavity based on the conical model. It was constructed for a case where the bord width was 6 m and the mining height 3 m. It is seen that for a vertical caving angle (caving angle 0°), the height of the cavity decreases with increasing bulking factor. For small caving angles, the height of the cavity increases with increasing caving angle, reaching a maximum at the point where the termination mechanism changes from bulking to wedging. From that point onwards, the caving height decreases with increasing caving angle and the bulking factor is no longer relevant.
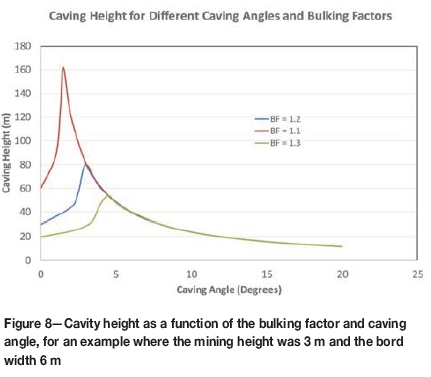
This may explain why sinkholes are rarely experienced at mining depths of more than 20 m. It would appear that the caving height of roof collapse is controlled more by the caving angle than by the bulking factor. This also emphasises the need for site-specific observation and measurement rather than relying on estimated or generic values.
Subsurface erosion (SSE)
Subsurface erosion (SSE) is a time-dependent phenomenon that occurs around the perimeter of trough subsidence after a period of a year or more, sometimes up to 100 years after mining. It appears at the positions where tensile cracks formed as a result of the tensile strains caused by trough subsidence.
SSE develops by a process whereby soil is washed into cracks in the upper rock layers, resulting in a subterranean cavity that eventually collapses, forming a small sinkhole. This type of sinkhole is distinct from classical sinkholes caused by underground roof collapse. SSE sinkholes tend to be smaller, usually less than a metre in diameter - although in exceptional cases holes more than 5 m diameter have also been found. A superficial description of the phenomenon is contained in van der Merwe and Madden (2010). However, that description does not include sufficient detail of the process to enable one to isolate the critical factors. More detail is given in the following paragraphs.
For SSE to occur, the following are required:
► Erodible soil
► Crack in rock (reservoir for eroded soil)
► Layered soil (e.g. clay and sand in layers)
► Transport medium (water).
Based on observation, the end result is a cavity with cross-section as shown in Figure 9.

Maximum width of cavity based on volume considerations
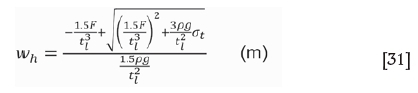
Based on volume comparison, the volume of eroded soil in the crack must equal the volume of the cavity in the soil. Then the maximum width of the sinkhole, provided the lid is strong enough to span across the cavity, is given by:

where wh= cavity width
ts= soil depth
ti= thickness of the lid
tc= depth of crack
wc= width of crack
α = angle of internal friction of soil. Equation [28] is the complete expression of the width of the cavity. It has been seen that it is relatively insensitive to the angle a. Using a value of α = 0, the cross-section and the equation for the maximum width are greatly simplified (see Figure 10).

The expression for the maximum width of the cavity is then:
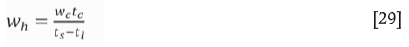
Equation [29] yields practically the same results as Equation [28] if small values for α are used.
The soil depth is to be taken as the thickness of the bottom transportable layer if the soil is layered. It is not necessarily the full depth of the soil to the top of the rock contact. In several cases, the soil will consist of successive layers of sandy and clayey soils.
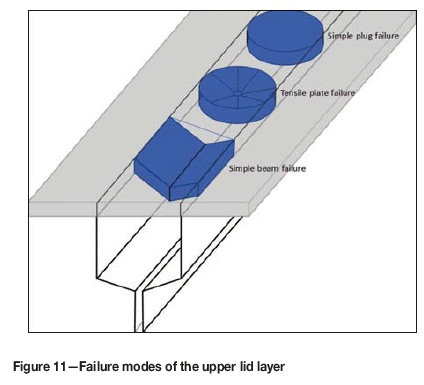
Maximum width of cavity based on strength of lid In most cases, the cavity will collapse to surface before the maximum width, as given by Equation [28] or [29], is reached, because the upper soil layer does not have infinite strength. Two modes of failure of the upper lid have been observed, namely long, square plate failure (simplified as beam failure) and circular plate failure (see Figure 11). Circular plug failure (in shear mode) is also possible but will occur only in rare instances.
Shear plug failure
The load resulting in failure can either be merely the weight of the lid itself, or a point load such as a person or vehicle, or both. The expression for the maximum radius based on consideration of the load on the lid is:
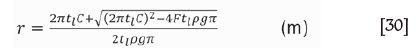
where C = cohesion of the lid material (kPa)
ρ = density of the material (kg/m3)
F = point load (kN).
Simple beam failure
The maximum width of the cavity based on a combined loading system of a uniformly distributed load and a point load is given by
Circular plate failure
For this failure mode, based on the fundamental consideration of tensile stress developed around the edge of a clamped circular plate with a combination of a uniformly distributed load and a point load, the radius of the plate resulting in failure is easiest found by iteration of the equation
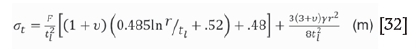
where σt= tensile strength of the upper layer making up the lid of the cavity
γ = unit distributed weight (pgtL).
The procedure for using the equations in this section is to firstly calculate the maximum width of the cavity using Equation [29] and then check the effect of the strength of the lid with Equation [32]. The reason for using Equation [32] for the lid evaluation is that the first failure is invariably circular (see Figure 12), with the beam-type failure following, linking up the circular failures.

Typical input values
Equations [29] and [32] require a number of input values that are not always easy to determine. The following guidelines may be used.
► Crack width, wc. The beacon spacing used for the subsidence research described by van der Merwe (1991) was 5 m, and consequently the total elongation at the positions where the maximum tensile strain occurred was 5 χ maximum tensile strain (see Equation [8]) or 21Sm + 8.5 (mm). It is reasonable to equate this to the crack width in the rock.
► Crack depth, tc. It has been seen that the cracks in the rock are not necessarily continuous, but are often laterally displaced on bedding planes. This means that the cracks are unlikely to extend in a straight line all the way down to the goaf. Back-analysis of known SSE cavity widths tends to indicate that a maximum continuous crack depth of 25 m is reasonable to use.
► Soil depth, ts. This is measurable, but it should be borne in mind that the depth to use is the thickness of the more transportable soil layer closest to the rock.
► Lid thickness, tl. This is likewise measurable and would typically be the thickness of an upper clayey layer (if it exists) or the thickness of the upper soil layer which is compacted by animal or human movement and strengthened by grass roots. If in doubt, use a value of 0.1 m.
► Poisson's ratio of soil, v, (Bowles, 1996):
Clay, saturated: 0.4 to 0.5
Clay, unsaturated: 0.1 to 0.3
Sandy clay: 0.2 to 0.3
Silt: 0.3 to 0.35
Sand, gravelly sand: 0.1 to 1.0 (not elastic, but 0.3 to 0.4 commonly used)
► Tensile strength of lid, σt.. Where the lid consists of constructed material like a concrete slab or a road pavement, this parameter is measurable. If it is soil, it can be likened to a fibre-reinforced soil (effect of plant roots), in which case a tensile strength of 50 kPa to 80 kPa appears reasonable to use (Li etal., 2004).
Although a detailed study using the default input numbers shown has not been undertaken, the results indicate reasonable agreement with observations at subsidence sites in the Vaal Basin and Highveld coalfields. The default values with a soil thickness of 1 m and point load of 80 kg indicated a cavity width of approximately 1 m, comparable with the examples shown in Figure 12.
Conclusions
A number of updates of procedures commonly used to evaluate the stability of the surface overlying coal mine workings have been presented.
Instead of just a single profile of subsidence in the case of high-extraction mining, upper and lower limits based on re-analysis of existing data are given. This makes it possible to evaluate whether more subsidence can be expected in places where subsidence has already occurred, and also to predict the expected limits of subsidence in new mining areas. An improved method of predicting the expected amount of subsidence in the case of pillar extraction is also presented.
Predictions of the maximum amounts of subsidence and induced tilt in the case of pillar failure are given, based on analysis of an improved database that incorporates additional subsidence cases that occurred after the previous method was published.
A more realistic method of evaluating the possibility of sinkhole formation is presented. This is based on the truncated cone model as opposed to the previously used cylindrical model. With this model, two mechanisms of cavity arrest are evaluated, namely choking of the cavity by bulking of the collapsed material and wedging out of the cone before it reaches the surface.
A method to estimate the maximum width of subsurface erosion cavities is presented for the first time. This takes account of the maximum volume of the receptacle for the eroded soil as well as the strength of the overlying lid of the cavity.
These updates illustrate the need for periodic review of all empirically derived methods. As time goes by, databases continue to expand, resulting in progressively better methods of prediction. Improved methods of prediction also arise from better understanding of the processes involved.
The equations presented in the paper are more complex than those previously used, but no specialist software is required for the calculations. All can be performed easily with commonly available tools such as Microsoft Excel™.
Suggested default input values are presented but should only be used as a last resort. For instance, the caving angle and bulking factor are crucially important for the prediction of sinkhole formation. Very few, if any, mines would have this information available, but both these factors are relatively easy to obtain by observation at roof collapse sites underground.
To quote Steve Crouch, co-developer of the boundary element methods of analysis: 'If you are going to guess the input, why not just guess the answer?'
References
Bowles, J.E. 1996. Foundation Analysis and Design. (5th edn.). McGraw-Hill. [ Links ]
Canbulat, I., van der Merwe, J.N., van Zyl, M., Wilkinson, A., Daehnke, A., and Ryder, J. 2002. The development of techniques to predict and manage the impact of surface subsidence. Final Report, Task 6.9.1, Coaltech 2020. Minerals Council South Africa, Johannesburg. December 2002. [ Links ]
Esterhuizen, G.S. and Karacan, C.O. 2007. A methodology for determining gob permeability distributions and its application to reservoir modeling of coal mine longwalls. Proceedings of the2007SME Annual Meeting and Exhibit, Denver, Colorado, 25-28 February. Preprint 07-78. Society for Mining, Metallurgy, and Exploration, Inc., Littleton, CO. [ Links ]
Li, J., Tang, C., Wang, D., Pei, X., and Shi, B. 2014. Effect of discrete fibre reinforcement on soil tensile strength. Journal of Rock Mechanics and Geotechnical Engineering, vol. 6, no. 2. pp. 133-137. [ Links ]
MacCourt, L., Madden, B.J., and Schumann, E.H.R. 1986. Case studies of surface subsidence over collapsed bord and pillar workings in South Africa. Proceedings of The Effect of Underground Mining on Surface. South African National Group on Rock Mechanics. pp. 25-32. [ Links ]
Ofoegbu, G.I., Read, R.S., and Ferrante, F. 2008. Bulking factor of rock for underground openings. Draft Report. US Nuclear Regulatory Commission Contract NRC 02-07-006. [ Links ]
Steijn, J.J. 1983. Support requirements of longwalling, Sigma Colliery - panels 1 and 2, Part II, Longwall mining - behaviour of parting. Research Report no. 15/83. Chamber of Mines of South Africa, Johannesburg. [ Links ]
Sweby, G. 1997. Review the caving mechanisms around high extraction systems and determine the effect of the mechanisms on the safety of the system. Report COL327. Safety In Mines Research Advisory Committee (SIMRAC), Johannesburg. [ Links ]
Van der Merwe, J.N. 1986). Design methods to arrive at the optimal placing and mining of interpanel pillars to alleviate their effects on surface. Proceedings of the Effect of Underground Mining on Surface. South African National Group on Rock Mechanics. [ Links ]
Van der Merwe, J.N. 1991. Subsidence caused by high extraction coal mining in the Sasolburg and Secunda areas: prediction thereof and the mitigation of its effects. PhD thesis, University of the Witwatersrand. [ Links ]
Van der Merwe, J.N. 1995. Prediction of dolerite sill failure. Proceedings of the 8th Congress. of the International Societyfor Rock Mechanics, Tokyo. Balkema. pp. 1349-1354. [ Links ]
Van der Merwe, J.N. and Madden, B.J. 2010. Rock Engineering for Underground Coal Mining 2nd edn. Special Publications Series 8. Southern African Institute of Mining and Metallurgy, Johannesburg. [ Links ]
Van der Merwe, J.N. and Mathey, M. 2013. Probability of failure of South African coal pillars. Journal of the Southern African Institute of Mining and Metallurgy, vol. 113, no. 11. pp.849-857. [ Links ]
Wagner, H. and Steijn, J.J. 1979. Effect of local strata conditions on the support requirements of longwall faces. Proceedings of the 4th Congress of the International Societyfor Rock Mechanics, Montreux. Balkema. pp. 557-564. [ Links ]
Wagner, H. and Schumann, H.E.R. 1991. Surface effects of total coal-seam extraction by underground mining methods. Journal of the South African Institute of Mining and Metallurgy, vol. 91, no. 7. pp. 221-231. [ Links ] ♦
Paper received Apr. 2017
Revised paper received Mar. 2018

