


Services on Demand
Article
 English (pdf)
 Article in xml format
 Article references
Indicators

Related links
-
 Cited by Google
 -
 Similars in Google
Share

 Permalink
Journal of the Southern African Institute of Mining and Metallurgy
On-line version ISSN 2411-9717
Print version ISSN 2225-6253
J. S. Afr. Inst. Min. Metall. vol.118 n.7 Johannesburg Jul. 2018
http://dx.doi.org/10.17159/2411-9717/2018/v118n7a6
PAPERS OF GENERAL INTEREST
Draw control strategies in sublevel caving mines - A baseline mapping of LKAB's Malmberget and Kiirunavaara mines
G. ShekharI; A. GustafsonI; P. Boeg-JensenII; L. MalmgrenII; H. SchunnessonI
ILuleá University of Technology, Luleá, Sweden
IILuossave-Kiirunavaara AB, Kiruna, Sweden
SYNOPSIS
The Malmberget and Kiirunavaara mines are the two largest underground iron ore operations in the world. Luossavaara-Kiirunavaara AB (LKAB) uses sublevel caving (SLC) to operate the mines while maintaining a high level of productivity and safety. The paper enumerates the loading criteria and loading constraints at the mines and outlines details of mine design, layout, and geology affecting the draw control. A study of the various draw control strategies used in sublevel caving operations globally has also been done to establish the present state-of-the-art. An analysis of the draw control and loading operations at the Malmberget and Kiirunavaara mines is summarized using information collected through interviews, internal documents, meetings, and manuals. An optimized draw control strategy is vital for improving ore recovery and reducing dilution in SLC. Based on the literature review and baseline mapping study, a set of guidelines for designing a new draw control strategy is presented. The draw control strategy at Malmberget and Kiirunavaara is guided by a bucket-weight-based drawpoint monitoring system that is part of the overall framework. Both mines employ a draw control strategy that considers the production requirements and mining constraints while regulating the loading process through an empirical method based on bucket weights and grades. However, in the present scenario of fluctuating metal prices and increasing operational costs a new draw control strategy is needed which is probabilistic in nature and can handle the uncertainties associated with caving operations.
Keywords: sublevel caving, draw control, optimization, drawpoint monitoring.
Introduction
A consistent issue in sublevel caving (SLC) operations is the regulation of loading at the drawpoints, especially as the decision to stop loading from a particular drawpoint and blast the next ring is irreversible. In caving operations, the draw control regulates loading by providing information on when to stop loading (Shekhar, Gustafson, and Schunnesson, 2016).
Smith and Rahal (2001) state that draw control incorporates the sequencing and scheduling of development, production, and the material handling system, with the dual (and contradictory) objectives of minimizing mining costs and dilution. Similarly, Bull and Page (2000) define an effective draw control strategy as one that maximizes ore recovery while minimizing dilution and delaying dilution entry in the drawpoint by deploying 'corrective methods'. The contradictory objectives of reducing dilution while improving ore recovery are difficult to understand and complicated to apply. In SLC, the five parameters used to measure drawpoint performance are drawpoint dimensions, final extraction ratio, loading stoppage issues, fragmentation, and ore grade (Shekhar et al., 2016). Fragmentation is difficult to measure continuously, while drawpoint dimensions tend to remain constant. Therefore the remaining parameters - final extraction ratio, ore grades, and stoppage issues are vital to an analysis of drawpoint performance in an operating mine. Previous work cited in the literature and other results from physical models, marker trials, and field data analysis have identified seven factors of SLC which affect draw control; these are discussed in Table I. The paper presents the findings of a detailed baseline mapping study performed on the two largest underground iron ore operations, Malmberget and Kiirunavaara mines. The various draw control strategies used around the world are used to create a set of guidelines for a new draw control strategy.
Monitoring the drawpoint in SLC
The monitoring of the ore grade at the drawpoint is termed 'grade control' (Booth et al., 2004). The purpose is to provide information about the ore grade being loaded. The system used to monitor the ore grade depends on the ore type and mine requirements. Systems can provide ore grade measurements continuously (Quinteiro, Larsson, and Hustrulid, 2001) or periodically [e.g. every 100 t or based on work shifts) (Cokayne, 1982; McMurray, 1982). Drawpoint monitoring systems can be divided into three types based on the technique used.
Visual estimation technique: This technique is based on the visual differentiation of ore and waste (Cokayne, 1982). The percentage of ore and waste present in the muckpile is visually estimated based on the colour, shape, or texture of the material (Booth et al., 2004). According to Booth et al., (2004), discrimination between ore and waste at Perseverance mine in Australia was based on rock colour and angularity. Lighter and harder hangingwall gneiss and rounded ultramafic footwall were easily distinguished from the darker and more angular ultramafic ore. McMurray (1982) describes a visual inspection used on a shift basis for the grade control of asbestos ore at Shabanie mine in Zimbabwe. Similar practices have been described for Craigmont mine, Canada (Baase, Diment, and Petrina, 1982) and the Frood-Stobie Complex, Canada (Nickson et al., 2012).
Sampling and assay system: This technique is used when no visual differences can be seen between ore and waste (Cokayne, 1982). Several samples are taken at the drawpoint and then prepared and analysed underground (Cokayne, 1982). Loading from the muckpile should be stopped during the sampling period in order to ensure a representative sample. Cokayne (1982) concludes that this method is more accurate than visual estimation. It is, however, very expensive, and is more time-consuming than visual estimation. Hancock and Mattson (1982) describe the use of this method for a chalcopyrite orebody at Granduc mine in Canada. Samples of 1.4 to 2.3 kg each were collected after each blast at intervals of every 20 to 30 scoop buckets until cut-off was reached. Laboratories were set up close to the centres of production, returning assay results within half an hour of sampling using standard sample preparation equipment and a portable isotope fluorescent X-ray analyser (Hancock and Mattson, 1982). More recently, bulk sampling has been done at Perseverance mine, albeit on rare occasions (Booth et al., 2004).
Density-based monitoring system: The density-based method is used when there is a significant difference in the density of ore and waste. The drawpoint monitoring method used in Kiirunavaara and Malmberget mines exploits the difference in the density between ore (4.6-4.8 t/m3) and waste (2.7-2.8 t/m3) (Davison, 1996). A load cell placed on the hydraulic cylinder of the load haul dump (LHD) bucket reads the hydraulic pressure in the cylinder and converts it into tonnage. This weight measurement system is called the Loadrite scoop weighing system. The bucket weight reading is used to estimate the percentages of ore and waste in the bucket (visualized in Figure 1) (Gustafson et al., 2013; Klemo, 2005). The weights of 100% ore and 100% waste for completely filled buckets are known for different bucket sizes. WOLIS (Wireless Loader Information System) uses the bucket weight together with an assumed theoretical volume of the loaded material to calculate the grade of the material in each fully loaded bucket, i.e. the percentages of iron and waste present in the bucket. The formula for iron percentage used by WOLIS is given in Equation [1]:


where X is the weight of a bucket completely filled with ore and Y is the weight of the bucket completely filled with waste for a given LHD machine (Shekhar, Gustafson, and Schunnesson, 2017). As mines generally have machines with different bucket sizes, the WOLIS system uses different X and Y values stored for the different machines. Figure 2 shows one example of the details displayed to the LHD operator by WOLIS.

The operator can see information related to ring location (1), last bucket weight (2), ring design (3), extraction ratio (ratio of the total tonnage of material loaded from the drawpoint to the estimated tonnage of the ring) (4), system status (5), report status (6), loading graph (7), nearby charged holes (8), ring information (9), and extraction ratio of proximate rings (10). The operator can change the visualized graph if he or she wants to see, for example, iron ore content, extraction ratio, waste rock content, bucket number, tonnage. The information is used by the operator to decide if loading should be continued or discontinued at a particular drawpoint (Shekhar, Gustafson, and Schunnesson, 2017).
The Malmberget and Kiirunavaara mines have been storing comprehensive production data in a database management system for at least the last 10 years. The production data includes bucket weights, estimated bucket grades, and final extraction ratio for all the production rings blasted at the mines. This data can be used to calculate the average grade of a mined ring and observe the variation in ore flow throughout the loading process. Shekhar et al., (2016) discuss the use of the production data to understand the variation in the drawpoint performance (average grade, final extraction ratio etc.) for an operating SLC mine.
Draw control strategies
The issue of when to stop loading from the drawpoint and blast the next ring is at the centre of draw control strategies (Sarin, 1981). Initially, draw control strategies were a combination of grade control and tonnage-based loading control systems, but newer strategies use techniques such as material flow prediction, and simulation (Chitombo, 2010; Castro, Gonzalez, and Arancibia, 2009; Gustafsson, 1998; Sellden and Pierce, 2004). Detailed work on gravity flow and flow simulation techniques, along with software developments, has produced several types of flow-based software and modules for simulating flow behaviour that can forecast drawpoint performance (Cundall, Mukundakrishnan, and Lorig, 2000; Diering, 2007; Pierce, 2010). This work is based on physical modelling, including small- to large-scale models (Castro, Trueman, and Halim, 2007; Halim, 2006; Power, 2004). Research using marker trials has been done in SLC mines in Sweden, China, and Australia (Brunton, 2009; Gustafsson, 1998; Power, 2004; Wimmer etal., 2012, 2015). The marker trials have provided important knowledge on flow behaviour and dilution behaviour and have been used for mine design and ore flow simulation in SLC mines. Table II shows eight draw control strategies used in various mines; in-depth descriptions of these strategies follow.
Tonnage-based draw control strategy
Draw control strategies based on fixed tonnage and grade control at the drawpoint are collectively termed 'tonnage-based draw control strategies'. A fixed target tonnage is decided for a ring based on drill pattern design and recovery targets. Loading is stopped when the target is achieved or when the ore grade drops below the shut-off grade (Baase, Diment, and Petrina, 1982; Hancock and Mattson, 1982; McMurray, 1982; Sarin, 1981).
Draw control based on REBOP model
REBOP stands for Rapid Emulator Based on PFC (Particle Flow Code) (Cundall, Mukundakrishnan, and Lorig, 2000).
REBOP calculates contact forces and the resultant Newtonian dynamics of particles (Cundall, Mukundakrishnan, and Lorig, 2000). REBOP's main objective is to simulate flow within caving operations based on the concepts of isolated movement zones (IMZs) for a drawpoint (Cundall, Mukundakrishnan, and Lorig, 2000; Pierce, 2010). The model uses a layer concept, whereby an IMZ is comprised of a number of disk-shaped layers, and its growth is based on incremental laws applied at layer levels (Pierce, 2010; Sellden and Pierce, 2004). The three main principles guiding the growth of IMZ are porosity, collapse, and erosion (Pierce, 2010).
Draw control based on PCSLC model
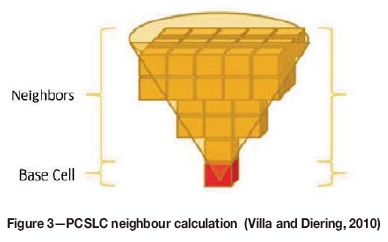
The PCSLC model is a mine planning module developed in Dassault Systemes Geovia's GEMS software by Villa and Diering (2010). The model uses the template mixing algorithm which defines material movement principles for different phenomena, such as vertical mixing, rilling, fines migration etc. (Diering, 2007). The objective is not to simulate flow based on gravity flow conditions (Cundall, Mukundakrishnan, and Lorig, 2000), but to predict the material grade extracted at the drawpoint for a given set of flow conditions (Villa and Diering, 2010). This prediction is used for grade forecasting and production scheduling. The orebody is first divided into cells. The cells are then used to make a production ring. Each element or cell can be depleted, and when sufficiently depleted, it is replenished (Salinas, 2001). A cell is connected to other cells based on a weighted system used for neighbour calculations. The weight is directly proportional to the distance from the main cell to the sampling point of the neighbouring cell (Salinas, 2001). A 3D cone is used to select the cells to be used for building weights, as shown in Figure 3. Thereafter, the selected cells' weight contribution is assigned to the closest suitable production ring (Salinas, 2001).
Dilution entry method
Laubscher (1994) gives a formula (Equation [2]) for calculating dilution entry, based on which the extraction ratio and ore grade performance can be calculated for block caving:

where A = draw-column height χ swell factor; B = height of interaction; C = draw-control factor. The draw control factor is based on the variation in tonnage from working drawpoints. The dilution entry method gives ore composition versus extraction ratio curves for different values of dilution entry, as shown in Figure 4 (Bull and Page, 2000).

Dilution is given a grade which is an average of the top cave material grade and the grade of unrecovered material from the above levels (Bull and Page, 2000). Cut-off grades are calculated based on mine economics, and shut-off grades are re-estimated using marginal cost information to analyse the feasibility of the shut-off grade with respect to depreciation and repayment (Bull and Page, 2000). These guidelines, along with the curves, provide the basis for draw control. The curves are used to complement mine planning and scheduling.
Draw bin method
The draw bin method was first implemented in a feasibility study at Telfer mine, Australia, and then used at Ridgeway Deeps, Australia (Allman, 2002, in Jamieson, 2012). The method is an improvement on the dilution entry method and incorporates the recovery curves from the primary, secondary, and tertiary recoveries, i.e. first, second, and third levels. The recovery curves are based on full-scale marker trials at Ridgeway (Jamieson, 2012). The recovery curves for the draw bin method tested at Telfer and Ridgeway Deeps are shown in Figure 5. The method uses a series of Datamine macros to calculate the expected diluted grade for a series of rings (Allman, 2002, in Jamieson, 2012). The final output is a block model containing both in-situ grade and diluted grade for all blocks based on planned extraction ratios for each ring on each level.

Newcrest dilution model and SLC optimizer
The Newcrest dilution model and SLC optimizer can be divided into a recovery model and a draw strategy optimization model (Jamieson, 2012). The recovery of each cell is calculated based on Equation [3]:

where T = recovered tons; td = tons being drawn from a cell; ta = tons available for recovery; A = model calibration factor A; B = model calibration factor B; C = model calibration factor C; DL = recovery level (1st level = 1, 2nd level = 2, etc.) within the column.
Recovery Model: The above equation is based on the principle that tonnage extracted from a cell in SLC should be a function of the tons drawn from the cell and the tons remaining in the cell that are available for extraction (Jamieson, 2012). The recovery model is calibrated by correlating the diluted average grade from past production data with the actual average grade measured at the mill. In the study described above, the gold equivalent was used for calibration at Telfer and Ridgeway Deeps, as both mines produce copper and gold. Draw strategy optimiation model: In this model, the values of model coefficients A, B, and C (from Equation [3]) are used to optimize the planned extraction ratio for all remaining production rings. The draw control strategy at Telfer was optimized by maximizing the undiscounted profit of each draw column (Jamieson, 2012). This was achieved by calculating the diluted ore value against the variable mining cost, as shown in Figure 6. It took only 2-3 hours to completely analyse more than 2 million draw strategies over the SLC footprint (Jamieson, 2012).

Non-dilution draw method
Zhigui and Xingguo (2008) state that cut-off grades are the primary problem with the current draw control strategies and propose a 'non-dilution draw' method. In this method, loading should be stopped as soon as dilution is encountered at the drawpoint (Zhigui and Xingguo, 2008). More specifically, loading is stopped when the muckpile appears to contain 5-10% waste. Physical modelling results show dilution of 4-6% for the non-dilution draw method and a dilution of 15-30% for the cut-off grade method (a waste-to-ore ratio at the muckpile of 30:70), while the ore recovery targets remain the same (Zhigui and Xingguo, 2008). In field tests performed in test areas at Jing Tie iron ore mine, China (Zhigui and Xingguo, 2008), the method was used with a shut-off grade of 10:90 waste-to-ore ratio. Ore recovery was calculated for different sublevels. The ore recovery for the first two sublevels was affected by the switch in the draw control system, but the ore recovery for the third and subsequent sublevels reached the same level as with a traditional draw control system, i.e., approximately 90% (Zhigui and Xingguo, 2008).
Power geotechnical cellular automata (PGCA)
PGCA is a particle-to-particle-based flow modelling technique that can account for material properties, cave back constraints, and other aspects relevant to material flow in caving (Power and Campbell, 2016). The model was calibrated against initial marker trial results at Ernest Henry mine, Australia. In future studies, the model will be calibrated against complete marker trial results, thus providing a better prediction of mineral production and material flow (Power and Campbell, 2016).
Draw control strategy at Malmberget mine
Malmberget mine consists of about 20 orebodies, 12 of which are currently being mined. The mining area stretches 5 km in the E-W direction and 2.5 km in the N-S direction (Lund, 2013). The ore is composed of magnetite (95%) and haematite (5%), and the grade for the different orebodies varies from 49% to 63% (Lund, 2013).
Loading criteria
Loading criteria are a set of rules and guidelines that control the loading and closing of drawpoints in SLC. Malmberget has three loading criteria. The operators should continue loading until:
► The extraction ratio (ratio of the total tonnage of material loaded from the drawpoint to the estimated tonnage of the ring) percentage is > 80%
► The average Fe content for the last 25% units of the material loaded (extraction-ratiowise) falls below 30%, and
► The trend of the Fe% for the last 40% units of the material loaded (extraction ratio wise) is negative.
At this point, only the two first criteria are displayed in the LHD cabin for operators. In general, loading is stopped when all three loading criteria are fulfilled, but closing the drawpoints is a subjective decision and depends on the assessment of the loading personnel. If a drawpoint performs poorly from the start (low ore grade), the drawpoint can be closed before an 80% extraction ratio is reached. Loading near ore boundaries: The loading process and draw control near the hangingwall are guided by safety concerns. Drawpoints near the hangingwalls have an open cavern at later stages of the draw; the hangingwalls have not yet caved or have just started to cave, creating an open cavern above the drawpoint. Keeping this in mind, LHD operators load the material under the supported part of the drift. The current loading procedure dictates that no loading can be performed in an open cavern situation. As a result, loading is stopped when an opening is encountered at the drawpoint because of a gap between the muckpile and the drift roof. The last rings drilled in the production drifts have their drill collars in the footwall, resulting in internal dilution. Because of this, the loading procedure for these rings is different. The initial inflow of waste is neglected, and extraction ratio targets for these rings are kept higher to recover ore that may have accumulated in the upper part of the rings. For the last drawpoint of a production drift, the second phase of loading, known as 'restmalmslastning' (residual ore loading), is sometimes done by reopening the closed drawpoint to recover known ore remnants. This is a separate process; it assumes that heavy finer ore flows faster than caved material (Kvapil, 1982) and accumulates at the bottom of the caved material.
Loading constraints
For an SLC operation, loading constraints include production requirements, grade control, and mining constraints. Production requirements deal with planned yearly, monthly, and weekly production targets which must be reached for mine operation to be profitable. Grade control is guided by the overall average run-of-mine grade and the shut-off grade for material loading at the drawpoint. Mining constraints are a set of defined constraints to ensure a safe and efficient operation. They include aspects of the mining sequence, continuous cave propagation, blasting, seismicity, available orepasses etc.
Malmberget mine produced around 16.4 Mt of crude ore in 2016; most of this (14.5 Mt) was magnetite, and the rest was haematite (LKAB, 2016). The mine production and scheduling are controlled by short-term plans (three months) discussed in monthly meetings of production and mine planning personnel. Based on the production details of the past month, the short-term plan is revised to meet future production targets. The planned tonnage of a production ring at Malmberget mine varies, as the mine design varies for different orebodies and ore geometries. Hence, the total production target is divided into approximate targets for individual orebodies using the planned tonnage data from the drill pattern design and resource availability. The average mine and shut-off grades for Malmberget vary and are decided by the mine. In 2015, the average mine grade target was 42% Fe, and the shut-off grade target was 30% (Shekhar, Gustafson, and Schunnesson, 2017). However, the average final extraction ratio was 120%, with an average grade of 40.6% Fe. The mine has now increased the shut-off grade from 30% Fe to 35% Fe to reach the overall average grade of 42%. The mine uses a constant grade of 45% for production planning in both short- and long-term plans to simplify the planning process.
Mining constraints for draw control
The mining sequence at Malmberget varies for different orebodies and mining levels but is primarily guided by the development situation of the level below. If there is no development at the lower level or in case of complete development at the lower level, a production ring can be blasted and loaded. However, if partial development is under way, mining cannot be done in those production drifts. In general, a straight cave front is maintained; this transitions into a V-shaped sequence with the vertex pointing away from the entry point into the orebody. The mining sequences vary for different orebodies and are decided by the mine. A minimum distance of 30 m is maintained between production faces for two levels, such that the lower production level lags the upper production level by a distance of 30 m.
The mining sequence is also changed if mining-induced seismicity occurs. Mining-induced seismic events can be harmful to the infrastructure and buildings in the city near the mine; in some cases, they can pose a danger to the miners and the mine's infrastructure. If the loading at drawpoints in active seismic areas is not safe, the mining sequence is changed by halting the loading process in these areas or postponing blasting until the situation is stabilized.
To achieve its production target, Malmberget mine needs 11 active production areas in the eastern fields and two to five in the western field. Each production area needs two to three active drawpoints. Hence, the mine currently has between 18 and 25 active drawpoints.
At different times, some orebodies in Malmberget may lack the required number of active orepasses because of blockage, damage, or the lack of other orepasses close to the orebody. In these situations, LHDs can load directly onto trucks but this reduces productivity. Blasting constraints at Malmberget are designed to reduce the number of seismic events and decrease the vibrations caused by blasting. Each night, on average, five to six blasts are conducted.
Loading issues
Loading at the drawpoint is sometimes stopped early because of loading issues, such as hang-ups, brow failure, pillar failure, intrusions, poor fragmentation, or ring freezing. If a hang-up is encountered in the Malmberget mine, it is first handled by the operator using the LHD bucket to resume the material flow. If the operator is unable to release the hangup, it is inspected and classified as a high hang-up or a low hang-up. The material can be loaded from the adjacent drift to try to loosen and release low hang-ups, while a production ring can be blasted in the adjacent drift to release high hangups. Low hang-ups caused by big boulders are sometimes drilled and blasted by a special crew.
Some orebodies in Malmberget contain waste intrusions. Production rings with a very high percentage of waste intrusion (visualized in the WOLIS system) are not drilled but left intact. A new opening is made, the next set of production rings is drilled and blasted, and loading is continued. The mine is contemplating changing this practice, as it causes problems with reinforcement and caving. In the future, the mine plans to drill and blast the ring but not load the material. Orepasses in Malmberget mine have no grizzly ore boulder breakers. Instead, boulders are transported to a separate drift where they are broken by drilling and blasting.
Draw control strategy at Kiirunavaara mine
Kiirunavaara mine is the largest underground iron ore operation in the world. SLC is the mining method practised. The Kiirunavaara orebody consists of magnetite ore with magmatic intrusions. The orebody stretches about 4 km along strike in the N 10° E direction with an average width of around 80 m, dipping at about 60° SE towards Kiruna city (Nordqvist and Wimmer, 2014). The average iron content of the orebody is 64% (Nordqvist and Wimmer, 2014).
Loading criteria
The loading criterion In the Kiirunavaara mine is the extraction ratio, which is the ratio of the total tonnage of material loaded from the drawpoint to the estimated tonnage of the ring. Loading from a blasted ring is continued until the extraction ratio has reached the target value communicated by loading control.
Loading constraints
The Kiirunavaara mine produced around 26.9 Mt of crude ore in 2016 (LKAB, 2016). Average tonnage of a production ring at the mine can vary from 7 000 to 12 000 t, which translates into more than 3000 rings per year. The average mine grade and shut-off grade vary and are decided by the mine. The current average mine grade is 45% Fe, and the current shut-off grade is 30% Fe (Shekhar, Gustafson, and Schunnesson, 2017). This means that the target average grade for crude ore mined throughout the year is 45% Fe, and a drawpoint should be closed when the grade of the material being loaded falls below 30% Fe. The average mine grade and shut-off grade can change depending on mine conditions and are revised periodically by mine management. The ability to change grade values is essential in order to maintain a profitable operation, but the changed value should be reflected in the draw control strategy by adjusting either the extraction ratio targets or production capacity.
Mining constraints for draw control
In the initial mining sequence in a mining level at Kiirunavaara, the cave front is kept flat; i.e. it is moved uniformly along the adjacent drifts of the mining level. As production advances, the flat front pattern changes to a V-shape. The V-shaped cave front can change depending on the mining sequence in nearby mining blocks, seismicity, and structural stability of the drifts in the block. In general, the cave front converges towards the entrance crosscut. Figure 7 shows an example of a mining sequence at Kiirunavaara. Mining blocks with structurally unstable areas are prioritized for blasting and loading.

Twelve active production areas are required to achieve the production target. Each production area needs two to three active drawpoints. Like Malmberget, Kiirunavaara is constrained by seismicity and blasting. The mine also has constraints based on vibration levels in the nearby city of Kiruna, but this is not a source of concern for the mine itself. Mine seismicity is a constraint during operations and affects the sequence of mining in the mining blocks; the number of blasts in a particular mining block is limited to reduce seismicity. Orepass availability is another mine constraint that affects production scheduling. Issues related to seismicity and orepass availability are taken into account during planning and scheduling.
Loading issues
When a hang-up is encountered at the drawpoint, it is initially handled by the LHD operator. The operator directs the LHD bucket to penetrate the muckpile and release the hang-up by disturbing the muckpile at the draw point. The ability of the operator to handle the hang-up depends on the nature of the hang-up and the operator's experience. A high hang-up is difficult to manipulate using the LHD bucket, but a low hang-up can often be resolved. If the operator is unable to handle the hang-up, water jets are used to release it. In other cases, low hang-ups caused by boulders are drilled and blasted. If the hang-up persists, the next production ring is drilled and blasted. In Kiirunavaara mine, boulders are broken by a stationary, remotely controlled rock breaker located at the grizzly at the top of the orepass. Nonetheless, boulders are frequently encountered in the orepass and in the lower output of the orepass. This causes problems when material is being loaded onto the train from the orepasses and is handled either by blasting or by using water jets.
Qualitative comparison of current draw control strategies
Detailed descriptions of draw control strategies used at sublevel caving mines around the world are normally not published in the open literature, making it difficult for researchers to objectively assess their quality. Table III summarizes important factors for a draw control strategy and notes whether these are considered in the available draw control strategies. The table does not, however, comment on the validity of the factors. For example, the dilution entry method uses dilution behaviour (Bull and Page, 2000), but recent marker trials (Brunton, 2009; Nordqvist and Wimmer, 2014; Power, 2004; Wimmer etal., 2015) show that the inclusion of dilution behaviour may be incorrect. Similar arguments can be put forward about other methods.
Recent marker trials highlight the chaotic and random nature of material flow in SLC. Draw control strategies based on ore flow prediction models suffer from a lack of complete knowledge of the chaotic and random nature of material flow. Other control strategies lack a robust drawpoint monitoring system and rely on mill grade to assess drawpoint performance. The draw control strategies in Table III are assessed the based on 10 factors. From a critical review of the published literature, a qualitative assessment can be performed to score the different draw control strategies and comment on their use in mines (Table IV). The score of each draw control strategy is augmented by 1 for each of the 10 factors mentioned in Table III that it takes into consideration e.g. a score of 7 out of 10 is given to the REBOP model as it considers 7 out of the 10 factors based on the review of published literature (Table IV). The assessment shows that traditional draw control strategy, dilution entry method, and non-dilution methods are not recommended for draw control purposes. Other methods discussed would benefit significantly from either model improvement or improvement in drawpoint monitoring technologies.
Guidelines for designing a new draw control strategy
An optimized draw control strategy is vital to ensure improved ore recovery and reduced dilution. It will give SLC mines the flexibility to change their production strategy to better align with production demands and metal prices. Based on the literature review and our baseline mapping study, we propose the following guidelines for a new draw control strategy:
1. Effective drawpoint monitoring system: The non-uniform nature of material flow in SLC requires constant monitoring to control dilution while also recovering more ore at the drawpoint. New drawpoint monitoring technologies (e.g. XRF, spectroscopy) must be developed to monitor material grade for copper, gold, or other metals being mined using caving operations. However, for certain cases such as diamond mining, sampling is difficult and 'observational' assessments of dilution are required or other indicators for drawpoint monitoring should be created. A drawpoint monitoring system that can provide a reasonably accurate estimate of the material grade loaded is a requirement for an efficient draw control strategy.
2. Clearly defined production demands and grade controls: The mine should have well-defined production demands in terms of production targets, active drawpoint requirements, and sequencing schemes. Cut-off and shut-off grades should be included in the draw control strategy as well, while grade control should include marginal operating costs and metal prices to provide a more accurately calculation of the average ore grade and shut-off grade.
3. Sensitivity to mine design and ore geometry: A dynamic draw control strategy should be sensitive to the mine design and ore geometry. Basic ore flow principles, results from experiments, and past production data can provide a framework to optimize draw control to a mine's specific design and ore geometry requirements.
4. Careful assessment of dilution behaviour: The results of past studies show that dilution entry in its present form cannot be a useful parameter for judging drawpoint performance because of the non-uniform or chaotic nature of ore flow. A new method based on production data or other mine-specific parameters for dilution entry and total dilution calculation needs to be developed. An assessment of dilution behaviour is required to decide which aspects of dilution, if any, should be included in the draw control.
5. Influence of proximate drawpoint: Marker trials have shown that secondary and tertiary recovery play an important role in ore recovery. The performance of the drawpoints above a blasted ring has an influence on the ore grade that will be extracted from the drawpoint. However, certain assumptions, for example assuming low extraction ratios in upper levels will translate into more ore at levels below, should not be made because of the chaotic nature of the material flow. A suitable parameter to measure the ore potential from above levels needs to be defined and used in correlational analysis to understand the effects of secondary and tertiary recovery on drawpoint performance. An efficient draw control strategy needs to include such correlations between proximate drifts to better predict drawpoint performance.
6. Mine experience: The performance of drawpoints and the nature of material flow can vary from mine to mine. Historical data on drawpoint abandonment and other performance-related information can provide a baseline for assessing loading issues. A draw control strategy can use this information to reduce dilution and improve ore recovery. Mine personnel observe different aspects of loading during their working hours. They are also familiar with production-related problems. Conducting a qualitative analysis of the information collected from personnel can yield useful results.
Concluding remarks
The current draw control strategies at Kiirunavaara and Malmberget mines are guided by a bucket-weight-based drawpoint monitoring system. The loading criteria at Kiirunavaara mine use the extraction ratio as the primary input information for draw control. Malmberget mine has slightly more flexible loading criteria and uses both extraction ratio and trend of bucket grade as the primary input information. However, both employ a draw control strategy that considers the production requirements and mining constraints and regulates the loading process through a continuous drawpoint monitoring system. This continuous drawpoint monitoring system has yielded a large amount of production data in the past 10 years.
The mines currently use an empirical method based on bucket weights and grades. However, there is an opportunity to create a new draw control strategy using the above guidelines. The model must be probabilistic to capture the uncertainties and variations in the caving process and must depend on a robust bucket-weight-based drawpoint monitoring system. Such a model could aim at grade forecasting at the drawpoint and assist in evaluating the economic performance of the drawpoint. The aim of a draw control strategy should be to provide information on when to close an active drawpoint, not to predict material flow. Therefore, draw control is an operational issue and, as such, it should be guided by production data, mine economics, and safety.
Acknowledgement
The authors acknowledge LKAB for its financial and infrastructural support. The authors are also grateful for valuable inputs and support from the staff and management of the Malmberget and Kiirunavaara mines. Agio System och Kompetens AB, Boliden Mineral AB, ABB AB, and RTC are also acknowledged for their valuable input to the project. Finally, Vinnova, the Swedish Energy Agency and Formas are acknowledged for partly financing this project through the SIP-STRIM programme.
References
Adlerborn, B. and Selberg, M. 2008. GIRON and WOLIS - Two mine applications. Proceedings of the 5th International Conference and Exhibition on Mass Mining2008, Division of Mining and Geotechnical Engineering, Luleá University of Technology, 9-11 June 2008. Schunnesson, H. and Nordlund, E. (eds). pp. 637-642. [ Links ]
Baase, R.A., Diment, W.D., and Petrina, A.J. 1982. Sublevel caving at Craigmont Mines Ltd. Underground Mining Methods Handbook. Hustrulid, W.A. (ed.). Society of Mining Engineers of the American Institute of Mining, Metallurgical and Petroleum Engineers, Inc., New York. pp. 898-915. [ Links ]
Booth, G., Gaspar, E., Dunham, S., and Sharrock, G. 2004. Visual grade control techniques and sub-level cave draw optimisation - Perseverance Nickel Mine, Leinster, Western Australia. Proceedings of the 4th International Conference and Exhibition on Mass Mining 2004, Santiago, Chile, 22-25 August 2004. Karzulovic, A. and Alfaro, M.A. (eds). Instituto de Ingenieros de Chile. pp. 646-649. [ Links ]
Brunton, I. 2009. The impact of blasting on sublevel caving material flow behaviour and recovery. Doctoral thesis, University of Queensland, Australia. [ Links ]
Bull, G. and Page, C.H. 2000. Sublevel caving-today's dependable low-cost 'ore factory'. Proceedings of the 3rd International Conference and Exhibition on Mass Mining 2000, Brisbane, Queensland, Australia, 29 October-2 November 2000. Australasian Institute of Mining and Metallurgy, Melbourne. pp. 537-556. [ Links ]
Castro, R., Gonzalez, F., and Arancibia, E. 2009. Development of a gravity flow numerical model for the evaluation of draw point spacing for block/panel caving. Journal of the Southern African Institution of Mining and Metallurgy, vol. 109, no. 7. pp. 393-400. [ Links ]
Castro, R., Trueman, R., and Halim, A. 2007. A study of isolated draw zones in block caving mines by means of a large 3D physical model. International Journal of Rock Mechanics and Mining Sciences, vol. 44, no. 6. pp. 860-870. [ Links ]
Chitombo, G. 2010. Cave mining: 16 years after Laubscher's 1994 paper 'Cave mining-state of the art'. Mining Technology, vol. 119, no. 3. pp. 132-141. [ Links ]
Cokayne, E.W. 1982. Sublevel caving. Chapter 1: Introduction. Underground Mining Methods Handbook. Hustrulid, W.A. (ed.). Society of Mining Engineers of the American Institute of Mining, Metallurgical and Petroleum Engineers Inc., New York, USA. pp. 872-879. [ Links ]
Cundall, P., Mukundakrishnan, B., and Lorig, L. 2000. REBOP (Rapid Emulator Based on PFC3D) formulation and user's guide. The International Caving Study. I. Brown, E.T. (ed.). JKMRC and Itasca Consulting Group, Inc., Brisbane, Australia. [ Links ]
Davison, J. 1996. Assessment of the loadrite scoop weighing system. Internal report, Kiirunavaara mine, Sweden. LKAB. [ Links ]
Diering, T. 2007. Template mixing: a depletion engine for block cave scheduling. Proceedings of the 33rd International Symposium on Application of Computers and Operations Research in the Mineral Industry (APCOM), Santiago, Chile, 24-27 April. Magri, E.J. (ed.). Gecamin Ltda, Santiago. pp. 313-320. [ Links ]
Gustafsson, P. 1998. Waste rock content variations during gravity flow in sublevel caving, Analysis of full-scale experiments and numerical simulations. Doctoral thesis, Luleá Tekniska Universitet, Luleá, Sweden. [ Links ]
Gustafson, A., Schunnesson, H., Galar, D., and Kumar, U. 2013. Production and maintenance performance analysis: manual versus semi-automatic LHDs. Journal of Quality in Maintenance Engineering, vol. 19, no. 1. pp. 74-88. [ Links ]
Halim, A.E. 2006. Study of the influence of interactive draw upon drawpoint spacing in block and sublevel caving mines. Doctoral thesis, University of Queensland, Australia. [ Links ]
Hancock, F.T. and Mattson, R.S. 1982. Sublevel caving at Granduc. Underground Mining Methods Handbook. Hustrulid, W.A. (ed.). Society of Mining Engineers of the American Institute of Mining, Metallurgical and Petroleum Engineers Inc., New York, USA. pp. 916-922. [ Links ]
Jamieson, M. 2012 . Development of sub level cave draw optimisation at Newcrest Mining. Proceedings of the 6th International Conference and Exhibition on Mass Mining2012, Sudbury, Ontario, Canada, 10-14 June 2012. Canadian Institute of Mining, Metallurgy and Petroleum, Montreal. [ Links ]
Klemo, S. 2005. Styrning av raslastning med hjâlp av skopvág i Kiirunavaaragruvan [Loading control with help from bucket weight in Kiirunavaara mine]. Bachelor's thesis, Luleá University of Technology, Luleá, Sweden. [ Links ]
Kvapil, R. 1982. The mechanics and design of sublevel caving systems. Underground Mining Methods Handbook. Hustrulid, W.A. (ed.) Society of Mining Engineers of the American Institute of Mining, Metallurgical and Petroleum Engineers Inc., New York, USA. pp. 880-897. [ Links ]
Laubscher, D. 1994. Cave mining - the state of the art. Journal of the South African Institute of Mining and Metallurgy, vol. 94, no. 10. pp. 279-293. [ Links ]
Laubscher, D.H. 2000. Block caving manual. Prepared for International Caving Study. JKMRC and Itasca Consulting Group, Brisbane. [ Links ]
LKAB. 2016. Annual and sustainability report, 2016. https://www.lkab.com/globalassets/lkab-moderbolag/dokument/finansiellinformation/arsredovisning/2016_lkab_ars_ och_hallbarhetsredovisning.pdf [ Links ]
Lund, C. 2013. Mineralogical, chemical and textural characterisation of the Malmberget iron ore deposit for a geometallurgical model. Doctoral thesis, Luleá University of Technology, Sweden. [ Links ]
McMurray, D.T. 1982. Sub-level caving practice at Shabanie mine, Rhodesia. Underground Mining Methods Handbook. Hustrulid, W.A. (ed.). Society of Mining Engineers of the American Institute of Mining, Metallurgical and Petroleum Engineers Inc., New York, USA. pp. 945-952. [ Links ]
Nickson, S.D., Niemi, R., Pegues, C., and Santi, J. 2012 . Sublevel cave practices at the Frood-Stobie Complex. Proceedings of the 6th International Conference and Exhibition on Mass Mining 2012, Sudbury, ontario, Canada, 10-14 June 2012. Canadian Institute of Mining, Metallurgy and Petroleum, Montreal. [ Links ]
Nordqvist, A. and Wimmer, M. 2014. Large scale field test of gravity flow at the Kiruna mine. Proceeding of the Sixth Aachen International Mining Symposium on High Performance Mining. Institute of Mining Engineering, RWTH Aachen University, Aachen, Germany. pp. 621-636. [ Links ]
Pierce, M.E. 2010. A model for gravity flow of fragmented rock in block caving mines. Doctoral thesis, Sustainable Mining Institute, University of Queensland, Australia. [ Links ]
Power, G.R. 2004. Modeling granular flow in caving mines: Large scale physical modeling and full scale experiments. Doctoral Thesis, Julius Kruttschnitt Mineral Research Centre, University of Queensland, Australia. [ Links ]
Power, G.R. and Campbell, A.D. 2016. Modelling of real-time marker data to improve operational recovery in sublevel caving mines. Proceedings of the Seventh International Conference and Exhibition on Mass Mining (MassMin 2016), Sydney. Australasian Institute of Mining and Metallurgy, Melbourne. pp. 105-109. [ Links ]
Quinteiro, C.R., Larsson, L., and Hustrulid, W. 2001. Theory and practice of very-large-scale sublevel caving. Underground Mining Methods: Engineering Fundamentals and International Case Studies. Hustrulid, W.A. and Bullock, R.L. (eds). Society for Mining, Metallurgy and Exploration, Littleton, Colorado, USA. pp. 381-384. [ Links ]
Salinas, D.V. 2001. Calibration of a mixing model for sublevel caving. Master's thesis, Faculty of Graduate Studies, university of British Columbia, Vancouver, Canada. [ Links ]
Sarin, D.K. 1981. A review of sub-level caving practices in Canada. Proceedings of the International Conference on Caving and Sublevel Stoping, Design and Operation of Caving and Sublevel Stoping Mines, Denver, Colorado, 8 July 1981. Society of Mining Engineers of the American Institute of Mining, Metallurgical, and Petroleum Engineers. pp. 373-385. [ Links ]
Selldén, H. and Pierce, M. 2004. PFC3D modelling of flow behaviour in sublevel caving. Proceedings of the 4th International Conference and Exhibition on Mass Mining2004, Santiago, Chile, 22-25 August 2004. Karzulovic, A. and Alfaro, M.A. (eds). Instituto de Ingenieros de Chile. pp. 22-25. [ Links ]
Shekhar, G., Gustafson, A., Boeg-Jensen, P., and Schunnesson, H. 2016. Draw control optimization along the production drift in sublevel caving mines. Proceedings of the Seventh International Conference and Exhibition on Mass Mining (MassMin 2016), Sydney. Australasian Institute of Mining and Metallurgy, Melbourne. pp. 241-249. [ Links ]
Shekhar, G., Gustafson, A., and Schunnesson, H. 2017. Loading procedure and draw control in LKAB's sublevel caving mines: baseline mapping report. Research report, Luleá university of Technology, Sweden. 60 pp. [ Links ]
SMITH, M. and RAHAL, D. 2001. Draw control optimization in the context of production scheduling. Proceedings of the 17th International Mining Congress and Exhibition of Turkey (INCET2001). Chamber of Mining Engineers of Turkey, Ankara. pp. 831-838. [ Links ]
Villa, D. and Diering, T. 2010. A new mine planning tool for sublevel caving mines. Proceedings of the Second International Symposium on Block and Sublevel Caving, Australian Centre for Geomechanics, Perth, Australia, 20-22 April 2010/ Potvin, Y. (ed.). pp. 237-252. http://cn.geovia.com/sites/default/files/whitepaper/PCBC_ NewMinePlanningToolSublevelCaving.pdf [accessed 11 December 2015]. [ Links ]
Wimmer, M., Nordqvist, A., Ouchterlony, F., Selldén, H., and Lenz, G. 2012. 3D mapping of sublevel caving (SLC) blast rings and ore flow disturbances in the LKAB Kiruna mine. Proceedings of the 6th International Conference and Exhibition on Mass Mining 2012, Sudbury, Ontario, Canada, 10-14 June 2012. Canadian Institute of Mining, Metallurgy and Petroleum, Montreal. [ Links ]
Wimmer, M., Nordqvist, A., Righetti, E., Petropoulos, N., and Thurley, M. 2015. Analysis of rock fragmentation and its effect on gravity flow at the Kiruna sublevel caving mine. Proceedings of the 11th International Symposium on Rock Fragmentation by Blasting, Sydney, Australia, 24-26 August 2015. Spathis, A.T., Gribble, D.P., Torrance, A.C., and Little, T.N. (eds). Australasian Institute of Mining and Metallurgy, Melbourne. pp. 775-792. [ Links ]
Zhigui, Z. and Xingguo, L. 2008. Non-dilution draw method and its application in sub-level caving mines in China. Proceedings of the 5th International Conference and Exhibition on Mass Mining2008, Division of Mining and Geotechnical Engineering, Luleá university of Technology, Luleá, Sweden 9-11 June 2008. Schunnesson, H. and Nordlund, E. (eds). pp. 275-284. [ Links ] ♦
Paper received Aug. 2017
revised paper received Nov. 2017

