


Serviços Personalizados
Artigo
 Inglês (pdf)
 Artigo em XML
 Referências do artigo
Indicadores

Links relacionados
-
 Citado por Google
 -
 Similares em Google
Compartilhar

 Permalink
Journal of the Southern African Institute of Mining and Metallurgy
versão On-line ISSN 2411-9717
versão impressa ISSN 2225-6253
J. S. Afr. Inst. Min. Metall. vol.118 no.7 Johannesburg Jul. 2018
http://dx.doi.org/10.17159/2411-9717/2018/v118n7a1
PAPERS OF GENERAL INTEREST
Virgin rock temperatures and geothermal gradients in the Bushveld Complex
M.Q.W. Jones
School of Geosciences, University of the Witwatersrand, South Africa
SYNOPSIS
Knowledge of virgin rock temperature (VRT) is essential for planning refrigeration and ventilation requirements of deep mines. Geothermal studies in the goldfields of the Witwatersrand have been in progress for approximately 80 years, with the result that a very extensive rock temperature database is available. However, it is only in the last three decades that deep-level platinum mining in the Bushveld Complex, north of the Witwatersrand Basin, has made mine refrigeration an important issue. This paper presents temperature profiles in 31 boreholes in the Bushveld Complex that were surveyed as part of a project, conducted between 1985 and 2005, aimed at establishing the geothermal characteristics of the Complex. Most of the boreholes are located in platinum mining areas or prospects situated around the perimeter of the Complex. The geothermal gradient in rocks of the Main Zone of the Complex, which immediately overlie the platinum reefs, is remarkably constant at 20.7±1.3 K/km. Data from the Upper Zone and the Bushveld granites yield lower gradients, 16.5±1.1 K/km and 16.4±2.4 K/km respectively. Geothermal gradients in the Bushveld Complex are approximately double the thermal gradients in the Witwatersrand. The geothermal heat flux in the platinum mining areas, calculated from the thermal gradients and thermal conductivity data measured on samples of borehole core, is also remarkably uniform at 45±4 mW/m2; this is somewhat less than the average for Witwatersrand gold mining areas, 51±6 mW/m2. The main reason for the higher gradients in the Bushveld Complex is the low thermal conductivity of the rocks. Bottom-hole temperature measurements in boreholes in the Northam mining area of the Complex yield the highest virgin rock temperatures (up to 70°C at 2.2 km depth). This is 30°C hotter than the temperature at the same depth in mines in the Carletonville area of the Witwatersrand Basin. The surface temperature data and heat flow data, together with an extensive thermal conductivity database, make it possible to predict VRTs in new platinum mining areas as well as chromium and vanadium mines if such mining proceeds to substantial depths.
Keywords: Bushveld Complex, platinum mines, virgin rock temperature, geothermal gradient, heat flux.
Introduction
South Africa is endowed with an enormous mineral wealth, with the result that mining is one of the main pillars of the economy. Advances in technology in the last five decades have permitted mining at increasingly deeper levels. Increased mining depth means an increase in virgin rock temperature (VRT), which results in increased heat loads on underground workings (e.g. Rawlins, Phillips and Jones, 2002; Jones, 2003a). This is particularly relevant in the goldfields of the Witwatersrand, where mining approaches 4 km in depth, and in the Bushveld Complex, where platinum mines exceed 2 km depth. Because it is necessary to control the working environment, mine refrigeration and ventilation are important considerations when planning such deep-level mining. This planning requires knowledge of the VRT as well as the thermal properties of the rocks surrounding underground workings.
Gold has been mined in the Witwatersrand Basin (Figure 1) for more than 100 years, and geothermal research has been conducted for approximately 80 years. The earliest rock temperature studies (Weiss, 1938; Bullard, 1939; Krige, 1939) showed that the geothermal gradients are relatively low in the Witwatersrand. This has been confirmed by routine VRT measurements made in mines since 1950 down to maximum rock-breaking depth, where the VRT exceeds 65°C (Jones, 2003a). In the 1980s a detailed thermal investigation of the Witwatersrand Basin was conducted by the University of the Witwatersrand (Wits) in collaboration with the Chamber of Mines Research Organization (COMRO, now CSIR Mining Technology), and major mining companies. This resulted in an extensive compilation of VRT data in the basin and thermophysical properties of the main rock types. It also allowed for calculation of numerous determinations of the heat flux through the Earth's crust. Details of the results are reported by Jones (1988, 2003a, 2003b).
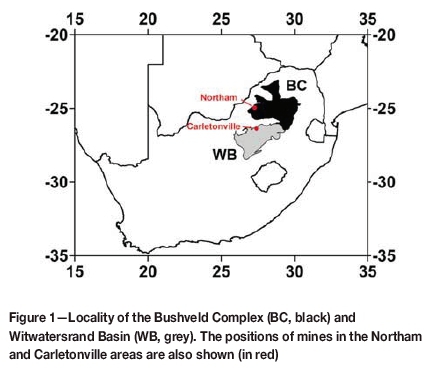
During the Witwatersrand project, platinum mining in the Bushveld Complex north of the Witwatersrand Basin (Figures 1 and 2) was increasing in depth and it became obvious that a similar investigation of the Complex was necessary. The importance of this was made clear by two early measurements that indicated that the geothermal gradients were approximately double those in the Witwatersrand Basin (Carte and van Rooyen, 1969). The ensuing collaborative research project between Wits, COMRO, the Geological Survey of South Africa (now the Council for Geoscience) and major mining houses resulted in an extensive database constituting rock temperature measurements in boreholes distributed in the main mining areas, nearly 1000 measurements of the thermal properties of Bushveld rocks and 31 new values for the heat flux through the Earth's crust. The latter two aspects of the project have been reported on in detail by Jones (2015, 2017).
This paper focuses on rock temperatures and geothermal gradients. It reports on temperature measurements made in boreholes situated in the main platinum mining areas as well as some in the interior of the Bushveld Complex. It discusses relevant aspects of thermal conductivity measurements on Bushveld rocks and determinations of heat flux. It provides a comparison with geothermal data from the Witwatersrand Basin and shows how the VRT in unexplored regions of the Complex can be estimated from existing geothermal data. This has implications for mine refrigeration studies for new platinum mines as well as future chromium and vanadium mines if they should become deeper.
Geological background
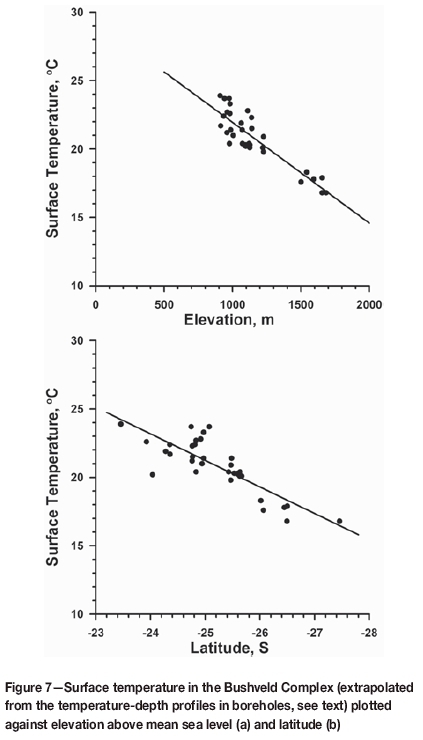
The geological terrain in which the Bushveld Complex is located is known as the Kaapvaal Craton. This Archaean cratonic nucleus, represented by basement granitic rocks and greenstone belts, developed between 3700 and 2650 Ma ago (Eglington and Armstrong, 2004), by which time it had largely stabilized. During this period, and subsequently, relatively undeformed stratified basins formed on the craton. The stratigraphy of these basins is shown in Figure 3. The oldest, the Witwatersrand Basin (Figure 1), hosts the largely volcanic Dominion Group (ca. 3100 Ma) (Marsh, 2007), overlain by the largely sedimentary Witwatersrand Supergroup (3000-2700 Ma) (McCarthy, 2007), and followed by the largely volcanic Ventersdorp Supergroup (2700 Ma) (van der Westhuizen, de Bruijn, and Meintjies, 2007). Subsequent deposition of platform strata of the Transvaal Supergroup (2650-2200 Ma) (Erikkson, Altermann and Hartzer, 2007) occurred in the Transvaal Basin, which overlies the Witwatersrand Basin and an extensive area of Archaean basement rocks further north. The next important geological event to affect this part of the Kaapvaal Craton was extrusion of the Rooiberg Group ca. 2070 Ma (Buchanan, 2007) and emplacement of plutonic rocks of the Bushveld Complex into the northern part of the Transvaal Basin at 2060 Ma (Figures 1 and 2) (Zeh et al., 2015; Mungall, Kamo and McQuade, 2016). Parts of the Witwatersrand Basin and the southern Bushveld Complex are covered by sedimentary rocks of the 300-200 Ma old Karoo Supergroup (Johnson et al., 2007).
The geology of the Bushveld Complex is shown in Figure 4, which is a sub-outcrop map showing the surface and inferred subsurface distribution of the main rock units below the Karoo cover (after Cairncross and Dixon, 1995). A simplified stratigraphic column of the Complex is shown in the right side of Figure 3.
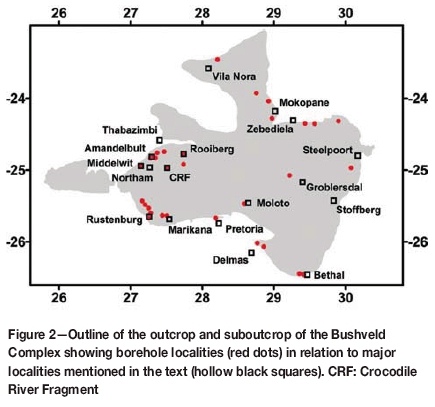
The Bushveld Complex is a huge igneous province that occupies an area of more than 65 000 km2 (Cawthorn et al., 2007). There are two main subdivisions, a lower, older mafic to ultramafic phase, known as the Rustenburg Layered Suite, and a younger, upper granitic phase comprising the Rashoop Granophyre Suite and the Lebowa Granite Suite, usually referred to collectively as 'Bushveld granite' (Figures 3 and 4). The Rustenburg Layered Suite occurs in four main lobes (Figures 2 and 4). The western lobe extends from Pretoria to Thabazimbi, the northern lobe is mainly north of Mokopane, the eastern lobe from Zebediela to Stoffberg and the southern lobe (which is hidden by Karoo cover) extending as far south as Bethal.
Stratigraphically, the Rustenburg Layered Suite is conveniently divided into five zones (Figure 3). The Marginal Zone consists mainly of norite with some pyroxenite. The Lower Zone is ultramafic, dominated by pyroxenite, harzburgite, and dunite. The lower part of the Critical Zone is essentially pyroxenite, whereas the upper part is represented by cyclic layers of pyroxenite, norite and anorthosite. The Main Zone is predominantly norite and gabbro, with some layers of anorthosite and pyroxenite. The Upper Zone shows more variation in rock type and includes diorite, anorthosite, norite, gabbro and pyroxenite. The Bushveld granites intruded above this sequence.
The Bushveld Complex hosts the world's largest reserves of platinum (and associated platinum group elements), chromium and vanadium (Cawthorn et al., 2007). The main units mined for platinum are the UG2 (Upper Group 2) chromitite layer and the Merensky Reef, which occur in the upper part of the Critical Zone in the eastern and western limbs of the Complex, and the Platreef in the northern limb. Because of its economic value, platinum mining of the UG2 and Merensky reefs now approaches depths of 2 km, which necessitates mine refrigeration. Current mining of the Platreef is by opencast methods, but underground mines are in the development stage. The main units mined for chromium are the LG6 and MG1 (Lower and Middle Group) chromitite layers, which occur deeper (stratigraphically) in the Critical Zone than the UG2 and Merensky Reef. Chromium mines are currently relatively shallow, but if mining proceeds deeper in the future, refrigeration will be required. Vanadium deposits are associated with magnetite-rich layers near the base of the Upper Zone in the eastern, northern, and western limbs of the Complex. Vanadium mines are also opencast at present but could go underground in the future.
Virgin rock temperatures and geothermal gradients
In addition to early borehole temperature measurements in the Witwatersrand Basin, most mining companies have conducted VRT measurements in mine workings since 1950. These data were collated by COMRO and the database provided valuable information regarding the depth to various isotherms in the Witwatersrand gold mining arc (Jones, 1988, 2003a). Although individual mining companies have made in-house VRT measurements in Bushveld mines, there is no similar coordinated VRT database for the Bushveld Complex. One of the main objectives of this investigation was to measure temperatures in exploration boreholes around the Complex in order to provide reliable estimates of the geothermal gradient for mines in the Complex. The methods of measurement and the results are described below.
Borehole temperature measurement
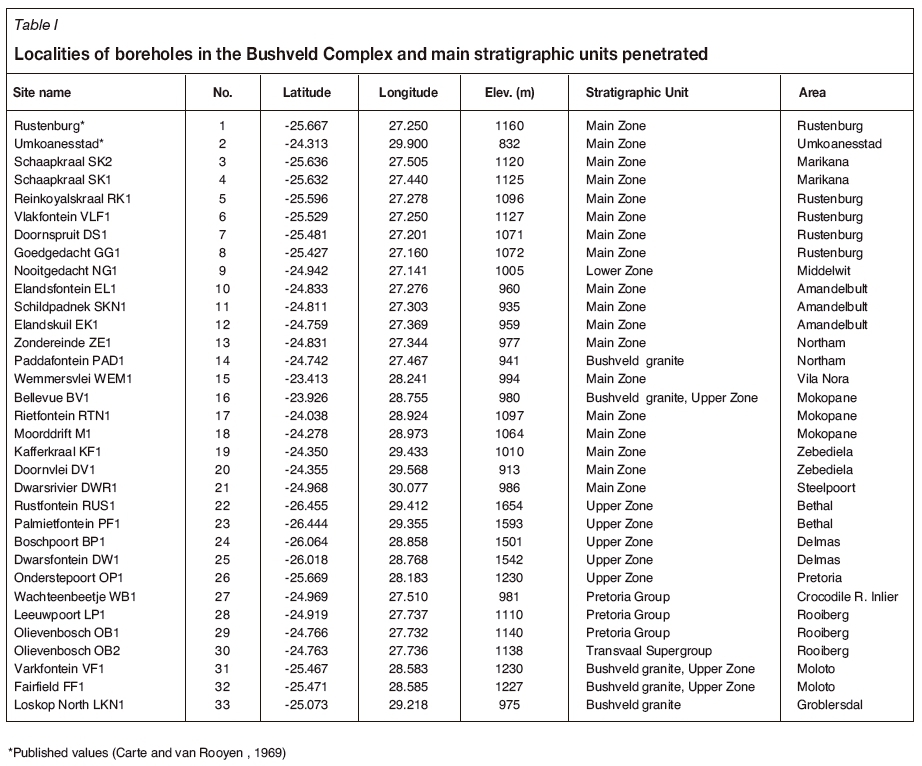
Temperature measurements were made in 31 boreholes (Table I) using electronic temperature probes attached to a cable and lowered by a portable winch. The temperature probes are similar to those described by Jones (1987, 1988). The sensor was either a thermistor or temperature transducer; both devices can detect temperature fluctuations of as little as 0.001 K, and calibration experiments ensured that absolute temperatures were accurate to within 0.01 K. The temperature at each depth was recorded after the probes had been held at the depth for two minutes, which is more than sufficient time for the probes to reach equilibrium. Temperatures were recorded at 10 m or 20 m depth intervals while the probes were being lowered. Depths were recorded using a calibrated depth counter attached to a pulley, over which the cable ran, and are estimated to be accurate to within 10 cm. Thermal gradients between successive temperature measurements were calculated from the field measurements.
Many of the boreholes are located in the platinum mining areas situated around the periphery of the Bushveld Complex, but there are some in the interior of the Complex (Figure 4, Table I). They are named after the original farms on which they are located and can be identified from their serial numbers, which appear in Tables I and II. All boreholes were vertical except for Wachteenbeetje WB1 (Table I), in which case depths were adjusted for borehole inclination. Surveys were conducted sufficiently long after the cessation of drilling so that transients associated with drilling were negligible. The relief surrounding the boreholes is low and only one measurement, Dwarsrivier DWR1 (Table I), required a topographic correction, which was achieved using the method of Jeffreys (1937); tests on two other boreholes with the next most severe surrounding topography yielded corrections less than 1% of the measured thermal gradient. The boreholes penetrated impermeable rock but some underground water flows, associated with fracture systems, were evident in a few boreholes; none of these results were used for the main data compilation described below. In most cases lateral heat conduction due to horizontal thermal conductivity contrasts was considered to be negligible, but see below for a discussion of data from boreholes Nooitgedacht NG1 and Paddafontein PAD1 (Table I).
Results
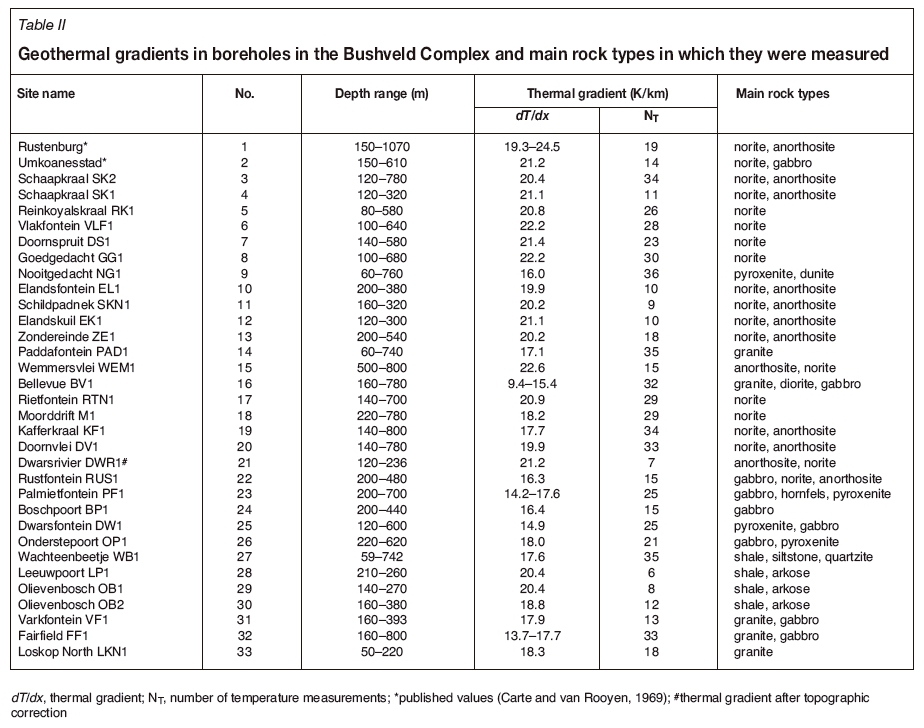
Table I lists borehole localities, elevations, the main stratigraphic units in which temperatures were measured and the areas where the boreholes are located. Table II gives depth ranges displaying linear temperature profiles, average thermal gradients for these depths and the main rock types in which measurements were made.
Borehole positions are shown in Figure 4. Borehole numbers refer to column 2 of Tables I and II. The results of temperature measurements as functions of depth are shown in Figure 5. The latter results are arranged in stratigraphic order, with those in the uppermost rocks being presented first and those in the oldest rocks appearing last. The data in Figure 5 are colour-coded so that results from individual boreholes are evident. The geographic region in which the boreholes occur is indicated in Figure 2. The vertical bars on the temperature axes of Figure 5 indicate the temperature minimum relative to which the borehole data are plotted. Figures 5a and 5b present temperature profiles in Bushveld granite and the Upper Zone of the Complex, respectively. The data from the Main Zone (Figures 5c and 5d) are most relevant to this paper; they are arranged in clockwise order from Marikana through the western and northern limbs of the Complex to the Steelpoort region (Figure 3). Data from one borehole from the Lower Zone are given in Figure 5e. Figure 5f shows results from Transvaal Supergroup and Rooiberg Group lithological units occurring in geological inliers, or fragments, in the interior of the Complex (Figure 4).
The uppermost 100-200 m sections of many boreholes are characterized by a systematic concave temperature curve. This phenomenon is common in South Africa and elsewhere and is caused by increases in ground surface temperature of 1-2°C during the last 200 years (Tyson et al., 1998; Jones, Tyson, and Cooper, 1999). Data showing such curvature was not used in the analyses. Below the curved zone, most boreholes display linear temperature profiles where the temperature data was obtained in a uniform rock type.
Discussion
Geothermal gradients in the Bushveld Complex
The thermal gradients listed in Table II are least-squares fits to the temperature versus depth data in the specified depth intervals. A range of gradients is given in cases where boreholes pass through variable lithologies with different thermal conductivities. The data confirm the early results of Carte and van Rooyen (1969), which indicated that the thermal gradient in the Bushveld Complex is relatively high.
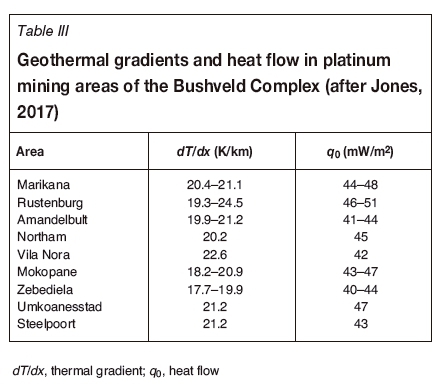
Because of the great depth of some platinum mines, geothermal gradients above these mines are most pertinent. The gradient in individual boreholes, or range of values if more than one borehole was used, for different segments of the platinum mining areas or prospects around the perimeter of the Bushveld Complex are listed in Table III. In most cases the measurements were made in rocks constituting the Main and upper Critical Zones of the Complex, which overlie the main platinum reefs. The thermal gradient is remarkably uniform and averages at 20.7±1.3 K/km.
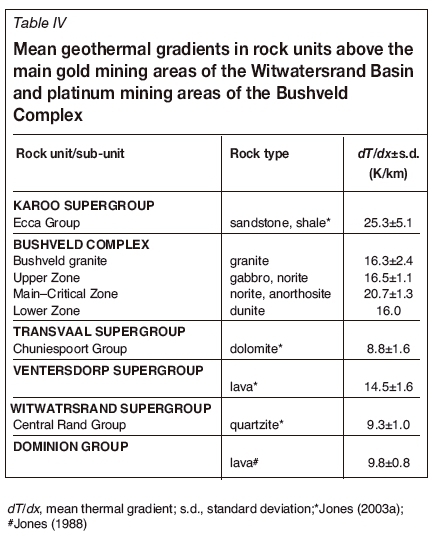
There is also a significant change vertically in the thermal gradient within the Bushveld Complex (Table IV). One measurement in the Lower Zone yielded a gradient of 16.0 K/km (NG1). Eight measurements in the Upper Zone yielded 16.5±1.1 K/km, and three in Bushveld granite yielded 16.3±2.4 K/km.
Thermal conductivity and heat flow
Jones (2015) recently reported on thermal conductivity measurements of more than 900 samples of all major rock types constituting the Bushveld Complex. Average values are listed in Table V. This table also summarizes results of measurements on more than 1000 samples of rocks from the Witwatersrand area (Jones, 2003b). As such, this table represents an almost complete 'thermal conductivity stratigraphy' of the rock groups represented in Figure 3. An important aspect of the data is that many rocks in the Bushveld Complex have conductivities that are one-third to one-half of the conductivity of strata in the Witwatersrand Basin and the overlying Transvaal Supergroup. This has important implications for understanding the geothermal gradients in the two regions.
Jones (2017) combined the borehole temperature data with the thermal conductivity data to make 31 new estimates of the heat flux through the Earth's crust within the Bushveld Complex. Table III lists individual heat flow values including two results previously published by Carte and van Rooyen (1969), or a range of values if more than one measurement is available, for different segments of the platinum mining areas around the perimeter of the Complex. These exclude two exceptionally high values - 66 mW/m2 for Nooitgedact NG1, which is located in relatively high conductivity rocks of the Lower Zone, and 62 mW/m2 for Paddafontein PAD1, which is located in relatively high conductivity Bushveld granite. In both cases the high heat flow can be attributed to heat refraction due to a lateral conductivity contrast with the surrounding rock (Jones, 2017). The overall average for the rest of the data from the perimeter of the complex is tightly constrained at 45±4 mW/m2 (24 values) (Jones, 2017). The few measurements in the interior of the Complex are in pre-Bushveld inliers or Bushveld granite and yield an average heat flow of 51±7 mW/m2 (seven values); the higher heat flow can probably be attributed to enhanced radioactive heat generated by the decay of uranium, thorium, and potassium in the Bushveld granites, which occupy the interior of the Complex (Jones, 2017). The heat flux from the platinum mining areas is actually lower than that from the Witwatersrand goldfields (51±6 mW/m2 (81 values), (Jones, 1988).
Comparison with Witwatersrand Basin and younger stratified rocks
Average values for the thermal gradient of rocks occupying the Witwatersrand Basin and the Transvaal Basin, the intrusive Bushveld Complex, and the younger Karoo sedimentary cover are listed in Table IV. There is an obvious relationship between thermal gradient, rock type, and position in the stratigraphic column (Figure 1). Fourier's Law of heat conduction, which can be written as:

states that thermal gradient (dT/dx) is inversely proportional to thermal conductivity (K) and proportional to surface heat flow (qo) at a particular locality. In most cases, variation of thermal conductivity is the dominant cause of the differences in thermal gradient.
One exception is the thermal gradient in the Dominion Group (Table IV). The boreholes from which the average gradient in this unit was derived are situated on the northwest margin of the Witwatersrand Basin, where the heat flow is amongst the lowest in the world, 33±2 mW/m2 (seven values) (Jones, 1988). Quartzites in the Witwatersrand Supergroup and dolomites in the Transvaal Supergroup have relatively high conductivities (6.4 and 5.1 W/mK respectively, Table V) and concomitantly low thermal gradients. The thermal gradient in Ventersdorp lava is higher than in the quartzites and dolomites because of its lower conductivity (3.4 W/mK, Table V). As discussed below, the high thermal gradients in rocks of the Bushveld Complex are associated with the low conductivities of the most predominant rock types. The highest thermal gradients occur in the young, low-conductivity rocks of the Karoo cover (Table IV).
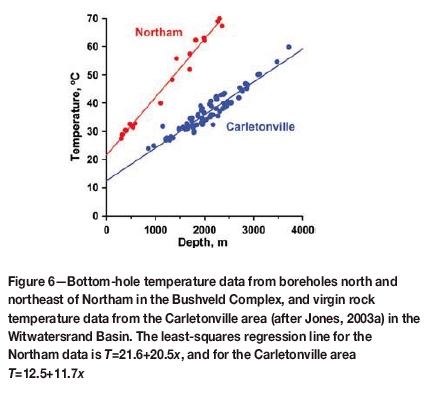
The thermal gradients in Bushveld rocks and particularly those of the Main Zone, which overlie the main platinum mining horizons, are double those for rocks overlying the Witwatersrand goldfields. This means that the VRT must be higher. The difference in thermal regime is clearly illustrated in Figure 6, which compares actual VRT data from the Carletonville area (where the deepest gold mines in the Witwatersrand Basin occur) (Jones, 2003a) with VRT data from the Northam area (which hosts the deepest platinum mines in the Bushveld Complex) (Jones, 2017). The latter data-set comprises bottom-hole temperature measurements from deep exploration boreholes northeast of Northam, which were deemed to be too disturbed by underground water flow to yield reliable thermal gradients, as well as bottom-hole temperatures measured in boreholes listed under Northam and Amandelbult in Table II. The maximum VRT in the Northam area is 70°C at a depth of 2.2 km. This is 30°C hotter than gold mines at equivalent depths in the Carletonville area. As indicated in the previous two subsections, this difference cannot be attributed to an enhanced heat flux in the platinum mining areas, which is lower than that in the gold mining areas. The difference is due to both a higher surface temperature and steeper gradient at Northam compared with Carletonville. The extrapolated surface temperature at Northam is 21.6°C compared with 12.5°C at Carletonville. The reason for this is that Northam is at a lower elevation (1020 m amsl) and latitude (24.95°S) compared with Carletonville (1630 m amsl and 26.40°S). The steeper thermal gradient at Northam (20.5 K/km) compared with Carletonville (11.7 K/km) is largely due to the difference in the thermal conductivities of the rocks in these regions.
Prediction of VRT
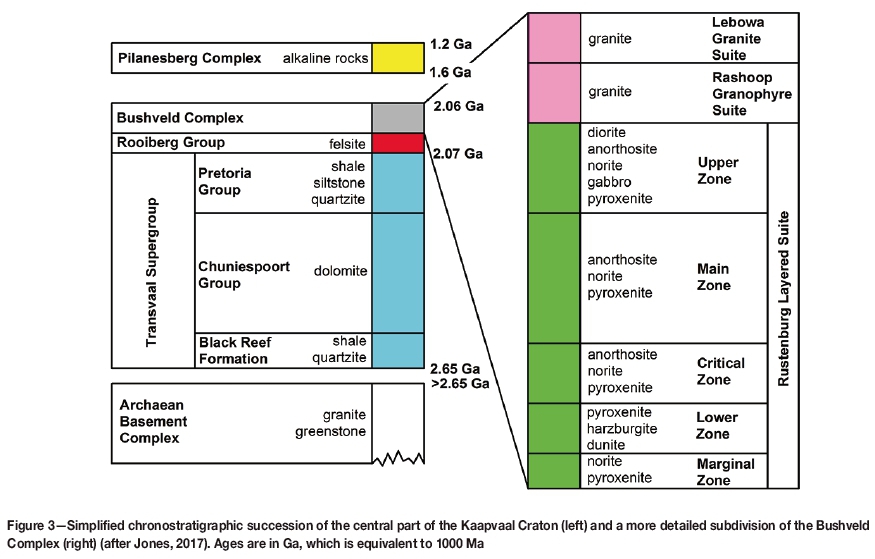
Although there is no substitute for making VRT measurements, reasonably accurate predictions for new prospective mining areas can be made from the data presented in this paper. The mafic rocks of the Bushveld Complex contain very low concentrations of the heat-producing elements uranium, thorium and potassium (Jones, 2017), so the most simple expression for the temperature as a function of depth is given by the following equation:
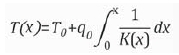
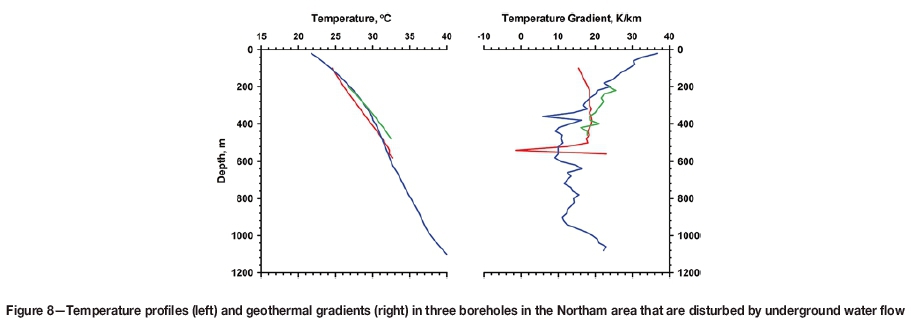
The surface heat flow in the platinum mining areas (q0) is tightly constrained at 45±4 mW/m2. The surface temperature (T0) depends on latitude and altitude, as shown in Figure 7. The local surface temperature lapse rate as a function of elevation is -7.4 K/km, and as a function of latitude -1.9 K per degree. It should be noted that the surface temperatures in these diagrams were obtained by upward extrapolation of temperature-depth data from the deeper linear sections of borehole temperature profiles. These temperatures are higher than mean annual air temperatures because the rainy period in the Bushveld is during the summer, when more heat is transferred into the ground. The thermal conductivities of all important rock types occurring in the Complex are well established, so estimates of thermal conductivity as a function of depth, K(x), can be made provided the stratigraphy is known. Evaluation of the integral then becomes trivial. However, it should be noted that this calculation assumes that the heat flux is linear and vertical. Local horizontal changes in thermal conductivity can lead to a significant component of lateral heat transfer, in which case two-dimensional modelling (Jones, 2003a) would be required. Also, heat may be transferred locally by underground flow of water, which can disturb VRTs appreciably. This is a major issue where mines occur along deep-seated fracture zones in the Earth's crust. Northam is an example. Measured temperature profiles and derived thermal gradients in some boreholes in the Northam area (Figure 8) show clear disturbance by underground water flow, represented by spikes in the temperature profiles and temperature variations that cannot be related to variation of rock type. The temperature profiles in these boreholes are not suitable for establishing geothermal gradients, but their bottom-hole temperatures are useful for establishing the general VRT trend shown in Figure 7.
Conclusions
Geothermal gradients in the platinum mining areas of the Bushveld Complex (17.7-24.5 K/km) are approximately double the gradients in rocks overlying gold reefs of the Witwatersrand Basin (9.6-12.9 K/km). The geothermal heat flux in platinum mining areas of the Bushveld Complex (45 mW/m2) is lower than that in the Witwatersrand goldfields (51 mW/m2). The main reason for the high thermal gradients in the Complex is the relatively low thermal conductivity of the constituent rocks compared with the Witwatersrand Basin. The VRT in the Northam area, the deepest area investigated in the Bushveld Complex, is as much as 30°C higher than the VRT at equivalent depths in the Carletonville area, where the deepest gold mining takes place; this is due both to elevated surface temperatures and thermal gradients in the Bushveld. The Bushveld thermal gradient, heat flux and thermal conductivity database make it possible to predict the VRT in new potential mining areas for platinum and other ores that may be extracted from the Bushveld Complex.
Acknowledgements
The research leading to this publication was made possible by financial and logistical support from the Chamber of Mines Research Organization (now CSIR Mining Technology), General Mining Union Corporation Ltd, the Geological Survey of South Africa (now the Council for Geoscience), Gold Fields of South Africa Ltd, Johannesburg Consolidated Investment Company Ltd, and Impala Platinum Ltd. This project would not have been possible without the assistance of many exploration geologists, too many to name individually; their help is greatly appreciated. Many thanks to Mandy Jones and John Sorour for their help in conducting field surveys, and to Grant Cawthorn and two anonymous referees for critically reviewing this article.
References
Buchanan, P.C. 2007. The Rooiberg Group. The Geology of South Africa. Johnson, M.R., Anhaeusser, C.R., and Thomas, R.J. (eds.). Geological Society of South Africa/Council for Geoscience, Johannesburg/Pretoria. pp. 283-290. [ Links ]
Bullard, E.C. 1939. Heat flow in South Africa. Proceedings of the Royal Society of London, Series A, vol. 173. pp. 474-502. [ Links ]
Cairncross, B. and Dixon, R. 1995. Minerals of South Africa. Geological Society of South Africa, Johannesburg. [ Links ]
Carte, A.E. and van Rooyen, A.I.M. 1969. Further measurements of heat flow in South Africa. Special Publication, vol. 2. Geological Society of South Africa, Johannesburg. pp. 445-448. [ Links ]
Cawthorn, R.G., Eales, H.V., Walraven, F., Uken, R., and Watkeys, M.K. 2007. The Bushveld Complex. The Geology of South Africa. Johnson, M.R., Anhaeusser, C.R., and Thomas, R.J. (eds,). Geological Society of South Africa/Council for Geoscience. Johannesburg/Pretoria. pp. 261-281. [ Links ]
Eglington, B.M. and Armstrong, R.A. 2004. The Kaapvaal Craton and adjacent orogens, southern Africa: a geochronological database and overview of the geological development of the craton. South African Journal of Geology, vol. 107. pp. 13-32. [ Links ]
Eriksson, P.G., Altermann, W., and Hartzer, F.J. 2007. The Transvaal Supergroup and its precursors. The Geology of South Africa. Johnson, M.R., Anhaeusser, C.R., and Thomas, R.J. (eds.). Geological Society of South Africa/Council for Geoscience. Johannesburg/Pretoria. pp. 237-260. [ Links ]
Jeffreys, H. 1937. Disturbances of the temperature gradient in the Earth's crust by inequalities of height. Monthly Notices of the Royal Society, Geophysical Supplement, vol. 4. pp. 309-312. [ Links ]
Johnson, M.R., van Vuuren, C.J., Visser, J.N.J., Cole, D.I., Wickens, H. de V., Christie, A.D.M., Roberts, D.L., and Brandl, G. 2007. Sedimentary rocks of the Karoo Supergroup. The Geology of South Africa. Johnson, M.R., Anhaeusser, C.R., and Thomas, R.J. (eds.). Geological Society of South Africa/Council for Geoscience. Johannesburg/Pretoria. pp. 461-499. [ Links ]
Jones, M.Q.W. 1987. Heat flow and heat production in the Namaqua Mobile Belt, South Africa. Journal of Geophysical Research, vol. 92. pp. 6273-6289. [ Links ]
Jones, M.Q.W. (1988). Heat flow in the Witwatersrand Basin and environs and its significance for the South African shield geotherm and lithosphere thickness. Journal of Geophysical Research, vol. 93, pp. 3234-3260. [ Links ]
Jones, M.Q.W. 2003a. An update in virgin rock temperature analysis of the Witwatersrand Basin. Journal of the Mine Ventilation Society of South Africa, vol. 56. pp. 107-112. [ Links ]
Jones, M.Q.W. 2003b. Thermal properties of stratified rocks from Witwatersrand gold mining areas. Journal of the Southern African Institute of Mining and Metallurgy, vol. 101. pp. 173-185. [ Links ]
Jones, M.Q.W. 2015. Thermophysical properties of rocks from the Bushveld Complex. Journal of the Southern African Institute of Mining and Metallurgy, vol. 115. pp. 153-160. [ Links ]
Jones, M.Q.W. 2017. Heat flow in the Bushveld Complex, South Africa: implications for upper mantle structure. South African Journal of Geology, vol. 120. pp. 231-290. [ Links ]
Jones, M.Q.W., Tyson, P.D., and Cooper, G.R.J. 1999. Modelling climatic change in South Africa from perturbed borehole temperature profiles. Quaternary International, vol. 57/58. pp. 185-192. [ Links ]
Krige, L.J. 1939. Borehole temperature measurements in the Transvaal and Orange Free State. Proceedings of the Royal Society of London, Series A, vol. 173. pp. 450-474. [ Links ]
Marsh, J.S. 2007. The Dominion Group. The Geology of South Africa. Johnson, M.R., Anhaeusser, C.R., and Thomas, R.J. (eds.). Geological Society of South Africa/Council for Geoscience. Johannesburg/Pretoria. pp. 149-154. [ Links ]
McCarthy, T.S. 2007. The Witwatersrand Supergroup. The Geology of South Africa. Johnson, M.R., Anhaeusser, C.R., and Thomas, R.J. (eds.). Geological Society of South Africa/Council for Geoscience. Johannesburg/Pretoria. pp. 155-186. [ Links ]
Mungall, J.E., Kamo, S.L., and McQuade, S. 2016. U-Pb geochronology documents out-of-sequence emplacement of ultramafic layers in the Bushveld Igneous Complex of South Africa. Nature Communications, vol. 7, 13385. doi: 10.1038/ncomms13385 [ Links ]
Rawlins, C.A., Phillips, H.R., and Jones, M.Q.W. 2002. The use of backfill to control heat ingress in deep level mining. Mine Ventilation. Proceedings of the North American 9th US Mine Ventilation Symposium, Kingston, Ontario, Canada. De Souza, E. (ed.). CRC Press, London. pp. 355-361. [ Links ]
Tyson, P.D., Mason, S.J., Jones, M.Q.W., and Cooper, G.R.J. 1998. Global warming in South Africa: evidence from geothermal profiles. Geophysical Research Letters, vol. 25. pp. 2711-2713. [ Links ]
Van der Westhuizen, W.A., de Bruijn, H., and Meintjies, P.G. 2007. The Ventersdorp Supergroup. The Geology of South Africa. Johnson, M.R., Anhaeusser, C.R., and Thomas, R.J. (eds.). Geological Society of South Africa/Council for Geoscience. Johannesburg/Pretoria. pp. 187-208. [ Links ]
Weiss, 0.1938. Temperature measurements with an electrical resistance thermometer in a deep borehole on the East Rand. Journal of the Chemical, Metallurgical and Mining Society of South Africa, vol. 39. pp. 149-166. [ Links ]
Zeh, A., Ovtcharova, M., Wilson, H.C., and Schaltegger, U. 2015. The Bushveld Complex was emplaced and cooled in less than one million years - results of zirconology, and geotectonic implications. Earth and Planetary Science Letters, vol. 418. pp. 103-114. [ Links ] ♦
Paper received June 2017
Revised paper received Oct. 2017

