


Services on Demand
Article
 English (pdf)
 Article in xml format
 Article references
Indicators

Related links
-
 Cited by Google
 -
 Similars in Google
Share

 Permalink
Journal of the Southern African Institute of Mining and Metallurgy
On-line version ISSN 2411-9717
Print version ISSN 2225-6253
J. S. Afr. Inst. Min. Metall. vol.118 n.6 Johannesburg Jun. 2018
http://dx.doi.org/10.17159/2411-9717/2018/v118n6a14
INFACON XV: INTERNATIONAL FERRO-ALLOYS CONGRESS 2018
Influence of the power supply on the behaviour of DC plasma arcs - a modelling study
Q.G. Reynolds
Mintek, South Africa
SYNOPSIS
Direct current (DC) arc furnaces account for a significant proportion of installed pyrometallurgical capacity worldwide. Their applications include steel recycling and smelting of various materials such as ferrochromium, ferronickel, ilmenite, and other alloys. The rectifier power supply for such units is a major capital cost item, and errors in the design can result in considerable limitations being placed on the operating window of the furnace. In the present paper, computational plasma arc models developed using open-source software tools are applied to gain insight into the nature of interactions between the DC rectifier's transient behaviour, passive circuit elements such as smoothing chokes, and the dynamics of the arc. The effect of parameters such as choke inductance and thyristor firing angle is examined and interpreted with regard to possibilities for optimization of the design and operation of DC furnace power supplies in the future.
Keywords: DC arc furnace, power supply, arc dynamics, computational modelling.
Introduction
Open bath electric arc furnaces (EAFs), and in particular direct current (DC) arc furnaces, are used extensively in the metallurgical industry for a number of processes, including steel recycling and the production of ferroalloys such as ferrochromium and ferronickel (Jones, 2014). Many of the unique properties of DC arc furnaces that make them attractive for such processes are results of the presence of one or more plasma arcs, high-temperature, high-velocity jets of ionized gas that conduct electricity between the tip of the graphite electrode and the surface of the molten bath of process material inside the furnace vessel. Arcs are efficient mechanisms for converting electrical energy into thermal and mechanical energy, and act to heat and stir the bath intensely in the areas onto which they impinge (Jones et al., 2011).
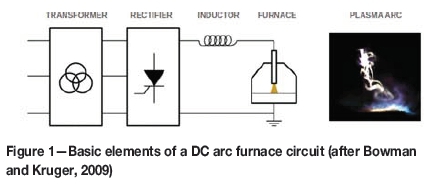
A number of electrical components are required in order to provide power to a DC EAF, as shown in simplified form in Figure 1. From the electrical grid or an equivalent highvoltage alternating current (AC) source, voltage and current are adjusted to appropriate levels using a transformer, then converted to DC using a rectifier - generally a thyristor-type design - and finally passed into the furnace via an inline inductor (Bowman and Kruger, 2009). Over short timescales the power delivered to the furnace is maintained by calculating a current set-point from the measured voltage (using P = VI) and passing that set-point to the power electronics controller in the rectifier, where it is used to adjust the firing angle of the thyristors in the rectifier - this has the effect of constantly modifying the voltage presented across the furnace and inductor circuit. The inductor serves two purposes: first, it filters high-frequency electrical fluctuations from the arc, which can result in undesirable harmonics being injected back through the furnace power supply and into the grid, and secondly, it acts as an energy reservoir to regulate current flow through the arc during these rapid high-frequency fluctuations.
Thyristor rectifiers operate by the regular opening (or 'firing') of thyristors, solid-state semiconductor devices, in a certain pattern so as to permit conduction between pairs of AC phases in a set provided by a transformer. Thyristors allow current to pass in only one direction, and then only after they have received a firing signal; as a result, adjustment of the delay of the firing signal relative to the zero-voltage point between pairs of phases (the 'firing angle') permits control of the output voltage of the rectifier. Once a thyristor is fired, it remains 'latched' in a conducting state until the current it is carrying drops below a certain threshold. Typically, this means that control adjustments to the DC output voltage of a thyristor rectifier can be made only at finite time intervals related to the number of distinct AC phases available from the transformer. Common industrial configurations include 6-, 12-, 18-, and 24-pulse (6, 12, 18, or 24 control actions in one full AC cycle respectively). An example waveform for a three-phase AC, 6-pulse system is shown in Figure 2. The firing angle is indicated, as are the two phase voltages being fired against each other at any given time.
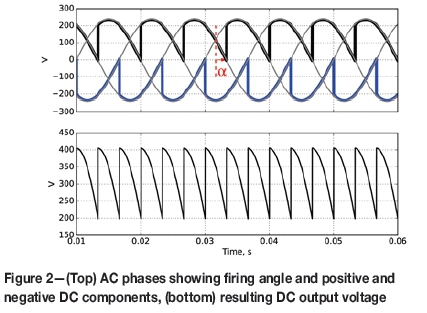
During a single pulse interval, the time-dependent output voltage produced by an ideal thyristor rectifier can be represented as the difference between two sine waves describing the pair of AC voltage phases being fired against one another:
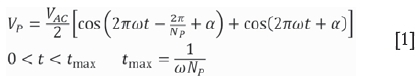
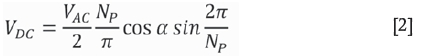
Here, Vp is the rectifier output voltage, Vac is the peak-to-peak voltage of the input AC phases, ω is the input AC frequency, and NPis the number of pulses. The mean DC voltage during a single pulse interval may be derived from Equation [1] as:
The rectifier output voltage Vp feeds a circuit consisting of an inductor and a plasma arc in series. Any variability of current over time generates a voltage across the inductor, which in turn affects the voltage available to the arc. A simple circuit model using an ideal inductor may be constructed as:
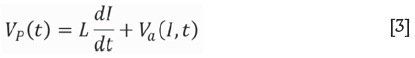
Here, L is the inductance of the inductor, I is the arc current, and Vais the arc voltage.
In the case of an idealized, perfect constant-current rectifier, current does not vary over time and the inductor potential therefore remains zero; in order to achieve this, VP must be controlled to be equal to Va at all times. In the case of a thyristor rectifier (for a single pulse interval), Vp is given by Equation [1] and Va and I both vary as functions of time for the duration of the pulse, depending on the properties of the arc and inductor.
In the present work, some preliminary explorations of Equation [3] are conducted using computational methods to calculate the arc's electrical response, and to evaluate the system behaviour as a function of several parameters relevant to the design and operation of DC furnace power supplies.
Model development
In order to capture the rapid transient behaviour of the plasma arc over short time intervals, a computational magnetohydrodynamic model is used. Such models combine fluid flow, heat transfer, and electromagnetism in a coupled system which is solved using numerical methods. Several assumptions are made: the plasma in the arc is in local thermodynamic equilibrium, in which all physical properties of the plasma fluid are described as complex functions of temperature, and the flow is incompressible, which is valid for low-current arcs in which the velocities do not approach or exceed mach 1. The governing equations for computational plasma arc models under such conditions have been described in more detail elsewhere (Reynolds, 2015, 2017) but are presented here for reference:
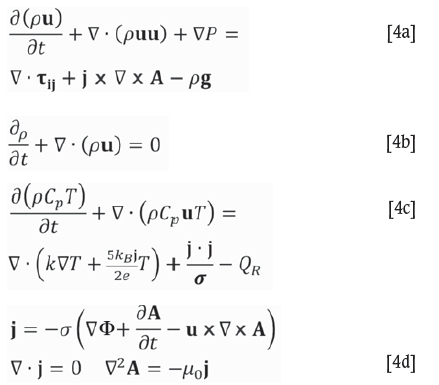
Here, u is the velocity vector field in the arc, P is the pressure field, j is the electric current density, A is the magnetic vector potential, Φ is the electric potential, and T is the temperature field. tij is the viscous stress tensor. ρ is the plasma density, CPis its heat capacity, k is its thermal conductivy, and a is its electrical conductivity. Qr is the volumetric radiation emission coefficient for the plasma (a strong function of temperature), kß is the Boltzmann constant, e is the fundamental charge, and μ0is the magnetic permeability of free space. Boundary conditions must be supplied to complete the solution of Equation [4], and are presented elsewhere (Reynolds, 2015, 2017).
Equation [4] is solved numerically using the finite volume method, in which the geometric region of interest is broken up into a large number of volume elements over which rigorous mass, momentum, and energy balances are performed to give a set of coupled equations for the field values at each element. This set of equations is solved at each discrete time-step in the model using matrix methods. Models used a geometric resolution of 350 000 volume elements for approximately 3 χ 106 degrees of freedom. The models were implemented using version 5.0 of the OpenFOAM® open source computational mechanics framework (OpenFOAM Foundation, 2017), and executed using Linux-based high-performance computing facilities.
The furnace geometry used in the models is shown in Figure 3. The molten bath of process material is at A and is treated as a flat surface forming the anode electrical connection. The body of the graphite electrode is at B, and the conductive tip of the electrode is at C and forms the cathode. Boundary D is open to the atmosphere inside the furnace freeboard. Because of the very rapid nature of arc and rectifier dynamics (of the order of 1 ms) compared to the dynamics of free surface flow in slag or metal melts (of the order of 100 ms), treatment of the anode surface as static for the duration of a rectifier pulse is deemed to be an acceptable approximation. It should be noted, though, that the shape of the anode surface at any given instant is unlikely to be flat as considered here - the arc imparts significant mechanical force to the free surface of the melt and substantial disruption of the interface is expected as a result (Reynolds, 2017). However for the purposes of this study it was felt that consideration of variable geometry at the anode would introduce additional uncertainty and complexity into the results and detract from the topic of focus, which is the electrical behaviour. Study of such variations is therefore left to future work on the subject.

The plasma arc model is combined with the circuit model (Equation [3]) using a backward Euler numerical integration method. In the case of a constant-current power supply the voltage supplied at the cathode in the arc model, Va, is iteratively adjusted to the point at which the current produced by the arc model matches the desired current set-point at each time-step. In the case of a thyristor supply, Vaa is iteratively adjusted until the current produced by the arc model satisfies the relationship in Equation [3] at each time-step, based on the values of VPand L.
In order to quantify the system behaviour, an ensemble forecasting approach is applied. Ensemble forecasts entail running multiple simulations to predict outcomes from a collection of similar starting conditions, and then analysing the degree of variation in the results (Leutbecher and Palmer, 2008). In the case of the combined plasma arc and circuit model, this was achieved by first running a long simulation at constant current, then randomly extracting from the results a set of conditions with instantaneous arc voltages similar to the mean value. These conditions were then used as the starting points for simulations of a single pulse interval of a thyristor power supply, i.e., the period during which external control actions are not possible and the system simply responds to the supply voltage VP, given by Equation [1]. The resulting deviation of current I away from the constant current set-point over the pulse interval was taken as an indication of the controllability of the power supply.
Results and discussion
The base case parameters used in the study are given in Table I, and are representative of a small pilot-scale DC arc furnace.
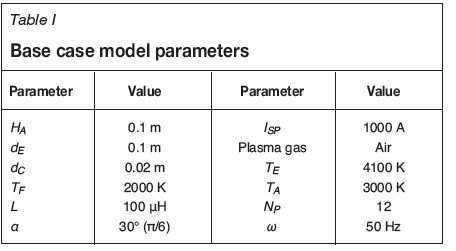
Here, Ha is the arc length from electrode tip to anode surface, dEis the electrode diameter, and dCis the diameter of the cathode tip. Isp is the fixed current that is applied during constant-current simulations. TEand TAare the maximum permitted temperatures on the electrode and anode boundaries respectively, and TFis the inlet temperature of gas from the surrounding freeboard region.
Generation ofensemble member starting conditions
In order to produce the ensemble starting conditions used by all subsequent simulations, the base case model was set up to run for 100 ms of in-model time while operating in constant current mode. An impusive start initial condition was used in which a column of high-temperature plasma was inserted between the electrode tip and the anode surface, at zero velocity. The evolution of arc voltage with time is depicted in Figure 4, and shows clearly how the rapid chaotic motion of the arc column influences its electrical characteristics.
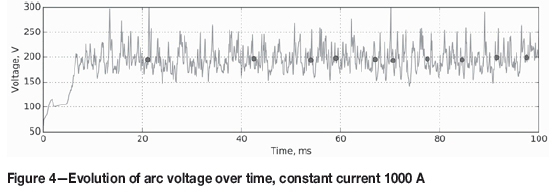
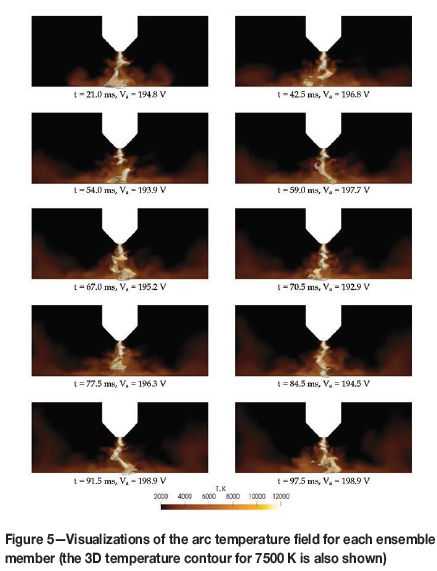
The average arc voltage for the period after the initial conditions had decayed was approximately 195.7 V. Ten points close to this value were randomly selected from the data output by the constant current simulation, indicated as solid circles in Figure 4. Field data at these points was saved and used as the initial condition for each member of the ensemble forecast. Visualizations of the arc's temperature field for each ensemble starting condition are shown in Figure 5.
Combined circuit model - base case results
Using the base case parameters in Table I, the combined circuit model using a thyristor power supply was executed for each member of the ensemble starting conditions. The value of VACused in Equation [1] was found from Equation [2] for each ensemble member, with VDCequal to the instantaneous arc voltage at the start of the simulation. The simulations were run for a single pulse interval - in the case of a 12-pulse thyristor system at 50 Hz, this is a period of 1.67 ms.
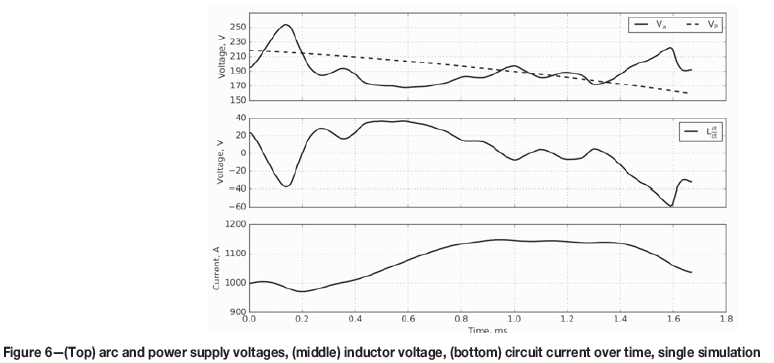
Results from a single ensemble member simulation are shown in Figure 6. The presence of an inductive load in the circuit causes deviations between the power supply voltage Vp and the arc voltage Va, which are balanced by the inductor voltage generated by the variation of the arc current with time.
Results from all ten ensemble simulations at base case conditions are shown in Figure 7. The total range of currents covered by the simulation trajectories is shown in grey shading.
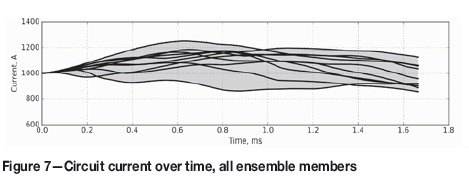
It can be seen that although all simulations start at the initial current of 1000 A, it is possible to have movement away from this value in both positive and negative directions during a single thyristor pulse.
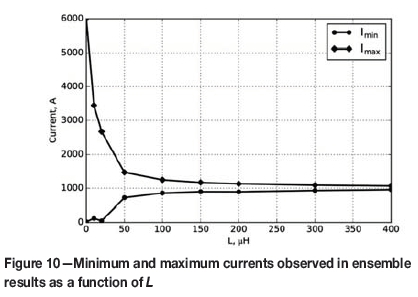
Combined circuit model - effect ofinductance
In order to study the effect of the inductor on the system behaviour, the inductance L was varied between 0 and 400 μH while keeping all other parameters fixed at base case conditions. The spread of currents over the duration of a single thyristor pulse was calculated from the set of ensemble trajectories from simulations at each inductance value. The ensemble results for 0, 10, and 50 μH are shown in Figure 8.
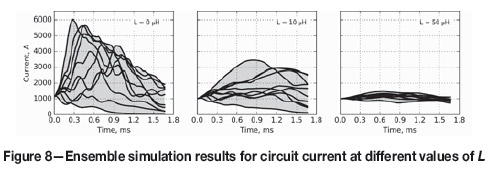
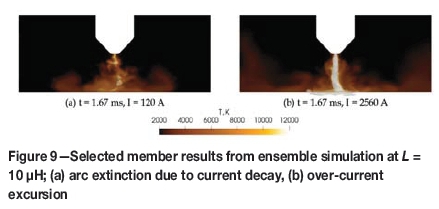
It is clear that with insufficient inductance present, the circuit current over a single thyristor pulse is capable of diverging rapidly to very large or very small values (see also Figure 9), making control of such a system challenging.
In real systems a small amount of inductance is generally unavoidable due to the circuit loop between furnace and rectifier (of the order of 10-20 μΗ). Although this is not enough to prevent arc extinction or over-current, it does have some mitigating effect on the range of currents attained in the model. Adding a moderately sized DC line inductor (> 50 μΗ) significantly decreases the variation in current possible over a single pulse interval, making control at pulse-interval time-steps more feasible.
The range of currents obtained for each value of L simulated is shown in Figure 10, demonstrating the limitation of current variation by larger inductors.
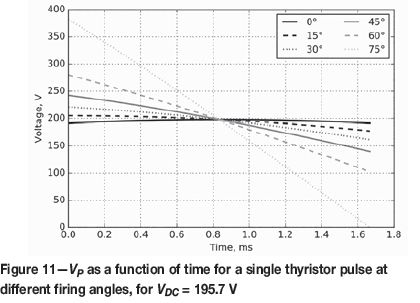
Circuit model - effect of firing angle
The effect of changing the firing angle α was examined by varying the value between 0° (0) and 75° (5π/12) while keeping all other parameters fixed at base case conditions. This is equivalent to changing the peak-to-peak AC voltage, for example by selecting different tap settings on the transformer while keeping the system operating point fixed. As per Equation [1], this causes changes in the variation in Vpover the duration of a pulse, as shown in Figure 11.
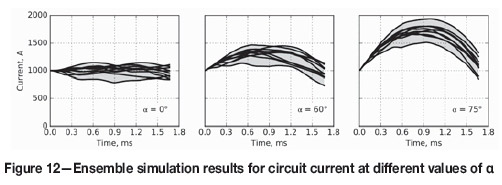
To determine the impact this has on the combined circuit model, the spread of currents over the duration of a single thyristor pulse was calculated using the set of ensemble trajectories from simulations at each firing angle value, as before. The results for 0°, 60°, and 75° are given in Figure 12.
The range of currents attained for each value of firing angle simulated is given in Figure 13. Increasing the firing angle increases the variability in Vp, which in turn increases the variability in I.
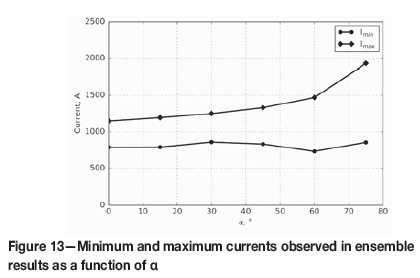
It is interesting to observe that although the current ranges at the end of a pulse remain reasonably similar, the currents rise and fall more appreciably during the pulse for larger firing angles. Larger values of L would also be expected to mitigate this effect.
Circuit model - effect ofpulse count
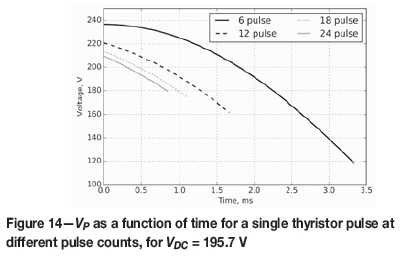
The effect of using a different number of pulses in the design of the thyristor power supply was examined by changing the value of NPbetween 6 and 24, while keeping all other variables fixed at the base case values. As per Equation [1], larger pulse counts lead to shorter pulse intervals and therefore a reduction in the variability of VPover the pulse -this is shown graphically in Figure 14.
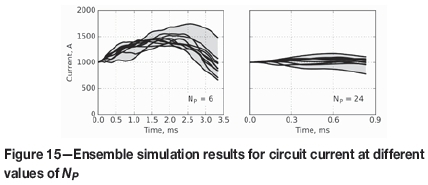
As with the firing angle effect, larger pulse counts are generally expected to exhibit smaller variations in DC current. The model results bear this out to some degree; as shown in Figure 15 the spread of currents resulting from a single 6-pulse interval is considerably greater than that of a 24-pulse interval.
The range of currents observed in each ensemble simulation for different NPvalues is shown in Figure 16.
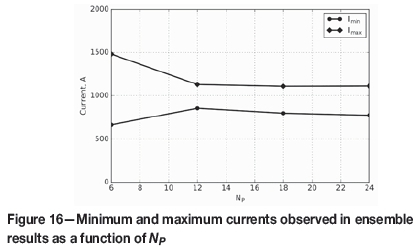
Up to a point, increasing the number of pulses reduces the current variability, but then appears to level off in effectiveness. It is, however, important to recall that these results are for a fixed value of L; in practice, both L and NP are optimized together for a given power supply design to effect a desired reduction in current variability over a pulse interval.
Conclusions
A combined circuit model of the behaviour of DC furnace power supplies was successfully developed using computational plasma arc models. The model was used to examine the effect of changing basic parameters of a typical thyristor power supply for a small-scale pilot furnace.
Increasing the series inductance in the DC circuit was seen to reduce current deviations due to arc behaviour over the duration of a single thyristor pulse, an important requirement for the correct operation of power electronics controllers. Low pulse-count designs (particularly 6-pulse) and operation at high firing angles were seen to be undesirable conditions that may lead to increased variability in the current delivered by the power supply. This preliminary work suggests that there may be scope to improve on existing DC furnace designs by taking into account not only the dynamics introduced by the rectifier power electronics, but also the dynamics of the arc; these are typically considerably more erratic and unpredictable in nature, particularly at higher current levels.
Further work is strongly recommended to build on the results of this initial study. Comparison with electrical data gathered from existing DC arc furnaces is a necessary step for validation of the existing models and will be prioritized going forward. High-speed electrical measurements capable of fully resolving the circuit behaviour within the duration of a single thyristor pulse will be necessary for such work, which should ideally cover both pilot plant and industrial furnaces to reveal any scale effects not captured by the present models. Extension of the arc models to systems closer to industrial scale would be of value in providing a useful virtual prototyping environment for power supply and furnace designers. In addition, integration of more sophisticated circuit simulations to include realistic thyristor power supply effects such as commutation, line impedances, and protection and safety circuitry would allow such effects to be studied in detail in terms of their impact on the arc, and vice versa.
Acknowledgements
This paper is published by permission of Mintek. The author gratefully acknowledges access to resources at the CSIR Centre for High Performance Computing in Cape Town, South Africa for execution and analysis of computational modelling results.
References
Bowman, B. and Kruger, K. 2009. Arc Furnace Physics. Verlag Stahleisen, Düsseldorf, Germany. [ Links ]
Jones, R.T. 2014. DC arc furnaces - past, present, and future. Proceedings of the Extraction and Processing Division S ymposium on Pyrometallurgy in Honor of David G.C. Robertson, TMS Annual Meeting & Exhibition 2014, San Diego CA, USA, 16-20 February 2014. pp. 129-139. [ Links ]
Jones, R.T., Reynolds, Q.G., Curr, T.R., and Sager, D. 2011. Some myths about DC arc furnaces. Journal of the Southern African Institute of Mining and Metallurgy, vol. 111. pp. 665-673. [ Links ]
Leutbecher, M. and Palmer, T.N. 2008. Ensemble forecasting. Journal of Computational Physics, vol. 227. pp. 3515-3539. [ Links ]
OpenFOAM Foundation. 2017. OpenFOAM® software. https://openfoam.org/ [ Links ]
Reynolds, Q.G. 2015. Interaction of dust with the DC plasma arc - a computational modelling investigation. Journal of the Southern African Institute of Mining and Metallurgy, vol. 115. pp. 395-407. [ Links ]
Reynolds, Q.G. 2017. Computational modeling of arc-slag interaction in DC furnaces. JOM, vol. 69, no. 2. pp. 351-357. [ Links ]

