


Services on Demand
Article
 English (pdf)
 Article in xml format
 Article references
Indicators

Related links
-
 Cited by Google
 -
 Similars in Google
Share

 Permalink
Journal of the Southern African Institute of Mining and Metallurgy
On-line version ISSN 2411-9717
Print version ISSN 2225-6253
J. S. Afr. Inst. Min. Metall. vol.118 n.6 Johannesburg Jun. 2018
http://dx.doi.org/10.17159/2411-9717/2018/v118n6a9
INFACON XV: INTERNATIONAL FERRO-ALLOYS CONGRESS 2018
The use of satellite observations of fire radiative power to estimate the availabilities (activity patterns) of pyrometallurgical smelters
J.P. BeukesI; P.G. Van ZylI; M. SofievII; J. SoaresII, III; H. Liebenberg-EnslinIV; N. ShackletonIV; A.-M. SundströmII
IChemical Resource Beneficiation, North-West University, Potchefstroom, South Africa
IIFinnish Meteorological Institute, Finland
IIIEnvironment and Climate Change Canada, Canada
IVAirshed Planning Professionals (Pty) Ltd, South Africa
SYNOPSIS
Pyrometallurgical smelters consume significant amounts of fossil fuels. Notwithstanding emission abatement technologies, these smelters emit various gaseous pollutants and fine particulate matter, which are important from an air quality perspective. Additionally, carbon dioxide (CO2) and black carbon (BC), the two most important atmospheric climate forcing species, are also emitted. It is important to model the contribution, transport, and impact of pollutants emitted by pyrometallurgical smelters. In order to do this, atmospheric modellers require an accurate emission inventory, which indicates emissions (how much of what species by which processes), emission periods, stack/emission heights, and emission velocities (if emitted through stacks). However, in many countries atmospheric modellers do not have access to a proper emission inventory, or they are legally prohibited from obtaining such information. The current paper demonstrates how fire radiative power (FRP) observations by the Moderate Resolution Imaging Spectro-radiometer (MODIS) instruments on board the Aqua and Terra satellites can be used to estimate the availabilities of pyrometallurgical smelters. Such temporal activity patterns will assist modellers to re-create air quality scenarios for regions more accurately.
Keywords: MODIS, remote sensing, fire radiative power, large point sources, estimated availabilities, pyrometallurgical smelters.
Introduction
From an atmospheric science perspective, emission inventories (how much of what pollutant species are emitted, where and when) are poorly developed in many countries. South Africa, which is the largest industrialized economy in southern Africa, can be considered as an example. At present South African environmental legislation requires significant atmospheric emitters to supply emission data to the government, but this information is protected by some legal safeguards and this has thus far prevented a comprehensive peer-reviewed emission inventory from becoming available in the public domain. Applications can be made to the Air Pollution Control Officer to access some information on the atmospheric emission licences of the aforementioned emitters, but this process is lengthy and does not yield all the required information. Therefore, atmospheric modelling studies undertaken for this region have to a large extent depended on global emission inventory databases (e.g. Kuik et al., 2015; Lourens et al., 2016) that might not contain sufficient detail. Also, it is almost impossible for atmospheric scientists to account for fluctuations in the temporal activity patterns (if a source emits or not) of large point sources so as to provide temporally resolved emission inventories.
In this paper we demonstrate how satellite-derived fire data can be used to locate and reflect the activity patterns of large point sources. Open biomass burning, both natural (e.g. lighting-induced fires) and anthropogenic (e.g. intentional or accidental grassland, savannah, or forest fires), has long been recognized as one of the most significant sources of atmospheric pollutant species such as carbon dioxide (CO2), carbon monoxide (CO), particulate matter (PM), black carbon (BC), and precursors for secondary pollutants (e.g. Vakkari et al., 2014; Chiloane et al., 2017). This has led to a multitude of studies using satellite-derived fire and/or burned area detection data to improve fire emission estimates and explain pollutant observations (e.g. Mafusire et al., 2016). However, comparatively little attention has been given to alternative uses of these satellite-derived fire data-sets.
Methods
Fire radiative power (FRP) observations
Fire radiative power (FRP) data for the period January 2001 to March 2016 was obtained from the active fire observations by the Moderate Resolution Imaging Spectro-radiometer (MODIS) instruments on board the Aqua and Terra satellites (Justice et al., 2002; Kaufman, Kleidman, R.G., and King, 1998). FRP data is similar to the Advanced Fire Information System (AFIS) system (AFIS, 2018) (https://southernafrica.afis.co.za/ [accessed 13 February 2018]). The FRP data-set indicates the location of savannah, grassland, and forest fires (Figure 1a) that were active at the date of detection, but could also indicate false positive 'fires' for point sources with significant thermal emissions, e.g. pyrometallurgical smelters where activities such as metal/slag tapping (Figure 1b) or off-gas flaring (Figure 1c) could result in substantial thermal emissions.

Case study industry and area of interest
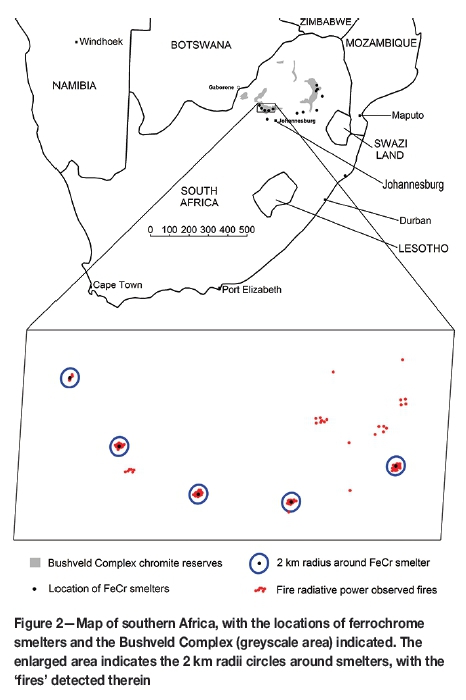
In this paper ferrochrome (FeCr) smelters were considered as examples of significant point sources of atmospheric emissions. These smelters produce a relatively crude alloy consisting principally of chromium and iron, which is subsequently used mainly in the manufacturing of stainless steel (Basson and Daavittila, 2013). South Africa holds the largest chromium ore (chromite) reserves and is one of the largest FeCr producers (Basson and Daavittila, 2013). Most of the FeCr smelters in South Africa are located relatively close to the Bushveld Complex, a geological feature that holds the chromite reserves. The locations of these smelters in relation to the Bushveld Complex are indicated in Figure 2.
Detection of large point sources and determination of availability patterns
Although the locations of significant point-source emissions, such as FeCr smelters, are known in South Africa, this might not be the case everywhere. Therefore, the first demonstrated use of FRP data within the context of this paper was the confirmation of the location of FeCr smelters as false positive 'fires'. This was achieved by considering repetitive active fires (i.e. fires occurring regularly on more or less the same spot) observed during the non-fire season in the South African interior.
The second demonstrated use of FRP data was to estimate the temporal activity patterns (operational or not) of FeCr smelters, which is commonly referred to in the pyrometallurgical industry as plant/smelter availability. The availabilities of FeCr smelters are directly linked to international trends such as the demand for stainless steel and the unit price for chromium, regional aspects such as electricity and carbonaceous reducing agent prices and availabilities, as well as smelter-specific issues such as planned/unplanned shutdowns to repair/rebuild production units (Kleynhans et al., 2017). It is impossible for atmospheric scientists to know this information, since industry does not commonly make it known in the public domain. In this paper the frequency of repetitive active fires within a 2 km radius around FeCr smelters was used to estimate monthly smelter availabilities. The enlarged map in Figure 2 indicate in blue the 2 km radii circles around FeCr smelters in the western limb of the Bushveld Complex, which is the most developed area of this geological feature. Additionally, active fires are indicated with red dots.
The CALPUFF (Version 7) atmospheric dispersion modelling suite was used for the simulation of ambient air pollutant concentrations to indicate the effect plant availabilities could have on such concentrations. CALPUFF is a multi-layer, multi-species non-steady state puff dispersion model that can simulate the effects of time- and space-varying meteorological conditions on pollutant transport, transformation, and removal ((www.lem.org.cn/u/cms/www/201307/05161203d9ap.pdf, accessed 15 June 2018)). CALPUFF is intended for use on scales from tens of metres to hundreds of kilometres from a source. CALMET and CALPUFF contain the simulation engines to calculate the three-dimensional atmospheric boundary-layer conditions, as well as the dispersion and removal mechanisms of pollutants released into this boundary layer. The CALPOST code was used to assist with the preparation of output data.
Satellite retrieval of pollutant concentrations
In addition to dispersion modelling (indicated in the previous section), planetary boundary layer (PBL) sulphur dioxide (SO2) concentrations were used to verify the effect that plant availabilities had on ambient pollutant concentrations. The satellite data used originated from the NASA Ozone Monitoring Instrument (OMI). Specifically, the SO2 PBL product Level 3 data (Krotkov et al., 2006, 2008) was used. The OMI SO2 PBL product describes the SO2 concentration integrated over the entire atmospheric column, while the term 'PBL' refers to the a-priori profile assumed in the retrieval. The resolution of retrieval for OMI PBL SO2 was 0.25 χ 0.25°. More details regarding such retrievals can be found in Sundström et al. (2015).
Results and discussion
The main fire season for the northern South African interior is typically during the dryer and colder period of June to September, while fires in the Western Cape Province typically occur from November to March (Chiloane et al., 2017). Figures 3a and 3b indicate the active fires that were detected with MODIS FRP for the period June to September 2009 and November 2008 to March 2009, respectively. These results present the conventional type of use of MODIS FRP data. As is evident from Figure 3, there are clear temporal and spatial patterns in observed fires in southern Africa. It is beyond the scope of this paper to explore these aspects further; but it is interesting to note that although the number of active fires detected decreases significantly during the wetter period (November 2008 to March 2009, indicated in Figure 3b as an example), in the northern South African interior, where most of the industrial activities are located, some fires were still detected. Obviously some of this data (Figure 3b) represents real fires, but it was also found that repetitive fires indicated anthropogenic activities that have a strong enough thermal signal to be observed with the MODIS FRP satellite sensors. It was, for instance, found that the locations of large pyrometallurgical smelters were clearly indicated by such repetitive fires. As previously mentioned, this could be due to activities such as slag/metal tapping or off-gas flaring, which might emit thermal signals strong enough to be detected.

In an attempt to convert the frequency of the abovementioned repetitive fires into useful plant availability data, a simple algorithm was formulated. This entailed several steps. Firstly, the locations of interest were established. As previously stated, the case study industry considered in this paper is the FeCr industry. Circles with 2 km radii were drawn around each identified FeCr smelter. The repetitive fires occurring each month within the 2 km radius of each smelter were then counted. Then, 3-month moving averages were calculated for each smelter, based on the previous, current, and next month being considered (e.g. for February 2009 the moving average was calculated from active fires observed from January to March 2009). The 3-month moving averages were then divided by the 75th percentile for that specific smelter (i.e. the 75th highest 3-month moving average over the entire period considered). These fractions were then converted to percentages. The percentage values were then grouped into five smelter availability category ranges:
(i) Percentages < 10% were taken as representing zero smelter availabilities
(ii) 10% > percentages < 25% were taken as representing 5 to 25% smelter availabilities
(iii) 25% > percentages < 50% were taken as representing 25 to 50% smelter availabilities
(iv) 50% > percentages < 75% were taken as representing 50 to 75% smelter availabilities
(v) Percentages > 75% were taken as representing 75 to 100% smelter availabilities.
The use of the abovementioned 3-monthly averages instead of individual monthly FRP-observed repetitive fire counts, the division by the 75th percentile instead of the largest monthly active fire count, and the grouping of the smelter availabilities into ranges instead of presenting discrete monthly availabilities were all measures that were implemented into the algorithm to account for the repetitive fire data being relatively erratic. The erratic nature of the data was not due to limitations of the observation sensors, but rather to the fact that the daily satellite overpasses will not capture all the high-radiation events (e.g. moving hot slag after tapping, hot slag/metal protruding beyond the cover of a slag bay directly after tapping). Observations of all (or almost all) such high-radiation events will be possible only with geostationary satellite observations, which are currently not available for southern Africa. There are thus significant limitations to the data and how accurate smelter availabilities can be calculated from it.
The calculated availabilities for several smelters over the period January 2001 to March 2015, using the abovementioned algorithm, are presented in Figure 4. These smelters were chosen since the authors knew that they were either commissioned and/or underwent expansion(s) during the period considered.
The availability data of the smelters indicated in Figure 4 was subsequently briefly reviewed, to assess the usefulness of the calculated availabilities. Since actual smelter availabilities are not available in the public domain, commissioning/expansion/stoppage data that is available in the 'grey' literature (e.g. company websites and/or non-accredited or non-peer-reviewed mining, metallurgical, and business-related magazines) was used for this assessment.
> For International Ferro Metals (IFM), the calculated availabilities indicate a brief period of operation in mid-2005, when the smelter was not yet commissioned. However, smelter operation over such a short period is clearly a data artefact, which should be ignored. Thereafter the availability data correctly indicates commissioning of the smelter in January/February 2006 (International Ferro Metals, 2017) and also the stoppage due to business recue in the third quarter of 2015 (http://www.miningrnx.com/news/ferrous-rnetals/13749-international-ferro-metals-goes-into-business-rescue/ [accessed 25 January 2017]).
> The calculated availabilities for the Boshoek smelter (BOS) correctly indicate the commissioning in mid-2002 (Industrial Development Corporation, 2017).
> The commissioning date of Lion Ferrochrome (LIO) and the doubling of its production capacity are correctly indicated by the calculated availability data as the third quarter 2006 and first quarter 2013, respectively (GH Group, 2017). However, considering that the algorithm calculates all availabilities in terms of the largest production capacity, it is clear that the availabilities during 2006 to mid-2012 are overestimated at times.
> For ASA Metals (ASA) the calculated availability data does not reflect the operation of the smelter prior to 2004. This might be due to the fact this this smelter was one of the smaller smelters at the time, and its radiative power signal was not detected. Also, the physical design of the smelter at the time might have prevented detection of the signal (e.g. slag bays that totally shelter tapped slag/metal and open/semi-closed furnaces that do not combust CO off-gas in flares). However, after the expansion at the end of 2003 and beginning of 2004 (ASA Metals, 2017), the radiative fire data indicated the operation of the smelter in the correct availability range. Limited overestimated availabilities, considering the maximum production capacity during the evaluated period, are indicated during short periods in 2006 and 2007. The expansion at the beginning of 2010 (http://www.asametals.co.za/history.html [accessed 1 February 2017]) and the stoppage due to business recue in mid-2015 (ASA Metals, 2017) are correctly indicated.
> The expansion of the Wonderkop smelter (WDK) is correctly indicated by the calculated availability data in the first quarter of 2002 (Naiker and Riley, 2006).
> For Hernic Ferrochrome (HER) the availability data prior to the first quarter of 2002 is underestimated, again maybe since it was a smaller smelter at the time and/or due to smelter design preventing radiative power detection. However, the expansions in the first quarter of 2002 and the third quarter of 2005 are correctly indicated (Mining Weekly, 2005).
Apart from the availabilities of the abovementioned smelters, the calculated availabilities of the Rustenburg smelter (RST) are also indicated in Figure 4. This was specifically done since RST, IFM, BOS, WDK, and HER are all located within a relatively small area in the western limb of the Bushveld Complex (see Figure 2 for spatial perspective). From the availability data presented in Figure 4 it is very interesting to note that all the aforementioned smelters were offline (zero plant availability) towards the end of 2008/beginning of 2009 as a result of the 2008 financial crisis. It is relatively well known that commodity prices and demand were very high prior to the 2008 global financial crisis, therefore it can be assumed that most of the South African FeCr producers decided to shut the smelters down during this time rather than operate at a loss.
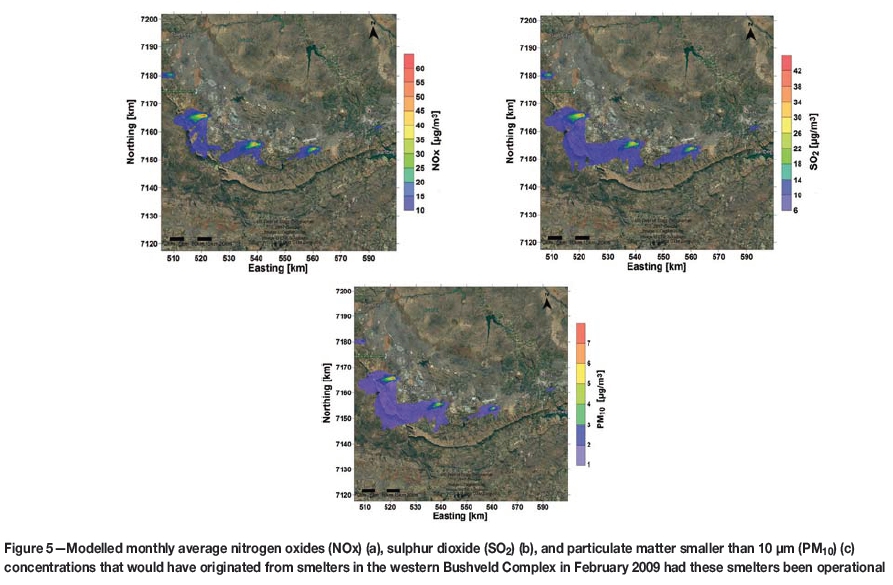
Atmospheric scientists and air quality managers are interested in temporally resolved emission inventories and how changes in emissions affect air quality (concentrations of pollutants). To estimate the effect that the simultaneous shutdowns of all the FeCr smelters in the western Bushveld Complex had on atmospheric pollutant levels, monthly average nitrogen oxides (NOx), SO2 and particulate matter smaller than 10 μηι (PM10) concentrations that would have originated from these smelters in February 2009 are indicated in Figures 5a, 5b, and 5c, respectively. February 2009 was specifically chosen since all the smelters were offline then. These modelled (using CALPUFF Version 7, as previously indicated) concentration patterns (Figure 5) should be considered as a sensitivity analysis rather that absolute atmospheric concentrations, since numerous assumptions were made during these simulations. These include assuming that all emission points for a specific smelter occurred at the same coordinates. Also, stack heights, emission velocities, emitted species, and amounts of emissions were classified according to the technologies utilized and were taken as similar at smelters using similar technologies. Notwithstanding these assumptions, the results clearly indicate that emissions that would have occurred during February 2009 if the smelters had been operational would have contributed to pollutant levels in the area.
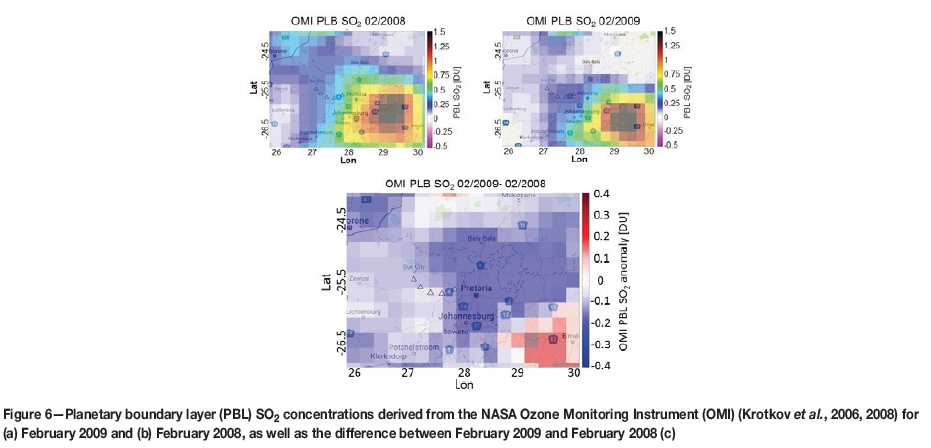
To further investigate the usefulness of the calculated plant availabilities, satellite-retrieved PBL SO2 concentrations for February 2009 (when the smelters were deemed to be offline, using the method proposed in this paper) were compared to those of February 2008 when the smelters were in full operation (Figures 6a and 6b, respectively). As is evident from the difference between the two months (i.e. concentrations in February 2009 minus concentrations in February 2008), which is presented in Figure 6c, the PBL SO2 concentrations in February 2009 were much lower than in February 2008. This supports the notion that many smelters in the western Bushveld Complex were offline (zero plant availability) in February 2009, as indeed calculated by the method proposed in this paper. SO2 was specifically chosen as the pollutant of interest since many smelters in the western Bushveld Complex are platinum group metal (PGM) smelters (Jacobs, 2006), which emit relatively high SO2 concentrations. Therefore, the differences observed in Figure 6c are not only due to the FeCr smelters, which were thus far considered as example pyrometallurgical point sources, but rather to a combined effect of all the sources in the western Bushveld Complex.
Conclusions
This paper indicates the potential for satellite-derived plant availabilities to be calculated for large anthropogenic emission point sources. Such availabilities will significantly assist atmospheric scientists and air quality managers to interpret measured atmospheric concentrations and to conduct more accurate atmospheric modelling studies. The comparatively crude algorithm presented here was able to indicate commissioning and/or expansion(s) of FeCr smelters relatively accurately. However, calculated plant availabilities could not be compared with real plant availabilities, due to a lack of such data for South Africa in the public domain. Also, false positive 'fires' from point sources, are identified by the MODIS FRP administrators and are currently removed from the data-set, which makes the aforementioned comparisons even more difficult.
Notwithstanding the limitations of the method presented in this paper, the calculated plant availability data proved that most of the smelters were not operational (zero plant availability) during or directly after the financial crisis in 2008/2009, at which time a significant decrease in several atmospheric pollutants was reported on a regional basis in South Africa (Conradie, 2018). This decrease was most likely due to many smelters stopping operation, which would have resulted in a significant decrease in atmospheric pollution, as proven with dispersion modelling and satellite retrievals.
Based on the positive results indicated here, satellite-derived plant availabilities for large point sources should receive more research attention. However, significant advances will be possible only if false positive 'fires' from point sources are captured in a separate data-set, instead of being removed from the current MODIS FRP data-set.
References
AFIS (Advanced Fire Information System). 2018. https://southernafrica.afis.co.za/ [accessed 13 February 2018]. [ Links ]
ASA Metals. 2017. http://wwww.asametals.co.za/history.html [accessed 2 February 2017]. [ Links ]
Basson, J. and Daavittila, J. 2013. High carbon ferrochrome technology. Handbook of Ferroalloys: Theory and Technology. Gasik, M. (ed.). Elsevier, UK. http://dx.doi.org/10.1016/B978-0-08-097753-9.00009-5 [ Links ]
Chiloane, K.E., Beukes, J.P., van Zyl, P.G., Maritz, P., Vakkari, V., Josipovic, M., Venter, A.D., Jaars, K., Tiitta, P., Kulmala, M., Wiedensohler, A., Liousse, C., Mkhatshwa, G.V., Ramandh, A., and Laakso, L. 2017. Spatial, temporal and source contribution assessments of black carbon over the northern interior of South Africa. Atmospheric Chemistry and Physics, vol. 17. pp. 6177-6196. doi:10.5194/acp-17-6177-2017 [ Links ]
Conradie, E.H. 2018. Spatial and temporal deposition of selected biogeochemical important trace species in South Africa. PhD thesis, Northwest University, Potchefstroom, South Africa. [ Links ]
GH GRoUP 2017. http://www.ghgroup-int.com/gh-consulting-engineers/projects-profile/ [accessed 26 January 2017] [ Links ]
Industrial Development Corporation. 2017. http://www.idc.co.za/20years/timeline/idc-impact-for-20-years/2001-s [accessed 26 January 2017]. [ Links ]
International Ferro Metals. 2017. https://www.ifml.com/about-us/history-timeline.html [accessed 25 January 2017]. [ Links ]
Jacobs, M. 2006. Process description and abbreviated history of Anglo Platinum's Waterval Smelter, Southern African. Proceedings of Pyrometallurgy 2006. Jones, R.T. (ed.). Southern African Institute of Mining and Metallurgy, Johannesburg. [ Links ]
Justice, C., Giglio, L., Korontzi, S., Owens, J., Morisette, J., Roy, D., Descloitres, J., Alleaume, S., Petitcolin, F., and Kaufman, Y. 2002. The MODIS fire products. Remote Sensing of Environment, vol. 83. pp.244-262. [ Links ]
Kaufman, Y.J., Kleidman, R.G., and King. M.D. 1998. Potential global fire monitoring from EOS-MODIS. Journal of Geophysical Research: Atmospheres, vol. 103, D24. pp. 32215-32238. [ Links ]
Kleynhans, E.L.J., Beukes, J.P., van Zyl, P.G., and Fick, J.I.J. 2017. Techno-economic feasibility of a pre-oxidation process to enhance prereduction of chromite. Journal of the Southern African Institute of Mining and Metallurgy, vol.117. pp.457-468. doi:10.17159/2411-9717/2017/v117n5a8 [ Links ]
Krotkov, N., Carn, S., Krueger A., Bhartia, P., and Yang, K. 2006. Band residual difference algorithm for retrieval of SO2 from the Aura Ozone Monitoring Instrument (OMI). IEEE Transactions on Geoscience and Remote Sensing, vol. 44. pp.1259-1266. [ Links ]
Krotkov, N., McClure, B., Dickerson, R., Carn, S., Li, C., Bhartia, P., Yang, K., Krueger, A., Li, Z., Levelt, P., Chen, H., Wang, P., and Lu, D. 2008. Validation of SO2 retrievals from the Ozone Monitoring Instrument over NE China. Journal of Geophysical Research, vol. 113, D16S40. doi:10.1029/2007JD008818 [ Links ]
Kuik, F., Lauer, A., Beukes, J.P., Van Zyl, P.G., Josipovic, M., Vakkari, V., Laakso, L., and Feig, G.T. 2015. The anthropogenic contribution to atmospheric black carbon concentrations in southern Africa: a WRF-Chem modeling study. Atmospheric Chemistry and Physics, vol. 15. pp. 8809-8830, doi:10.5194/acp-15-8809-2015 [ Links ]
LEM. 2017. www.lem.org.cn/u/cms/www/201307/05161203d9ap.pdf [accessed 31 October 2017]. [ Links ]
Lourens, A.S.M., Butler, T.M., Beukes, J.P., van Zyl, P.G., Fourie, G.D., and Lawrence, M.G. 2016. Investigating atmospheric photochemistry in the Johannesburg-Pretoria megacity using a box model. South African Journal of Science, vol. 112, no. 1/2. Article no. 2015-0169. 11 pp. doi:10.17159/sajs.2016/2015-0169 [ Links ]
Mafusire, G., Annegarn, H.J., Vakkari, V., Beukes, J.P., Josipovic, M., van Zyl, P.G., and Laakso, L. 2016. Submicrometer aerosols and excess CO as tracers for biomass burning air mass transport over southern Africa. Journal of Geophysical Research: Atmospheres, vol. 121. pp. 10262-10282. doi:10.1002/2015JD023965 [ Links ]
Mining Weekly. 2005. http://www.miningweekly.com/article/hernic-strides-to-longterm-profitability-2005-01-28 [accessed 2 February 2017]. [ Links ]
Naiker, O. and Riley, T. 2006. Xstrata alloys in the profile. Proceedings of Pyrometallurgy 2006. Jones, R.T. (ed.). Southern African Institute of Mining and Metallurgy, Johannesburg. pp. 297-306. [ Links ]
Sundström, A.-M., Nikandrova, A., Atlaskina, K., Nieminen, T., Vakkari, V., Laakso, L., Beukes, J.P., Arola, A., van Zyl, P.G., Josipovic, M., Venter, A.D., Jaars, K., Pienaar, J.J., Piketh, S., Wiedensohler, A., Chiloane, E.K., De Leeuw, G., and Kulmala, M. 2015. Characterization of satellite-based proxies for estimating nucleation mode particles over South Africa. Atmospheric Chemistry and Physics, vol. 15. pp. 4983-4996. doi:10.5194/acp-15-4983-2015 [ Links ]
Vakkari, V., Kerminen, V.-M., Beukes, J.P., Tiitta, P., van Zyl, P.G., Josipovic, M., Venter, A.D., Jaars, K., Worsnop, D.R., Kulmala, M., and Laakso, L. 2014. Rapid changes in biomass burning aerosols by atmospheric oxidation. Geophysical Research Letters, vol. 41. pp. 2644-2651. doi:10.1002/2014GL059396 [ Links ]

