


Services on Demand
Article
 English (pdf)
 Article in xml format
 Article references
Indicators

Related links
-
 Cited by Google
 -
 Similars in Google
Share

 Permalink
Journal of the Southern African Institute of Mining and Metallurgy
On-line version ISSN 2411-9717
Print version ISSN 2225-6253
J. S. Afr. Inst. Min. Metall. vol.118 n.6 Johannesburg Jun. 2018
http://dx.doi.org/10.17159/2411-9717/2018/v118n6a8
INFACON XV: INTERNATIONAL FERRO-ALLOYS CONGRESS 2018
3D models of proximity effects in large FeSi and FeMn furnaces
E.V. Herland; M. Sparta; S.A. Halvorsen
Teknova AS, Norway
SYNOPSIS
Many large furnaces used for production of ferroalloys are operated using three-phase alternating current. In such furnaces, there are significant skin and proximity effects caused by induction effects in, and between, the electrodes. Moreover, there may be high currents induced in the furnace steel shell. This causes additional proximity effects between the currents in the electrodes and alloy, and the induced currents in the lining and shell.
A numerical study of such effects in realistic 3D geometries of ferromanganese and ferrosilicon furnaces is presented. The models are used to estimate the induced currents in the steel shell as well as accurate alternating current distributions in the material layers within the furnace. Also, the active and reactive power densities within the furnace are studied. The results show that there are strong skin and proximity effects in the conductive material layers within the furnace. Both the electrode proximity effects and the proximity effects caused by the steel shell are computed. The latter can be significant, and should be included when high accuracy is required.
Keywords: ferroalloy furnace, electrical conditions, AC current, current density, skin and proximity effects.
Introduction
In many industrial ferroalloy furnaces, the required power is supplied by alternating electrical currents (AC). These currents produce electromagnetic fields that induce eddy currents in the conductive materials in the furnace. Two effects can be identified, depending on whether the eddy currents are induced in the conductor itself or in a nearby one: the skin effect, which causes the currents to accumulate near the surface of conductors, and the proximity effect, which induces currents in surrounding conductors (Lupi, 2017). The induced eddy currents can have a high intensity and effectively modify the current distribution.
For metal-producing furnaces, the skin and proximity effects have typically been studied in electrodes. Many studies include only one electrode - a strong simplification considering that there are several interacting electrodes in the furnace. Furthermore, models often assume axial symmetry, such that the calculations can be projected to the two-dimensional (2D) radial cross-section of the electrode (Larsen, Feldborg, and Halvorsen, 2013; Innvaer, Fidje, and Ugland, 1986;
Innvaer and Olsen, 1980; Innvaer, Olsen, and Vatland, 1984; Halvorsen, Valderhaug, and Fors, 1999; Bermúdez et al., 2003; Bermúdez, Bullón, and Pena, 1998; Gunnewiek et al., 2004). The axisymmetric assumption simplifies and speeds up calculations, particularly when more complex situations such as thermoelectric or thermomechanical models are considered. Axisymmetric models will capture the skin effect, given that the AC formulation is used, but they will not capture proximity effects between electrodes. In addition to the axisymmetric models, 3D single-electrode models have been investigated numerically, both for Soderberg and composite ELSA electrodes (McDougall et al., 2004; Innvaer, Fidje, and Sira, 1985; Meyjes, Venter, and van Rooyen, 2010; Bermúdez, Rodriguez, and Salgado, 2005; Jonsson and Ingason, 1998). These models typically focus on the electrical, thermal, and mechanical conditions in, and close to, the baking zone.
There have also been several publications that focus on capturing the proximity effect between the electrodes in industrial furnaces. Analytical calculations of the skin and proximity effects have been performed in 2D horizontal cross-sections with the typical triangular electrode configuration with a phase shift between the electrodes (Dunski, 1962; Bochmann and Olsen, 1968; Hot, Haznadar, and Majer, 1980). Also, numerical case studies have been published, both in 2D (Larsen, 2006; Bermúdez et al., 1999), and in 3D (Bermúdez, Rodriguez, and Salgado, 2005; McDougall, 2007). The results for the current density in the electrodes capture the asymmetric current distribution that arises when proximity effects are considered.
In addition to electrode models, there are also studies that include the interior of the furnace. These typically concentrate on modelling the process itself, with a simple rendering of the electrodes (McDougall, 2007). Finally, if the electrical conditions are modelled with direct current (DC) (Darmana et al., 2012; Dhainaut, 2004; Halvorsen, Olsen, and Fromreide, 2016), both the skin and proximity effects are disregarded.
In the present work, AC electromagnetic models are studied for two cases, a 45 MW ferrosilicon (FeSi) furnace, and a 41 MW ferromanganese (FeMn) furnace. The main objective is to model the skin and proximity effects, within the electrodes as well as in the other material layers of the furnace. The models include the effects of the steel shell and the lining.
The models
Electromagnetics
For the metal-producing furnaces studied here, the AC frequency/is 50 Hz, and all electromagnetic fields are assumed to vary harmonically with time. Hence, the electric field E(r,t) (V/m), which generally depends on time and space, can be written E(r,t) = Re(eiwtE(r)), where Re denotes the real part of its argument, E(r) is the time-independent complex amplitude, and ω = 2rf. In the following, all electromagnetic fields are denoted in terms of their complex amplitude fields. The electromagnetic fields inside the furnace are accurately described by the low-frequency approximation of the time-harmonic Maxwell's equations (Bermúdez, Gómez, and Salgado, 2014; Rodriguez and Valli, 2010):
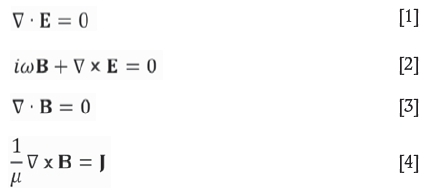
Here, B(T) is the magnetic field, J(A/m2) is the electric current density, and μ(Η/m) is the magnetic permeability. The magnetic permeability is typically given by μ = μΓμ0, where μο= 4π-10-7 H/m is the constant magnetic permeability of vacuum and μr(dimensionless) is the relative magnetic permeability. Also, J is related to E through Ohm's Law

where σ (S/m) is the electrical conductivity.
Skin effect
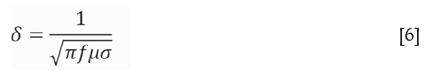
By solving Equations [1]-[5], one finds that the electromagnetic fields and currents decay inside conductors, such that the currents effectively accumulate on the surface of the conductor (Bermúdez, Gómez, and Salgado, 2014; Ramo, Whinnery, and van Duzer, 1994), i.e., the so-called skin effect, which is particularly evident at higher frequencies and for thicker conductors of high electrical conductivity or relative magnetic permeability. To exhibit an appreciable skin effect, the conductor must be large enough to accommodate significant amounts of self-induced eddy currents. That is, the radius of the conductor must be larger than the skin depth δ (m), given by
In most electrodes, it is a good approximation that the currents flow in the axial direction below the contact clamps. Then, in electrodes with a circular cross-section, it is possible to derive analytical expressions for the current density and the resistance of the electrode. These results are very useful and are frequently cited in the context of electrode current-carrying capacity (Dunski, 1962; Kennedy, 2012; Westly, 1975).
Proximity effect
The proximity effect can be regarded as the redistribution of current due to induced eddy currents opposing the electromagnetic variations caused by nearby conductors. Similar to the skin effect, the radius of the conductor must be comparable to or higher than δ in order to exhibit appreciable proximity effects. Additionally, as the electromagnetic fields caused by an AC current decrease with distance, the strength of the proximity effects will depend on how close the conductors are to each other. Previous investigations of 2D conductor configurations, similar to the horizontal cross-section of the triangular electrodes configuration studied here, have concluded that the dimensionless factor D/d (where D (m) is the electrode diameter and d(m) is the electrode centre-to-centre distance) is a key quantity in the evaluation of proximity effects (Dunski, 1962; Hot, Haznadar, and Majer, 1980). The proximity effects increase when D/d increases.
Model assumptions and limitations
The models investigated here focus on the skin and proximity effects in the material layers of the furnace and in the lower part of the electrode. For this reason, the baking zone, electrode clamps, electrode casing, busbars, and flexibles are not included in the models.
The material properties are assumed to be constant within each material layer. Specifically, σ does not vary with temperature. Therefore, the model cannot predict changes in the current density due to temperature variations. However, removing the changes in the currents caused by temperature variations makes it more straightforward to study the skin and proximity effects, which is the main purpose of this work.
In the FeSi case, a significant amount of the current is transported by arcs in the cavity between the electrode and the alloy or crater wall. The arc has been modelled in a simplified manner by defining a domain with a fixed σ near the electrode tip and between the electrode and the crater wall (see below). We note that an arc does not obey Ohm's Law in Equation [5], and the current and voltage signals will be distorted with some amounts of higher-order harmonics (see Valderhaug, 1992). These effects are not accounted for in these models. However, we expect the model results at/= 50 Hz to yield approximate results for the skin and proximity effects, probably somewhat underestimated as these effects are more pronounced at higher frequencies.
In this work, currents in the steel shell and carbon linings of the furnace are of importance. The model assumes that these regions are continuous and isotropic, and any transition zones such as welded joints in the steel shell and cracks in the linings have not been accounted for.
Model geometries and properties
45 MW FeSifurnace
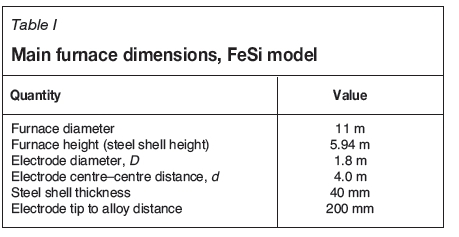
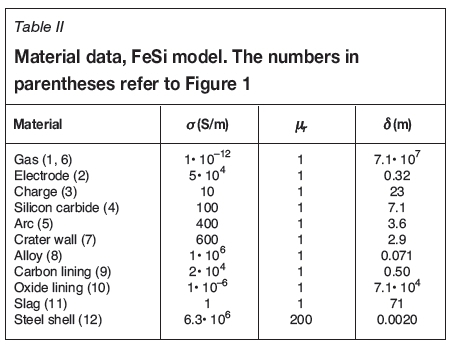
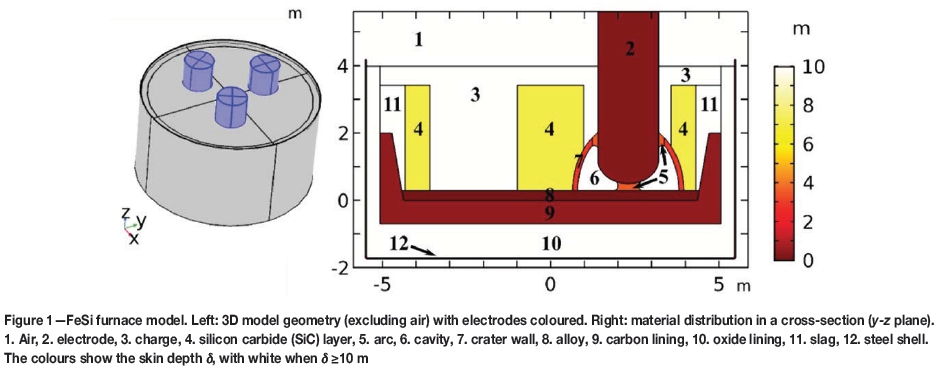
The model geometry of the FeSi furnace is shown in Figure 1. Briefly, at the tip of each electrode (2) a gas-filled cavity is formed (6), and at its bottom a pool of liquid metal is found (8). The dome of the cavity is usually referred to as the crater wall (7). An electric arc forms between the electrode and the crater wall or metal (5). Zones composed primarily of charge (3), silicon carbide (4), and solid slag (11) are included in the model. The carbon lining (9), oxide lining (10), and steel shell (12) complete the model. Table I provides important geometrical data, and Table II lists material data. In Figure 1 and Table II, the value for the skin depth is calculated using Equation [6].
The set-up of the interior material layers and most of the properties are based on the work of Tangstad, Ksiazek, and Andersen (2014) and Krokstad (2014). However, in industrial furnaces there are large uncertainties and variations associated with geometries and electrical properties of the material layers around the electrode tip. On the other hand, the modelled resistance is very sensitive, particularly to details of the arc and the crater wall. For these two layers, the properties and dimensions are chosen with the additional constraint that the total furnace resistance should be reasonable. The input electrode current in all three electrodes is IRMS = 132 kA, assuming that the furnace is operated according to Westly's C3formula (Westly, 1974). Moreover, there is a 120° phase shift in the electrode currents, with an anticlockwise rotation.
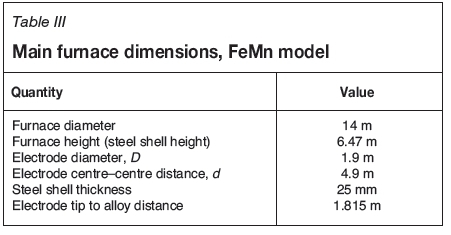
41 MW FeMnfurnace
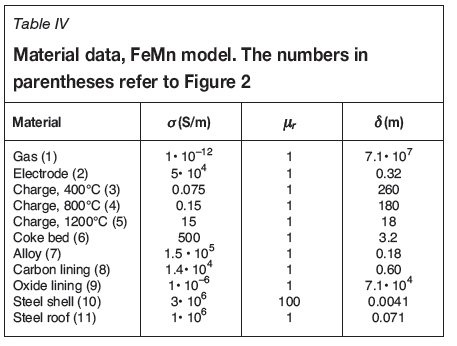
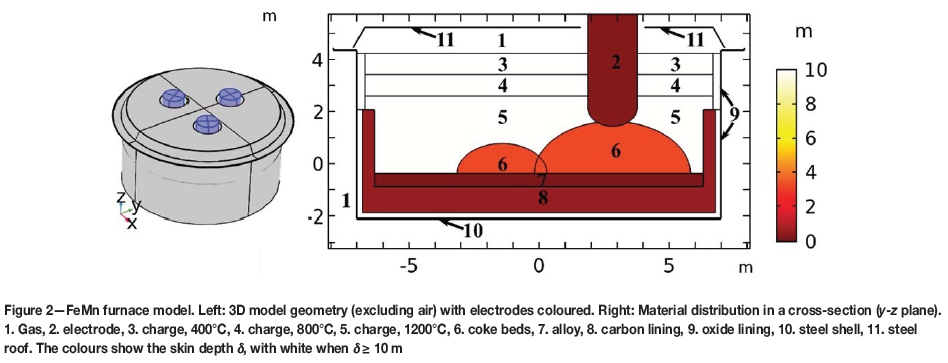
The model geometry of the FeMn furnace is shown in Figure 2. At the tip of each electrode (2), there is a coke bed (6) and at its bottom there is a layer of molten metal (7). The charge zone has been divided into three different zones (3, 4, 5) with varying electrical conductivity. Finally, the carbon lining (8), oxide lining (9), steel shell (10), and steel roof (11) are included in the model. Table III summarizes the important geometrical data, and Table IV provides the material data. The set-up of the interior material layers and most of the properties are based on the work of Dhainaut (2004) and Eidem (2008). There are some differences in the properties of the lining and steel materials between the FeMn and FeSi furnaces, but both are within the typical range for these materials. Realistic current and power conditions were obtained by adjusting the position of the electrode. The input electrode current in all three electrodes is IRMS = 134.3 kA, and there is a 120° phase shift between the electrodes, with an anticlockwise rotation.
Numerical implementation and boundary conditions
The model equations and boundary conditions were implemented and solved numerically using COMSOL Multiphysics 5.3 with the Magnetic and Electric Fields interface (COMSOL Inc., 2017). The low-frequency Maxwell's equations are solved using a potential formulation for the equations. The equations are discretized with the finite element method using quadratic elements. To impose proper boundary conditions on the magnetic field, a large volume of air (with a diameter that is five times larger than the furnace diameter) is included around the furnace. For two electrodes, the total current with a phase shift of 120° is fixed at the boundary. For the third electrode, the current is given by current conservation.
As can be seen from Table II and Table IV, the skin depth δ of the furnace steel shell is approximately 2 mm for the FeSi model, and 4 mm for the FeMn model, i.e., the skin depths are an order of magnitude smaller than the thickness of the shell. This means that the induced eddy currents in the steel shell will flow within a few millimetres of the surface, and only a negligible amount of the current will flow in the interior of the shell. Resolving the large current gradients within a few millimetres of the surface involves a high computational cost, hence the induced currents (and the associated impedance) of the steel shell have been modelled as surface currents, applying COMSOL's impedance boundary condition (COMSOL Inc., 2017). This approximation has been validated by comparison with one simulation that resolves the volume currents of the shell.
Results, case studies
For each case, two simulations have been performed. First, the model has been solved using the properties of air (σ = 1· 10-12 S/m and μΓ= 1) for the steel shell and roof. Effectively, this is the same as solving a model where the effects of the induced steel shell currents are disregarded. These results will capture the proximity effects between the electrodes, but will neglect the proximity effects between the steel shell and the electrodes. Secondly, we solve for the full model, including the effects of the steel domains. By comparing the two simulations it is possible to isolate the effects caused by the induced currents in the steel shell and roof.
In the following presentation of the results, we study the current density norm |J|, the active power density p (W/m3), given by p = |J|2/(2σ), and the reactive power density q (W/m3), given by q = (rf/ μ)|B|2. By integrating p and q over different material domains and the entire furnace, it is possible to study power consumption in different material layers, and the total power consumption and power factor for the full furnace.
45 MW FeSi furnace
Induced currents in the steel shell
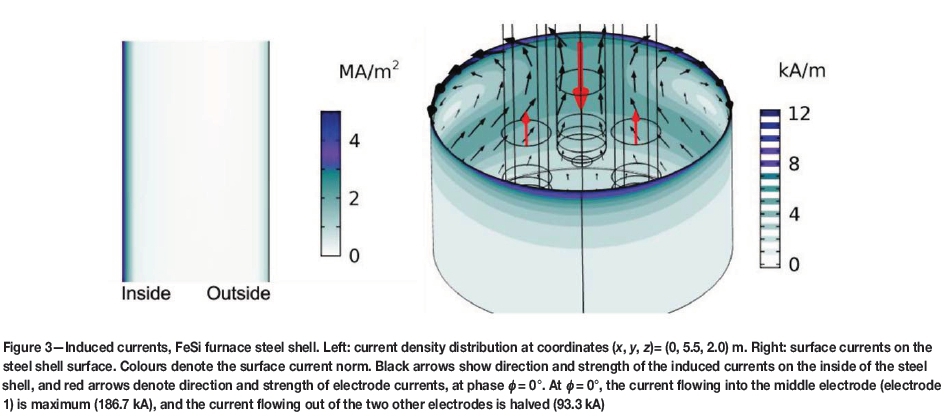
When the furnace steel shell is included, the model results show that there are induced currents in the steel shell. In Figure 3, results for the current density in the steel shell are presented. The left figure shows the results from a fully resolved model. Here, it is clearly shown how the currents accumulate in thin layers on both sides of the steel shell with skin depth δ = 2 mm (see Table II). These results justify the approximation of modelling the steel shell currents as surface currents. The induced currents are typically stronger on the inside surface than the outside. For example, at the level of the electrode tips, the average surface current is 5.05 kA/m on the inside, and 1.36 kA/m on the outside of the steel shell. On the horizontal bottom part, the average surface current is 2.58 kA/m on the inside, and 0.66 kA/m on the outside. The only exception is along the top edge, where the average surface current density is similar on both sides.
We observe that the shell currents essentially follow a pattern opposite to the currents of the electrodes. In the shell, close to an electrode, the inside shell currents are almost vertical, but in the opposite direction compared to the electrode current. In between the electrodes, they are mostly horizontal. Effectively, the shell currents form loops in the opposite direction to the furnace currents. Some of the shell currents continue to the outside, while most of the current loops close at, or near to, the top edge of the furnace shell. Here, the highest current densities are found.
It is interesting to calculate the strength of the currents that flow in the steel shell. To this end, the vertical component of the inside shell current has been integrated along a horizontal curve covering the one-third of the inner perimeter that is closest to electrode 1. Here, electrode 1 means the electrode on the y-axis (see Figure 1). The integration has been performed at vertical level z = 2 m (see Figure 1). The resulting shell current is 29.4 kA, which corresponds to approximately 22% of the current flowing in the electrode. There is a 179° phase difference with the electrode current, i.e., the inside shell current is flowing in the opposite direction with respect to the nearby electrode current.
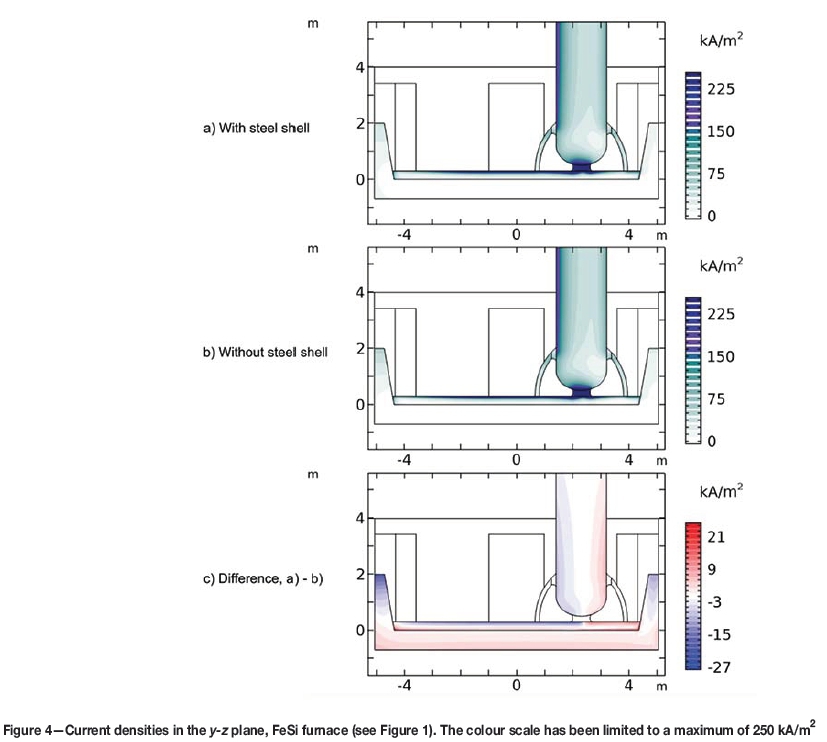
Current density
In Figure 4, results for the current density in a cross-section of the FeSi furnace are shown. The highest current densities are found in the arc between the electrode tip and the alloy and in the skin of the alloy layer. There are also significant currents flowing in the electrode, crater wall, and the carbon lining. In the electrodes, the results of strong skin and proximity effects are clearly visible in the asymmetry of the current distribution. Specifically, more currents on the inside of the electrodes are caused by the proximity effects between the electrodes. In the alloy, owing to the small skin depth (δ = 7 cm), there are very strong skin effects. The simulations also show that there are some currents flowing in the carbon lining. In the model, the carbon lining is connected to the alloy and serves as a parallel connection with the alloy for current flow between the electrodes.
At first glance, comparing the upper and middle figures of Figure 4, the proximity effects of the induced steel shell currents are small. However, by calculating the difference, cf. the bottom figure, some changes can be seen in the electrode, alloy, and carbon lining. For example, in the electrode just above the crater wall, |J| is about 7% higher on the outside, and about 3% smaller on the inside, when the induced steel shell currents are included in the model. In the alloy and lining, there is a considerable shift towards accumulation of currents in the bottom of these layers.
Active and reactive power densities
As mentioned above, the power density p = |J|2/(2σ), i.e., p is proportional to I J I2. Then, within a region with the same σ, the power density variations caused by skin and proximity effects are stronger than the corresponding current density variations. On the other hand, as p is proportional to the material resistivity 1/σ, most of the power in the model is deposited in the arc and the crater wall, and for these areas there are no significant skin and proximity effects.
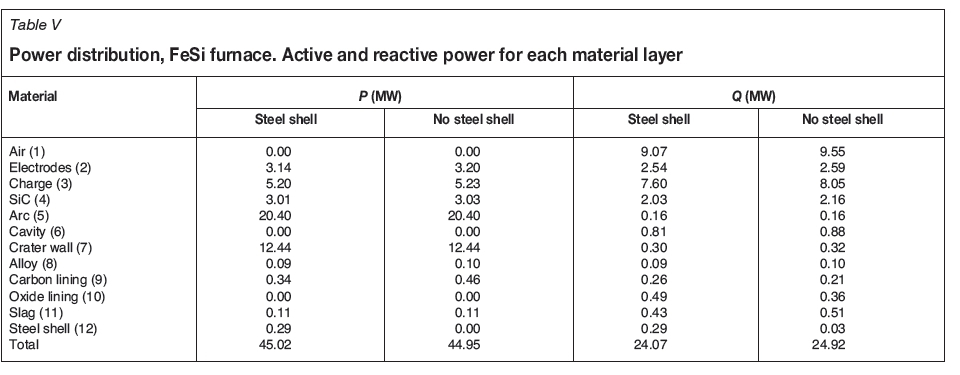
The total active and reactive power of the model can be found by integrating the power density and the reactive power density over the volume of the furnace, and the results can be seen in Table V. The results show that P = 45.0 MW for the furnace. In the case when the steel shell effects are disregarded, P = 44.9 MW, i.e., the furnace power consumption with induced steel shell currents is very similar to the power consumption when the steel shell currents are disregarded. For the reactive power, the results show that Q = 24.1 MW when the steel shell is included, compared with Q = 24.9 MW when not included. The power factor, given by  is 0.882 and 0.875 with and without the steel shell, respectively. Compared with operational data, we expect that the models will significantly underestimate the reactive power in the furnace, as busbars and flexibles are not included.
In Table V, the power values are also analysed for each material layer. Most of the power is deposited in the arc and crater wall, while some power is deposited in the charge, SiC, and electrodes. The rest of the layers contribute only small amounts. Note that the induced currents in the steel shell account for 0.7% of the total power consumption. For the power, there are no significant changes in the different layers when the steel shell effects are included in the model. This result suggests that the proximity effects of the steel shell only change the power distribution internally within the conductive layers of the furnace, whereas the total power for a given material layer is almost constant. For the reactive power contributions, the changes between the two models are slightly more pronounced, particularly in layers that are close to the steel shell.
Electrodes
In the following, the main results for the electrodes are presented. In the model (see Figure 1), the current flowing in the electrode may exit into three distinct material layers: the charge, via the side arcs into the crater wall, and via the tip arc into the alloy. By integrating over the respective boundaries, the results show that approximately 60 kA exits through the side arc to the crater wall, 57 kA through the tip arc, and 14 kA to the charge.
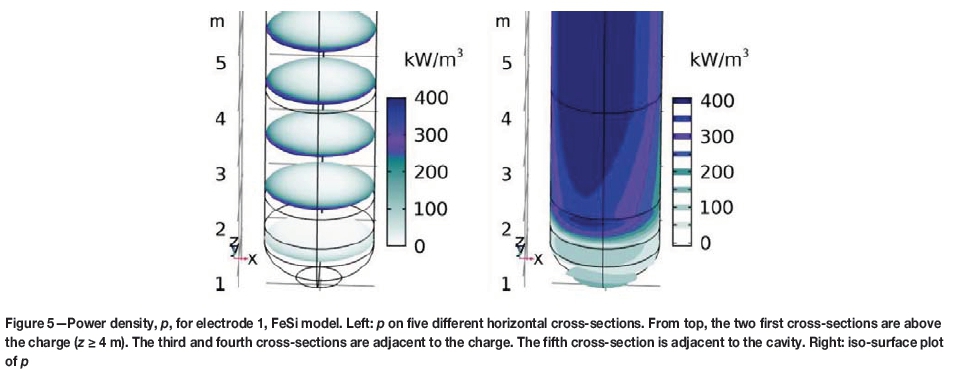
In Figure 5, results for the power density in electrode 1 are presented. The results show that there are strong skin and proximity effects. Note that the power density is strongly biased towards the leading electrode. Comparing with the |J| results in Figure 4, the variations along the circumference are much stronger for p. Approximately 1 m above the electrode tip, there are significant amounts of current flowing into the crater wall. Hence, for the bottom part of the electrode below the crater wall, the power density is significantly reduced.
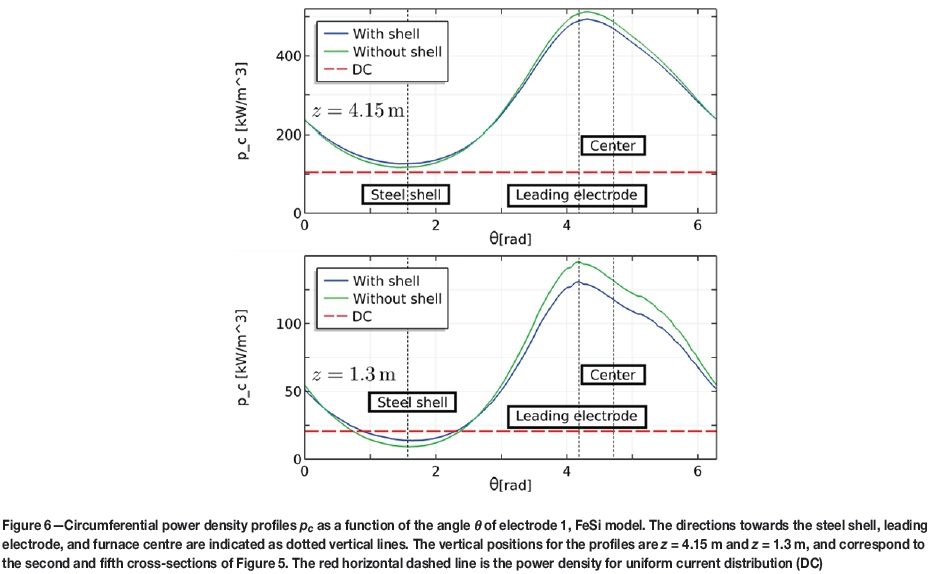
The results in Figure 5 are obtained with the steel shell included in the model. In Figure 6, the results for the power density at the electrode perimeter are given at two different vertical positions, and cases with and without the steel shell are considered. The comparison with the uniform current distribution (red dashed line) clearly shows the importance of including skin and proximity effects for obtaining an accurate description of the power density within an electrode. Comparing the values of the lower figure with the top figure, the power distribution is relatively more asymmetric at z = 1.3 m compared with that above the crater wall. Including the steel shell results in a significant change in the power distribution, particularly in the lower part of the electrode. With the steel shell effects, more of the power is allocated towards the wall and less towards the leading electrode, reducing the asymmetry caused by the electrode-electrode proximity effect.
41 MW FeMn furnace
Induced currents in steel shell and roof
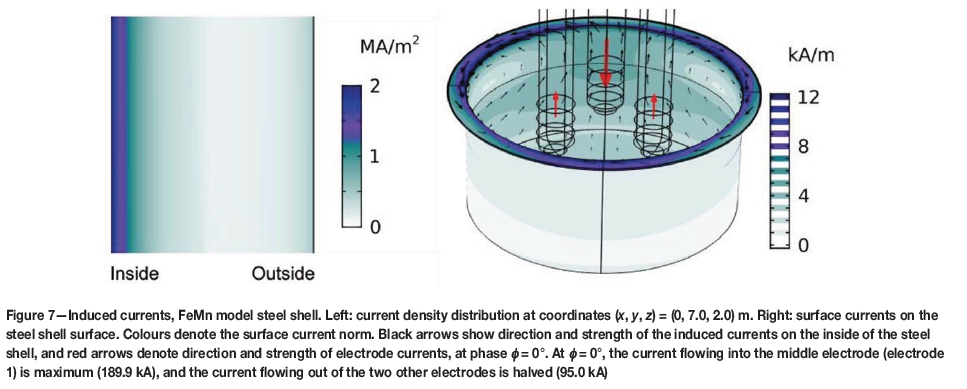
The model results in Figure 7 and Figure 8 show that there are strong induced currents in the steel shell and roof. The left panel of Figure 7 shows results for a fully resolved model exhibiting the steel shell skin effect. Compared with the FeSi model in Figure 3, the skin effect is less pronounced, as the skin depth is greater (<5 = 4 mm, see Table IV). As seen in both panels of Figure 7, the induced currents in the shell are typically stronger on the inside. At the level of the electrode tips, the average surface current is 4.34 kA/m on the inside and 1.38 kA/m on the outside, and on the horizontal bottom part, the average surface current is 3.06 kA/m on the inside and 0.55 kA/m on the outside. Also, note that the shell currents essentially follow the same pattern as for the FeSi case detailed above.
Integrating the vertical component of the inside shell current along a horizontal curve covering the one-third of the inner perimeter that is closest to electrode 1 is used here as a measure of the current that flows in the steel shell. The integration has been performed at vertical level z = 2.5 m (see Figure 2). The result is 35.7 kA which corresponds to approximately 27% of the current flowing in the electrode. There is a 175° phase difference with the electrode current.
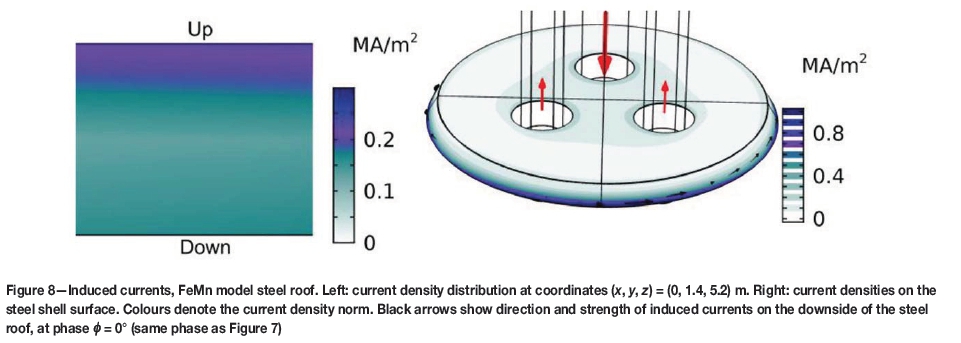
In Figure 8, results for the current densities in the steel roof are shown. Since the skin depth of the nonmagnetic steel roof is much higher than for the magnetic steel shell, there are much less skin effects in the roof, and hence the current density is more uniform. This is clearly seen in the left panel of Figure 8. In the right panel, the current densities on the surface of the roof are shown. There are high current densities associated with the lower edge close to the steel shell. By comparing the results in Figure 8 with the steel shell results in Figure 7, it is clear that the strong roof currents are found in close proximity to the locations of the strong shell currents, but with opposite direction. This indicates that these roof currents may be induced by the strong edge currents of the steel shell.
Current density
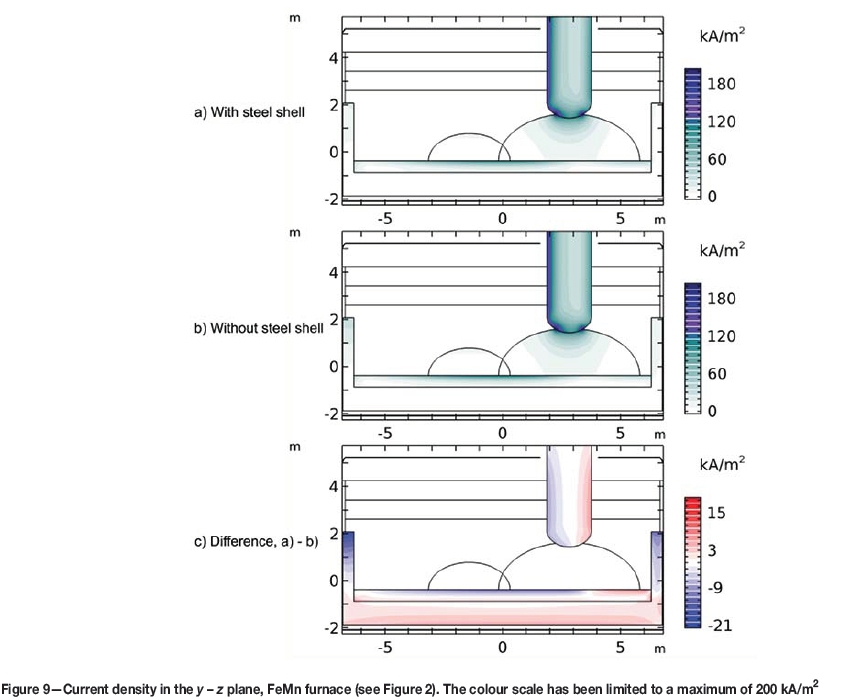
In Figure 9, results for the current density in a cross -section of the FeMn furnace are shown. The highest current densities are found in the skin and tip of the electrode. There are also high current densities in the upper part of the coke bed and in the alloy. As for the FeSi case, the skin and proximity effects are clearly visible in the electrodes. There are also skin effects in the alloy, but compared with the FeSi case in Figure 4, these are less pronounced, as the skin depth (<5 = 18 cm) is greater. The results also show some currents flowing in the carbon lining.
As for the FeSi case, the changes in current density when including the steel shell and roof are confined to conductive layers. In the electrode, |J| is about 7% higher on the outside, and about 4% smaller on the inside, when the induced steel shell currents are included in the model. Also, there is a shift towards accumulation of currents in the bottom of the alloy and carbon lining layers.
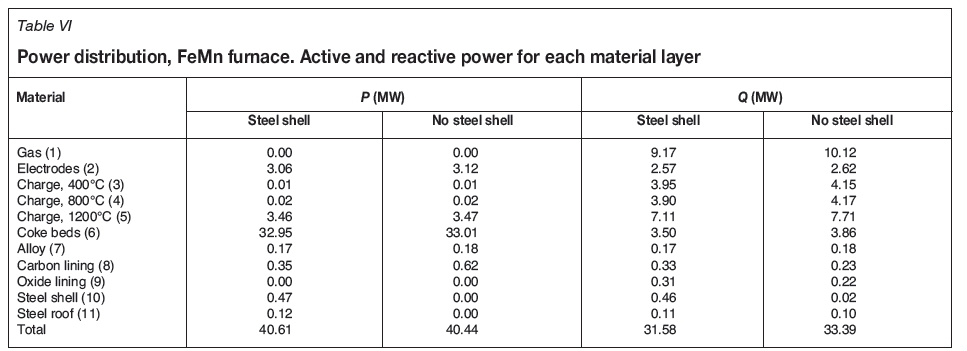
Active and reactive power densities
The results for the active and reactive power can be seen in Table VI. The power obtained is P = 40.6 MW. When the steel shell effects are disregarded, P = 40.4 MW. For the reactive power, the results show that Q = 31.6 MW when the steel shell is included, and Q = 33.4 MW when not included. The power factor, given by  , is 0.789 and 0.771 with and without the steel shell, respectively. However, one should expect that these models will significantly underestimate the reactive power in the furnace, as busbars and flexibles are not included. As for the FeSi case, the steel shell effects are not significant for the modelled furnace power, but the modelled reactive power is reduced by a few percent.
From the analysis for each material layer, approximately 80% of the power is deposited in the coke beds. Some power is deposited in the electrodes and in the charge close to the coke bed, while the rest of the layers consume only negligible amounts. Note that the induced currents in the steel account for 1.5% of the total power consumption. As for the FeSi case, these results suggest that the proximity effects of the steel shell mostly change the power distribution internally within the conductive layers of the furnace, whereas the total power for a given material layer is only marginally affected.
Electrodes
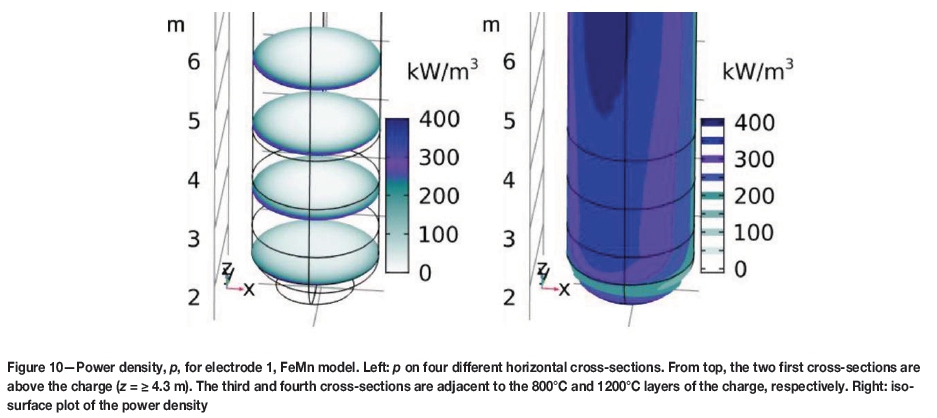
Dedicated results for the electrode are presented in Figures 10 and 11. Most of the current (111 kA) in the electrode exits into the coke bed. The rest (21 kA) exits into the layer of the charge. Compared with the FeSi model, most of the current in the electrode goes all the way to the electrode tip. Consequently, there is a higher power density in the electrode tip region of the FeMn model. This can be seen by comparing Figure 10 with Figure 5. As for the FeSi case, there are strong skin and proximity effects throughout the length of the electrode.
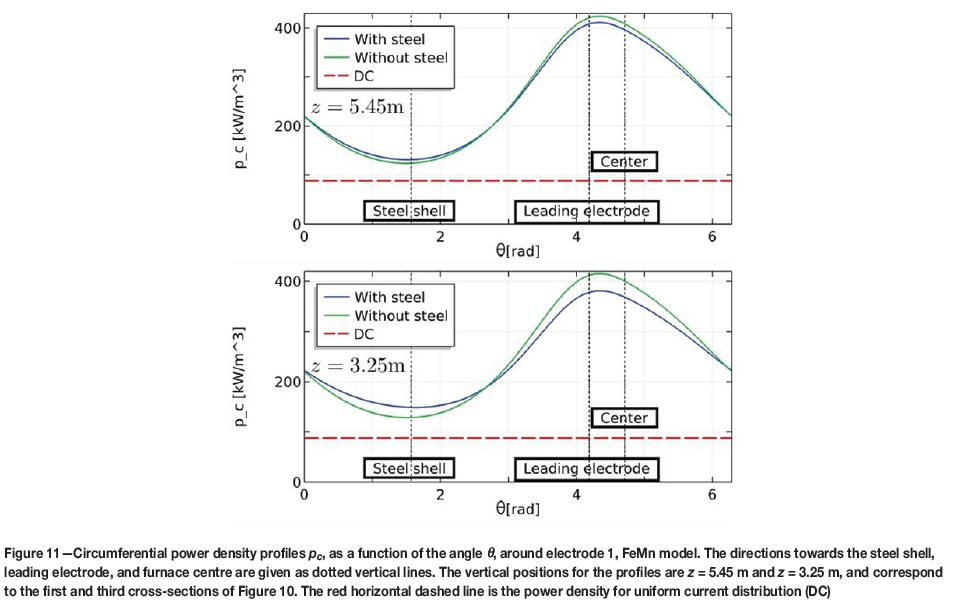
In Figure 11, the results for the power density at the electrode perimeter are given at two vertical positions, both with and without the effects of the steel shell and roof. The steel shell effects are similar to the FeSi case, i.e., the power density increases towards the shell and decreases towards the leading electrode. These effects are most pronounced in the lower part of the electrode below the top edge of the steel shell.
It is also interesting to compare the strength of the proximity effect between the electrodes for both the FeSi and FeMn cases. This can be done by calculating the ratio (pc,max - pc,min)/pc,avg, where pc, max, pc,min and pc,avg, are the maximum, minimum, and average power densities along the electrode perimeter. For the FeSi case in Figure 6, the ratios are 1.31 and 1.85. For the FeMn case in Figure 11, the ratios are 1.11 and 0.94. This means that the electrode proximity effects are stronger in the FeSi furnace.
Conclusions
The use of the low-frequency description of the electromagnetic fields, and including the linings, steel shell, and steel roof in the furnace model, makes the models particularly well-suited for studying the skin and proximity effects in the furnace. The model results show that strong currents are induced in the steel shell and roof. In the steel shell, the induced currents accumulate in the skin, whereas the currents are more distributed throughout the thickness of the nonmagnetic steel roof. On the inside of the shell, the model results exhibit a well-defined circulation pattern in opposite phase compared with proximate currents in the electrodes and hearth of the furnace.
The models yield detailed results for the current and power distributions in material layers within the furnace. The highest current densities are typically found in the electrodes and alloy, and in the material layers connecting these. These interconnecting domains (arc/crater wall in the FeSi model, and coke bed in the FeMn model) are where most of the power is deposited.
The results show that there are strong skin effects in the electrodes and alloy. Also, two different proximity effects are observed. The most significant proximity effect is the electrode-electrode interaction, which leads to strong redistribution of the currents within the electrodes.
Additionally, when the steel shell is included in the model, the results show that there is an additional redistribution of furnace currents caused by proximity effects with the induced steel shell currents. In the electrodes, the steel shell proximity effect competes with the electrode-electrode proximity effect, and effectively reduces the asymmetry in the current and power density. For most material layers, the effects of including the steel shell in the model are negligible, but these may be of importance when studying current and power distributions in the most conductive areas of the furnace, such as the electrodes, the metal bath, and conductive lining. Also, for accurate modelling of the electrical conditions, the steel shell effects were found to modify the reactive power by a few percent.
Acknowledgements
This paper is published as part of the project Electrical Conditions and their Process Interactions in High Temperature Metallurgical Reactors (ElMet), in short Electrical Conditions in Metal Processes (ElMet), with financial support from The Research Council of Norway and the companies Alcoa, Elkem, and Eramet Norway.
References
Bermúdez, A., Bullón, J., and Pena, F. 1998. A finite element method for the thermoelectrical modelling of electrodes. Communications in Numerical Methods in Engineering, vol. 14, no. 6. pp. 581-593. [ Links ]
Bermúdez, A., Bullón, J., Pena, F., and Salgado, P. 2003. A numerical method for transient simulation of metallurgical compound electrodes. Finite Elements in Analysis and Design, vol. 39, no. 4. pp. 283-299. [ Links ]
Bermúdez, A., Carmen Muniz, M., Pena, F., and Bullón, J. 1999. Numerical computation of the electromagnetic field in the electrodes of a three-phase arc furnace. International Journal/or Numerical Methods in Engineering, vol. 46. pp. 649-658. [ Links ]
Bermúdez, A., Gómez, D., and Salgado, P. 2014. Mathematical Models and Numerical Simulation in Electromagnetism. Springer International. [ Links ]
Bermúdez, A., Rodriguez, R., and Salgado, P. 2005. Finite element methods for 3D eddy current problems in bounded domains subject to realistic boundary conditions. An application to metallurgical electrodes. Archhives o/Computational Methods in Engineering, vol. 12, no. 1. pp. 67-114. [ Links ]
Böckmann, O. and Olsen, L. 1968. Skin and proximity effects in electrodes of large smelting furnaces. Proceedings of the 6th International Congress of Electroheat, Brighton, UK, 13-18 May 1968. [ Links ]
COMSOL Inc. 2017. ACDC Module User's Guide. Version: COMSOL 5.3. Burlington, MA. [ Links ]
Darmana, D., Olsen, J.E., Tang, K., and Ringdalen, E. 2012. Modelling concept for submerged arc furnaces. Proceedings of the Ninth International Conference on CFD in the Minerals and Process Industries, Melbourne, Australia, 10-12 December 2012. CSIRO, Melbourne. [ Links ]
Dhainaut, M. 2004. Simulation of the electric field in a submerged arc furnace. Infacon X, Proceedings of the Tenth International Ferroalloys Congress, Cape Town, South Africa, 1-4 February 2004. South Afeican Institute of Mining and Metallurgy, Johannesburgpp. pp. 605-613. [ Links ]
Dunski, V. 1962. Repartition du courant dans les electrodes d'un four triphasé ä arcs en regimes équilibré et déséquilibré. Elektrowärme, vol. 20, no. 10. pp. 503-511. [ Links ]
Eidem, P.A. 2008. Electrical resistivity of coke beds. PhD thesis, Norwegian university of Science and Technology, Trondheim, Norway. [ Links ]
Gunnewiek, L.H., Oshinowo, L., Plikas, T., and Haywood, R. 2004. The application of numerical modelling to the design of electric furnaces. Infacon X, Proceedings of the Tenth International Ferroalloys Congress, Cape Town, South Africa, 1-4 February 2004. pp. 555-564. [ Links ]
Halvorsen, S.A., Olsen, H.A.H., and Fromreide, M. 2016. An efficient simulation method for current and power distribution in 3-phase electrical smelting furnaces. IFAC-PapersOnLine, vol. 49, no. 20. pp. 167-172. [ Links ]
Halvorsen, S.A., Valderhaug, A.M., and Fors, J. 1999. Basic properties of the Persson type composite electrode. Proceedings of the 57th Electric Furnace Conference, Pittsburgh, PA, 14-16 November 1999. pp. 185-204. [ Links ]
Hot, E., Haznadar, Z., and Majer, 1.1980. Improvement of electrode systems in electric reduction furnaces and a non-conventional model for current density measurement. Proceedings of the 9th International Congress of the UIE, Cannes, France, 20-24 October 1980. [ Links ]
Innwer, R., Fidje, K., and Sira, K. 1985. Three dimensional calculations on smelting electrodes. Proceedings of the 43rd Electric Furnace Conference, Atlanta, GA, 10-13 December 1985. pp. 265-272. [ Links ]
Innwer, R., Fidje, K., and Ugland, R. 1986. Effect of current variations on material properties and thermal stresses in Soderberg electrodes. Infacon IV, Proceedings of the Fourth International Ferroalloys Congress, Rio de Janeiro, Brazil, 31 August - 3 September 1986. Finardi, J., Nascimento, J,O, and Homem de Melo, F.D. (eds.). Associação Brasileira dos Produtores de Ferro-Ligas-Abrafe, São Paulo pp. 321-330. [ Links ]
Innwer, R. and Olsen, L. 1980. Calculation of thermal stresses in Soderberg electrodes. Proceedings of the 9th International Congress of the UIE, Cannes, France, 20-24 October 1980. pp. 2-11. [ Links ]
Innwer, R., Olsen, L., and Vatland, A. 1984. Operational parameters for Soderberg electrodes from calculations, measurements, and plant experience. Mintek 50. Proceedings of the International Conference on Mineral Science and Technology, Johannesburg, South Africa, 26-30 March 1984. pp. 787-794. [ Links ]
Jonsson, M.T. and Ingason, H.T. 1998. A three dimensional simulation model for a Soderberg electrode. Infacon VIII, Proceedings of the Eighth International Ferroalloys Congress, Beijing, China, 7-10 June 1998. pp. 383-388. [ Links ]
Kennedy, M.W. 2012. Electric slag furnace dimensioning. Proceedings of the International Smelting Technology Symposium, Orlando, FL, 11-15 March 2012.pp. 279-290. [ Links ]
Krokstad, M.A. 2014. Elektrisk resistivitet i industrielle SiC-lag. MSc thesis, Norwegian University of Science and Technology, Trondheim, Norway. [ Links ]
Larsen, B., Feldborg, H., and Halvorsen, S.A. 2013. Minimizing thermal stress during shutdown of Soderberg electrodes, Infacon XIII, Proceedings of the Thirteenth International Ferroalloys Congress, Almaty, Kazakhstan, 9-12 June 2013, pp. 453-466. [ Links ]
Larsen, H.L. 2006. Current distribution in the electrodes of industrial three-phase electric smelting furnaces. Proceedings of the 2006 Nordic COMSOL Conference, Copenhagen, Denmark, 20 November 2006. [ Links ]
Lupi, S. 2017. Fundamentals of Electroheat.Springer International, Switzerland. [ Links ]
McDougall, I. 2007. Finite element modelling of electric current in AC submerged arc furnaces. Infacon XI. Proceedings of the Eleventh International Ferroalloys Congress, New Delhi, India, 18-21 February 2007. Das, R.K. and Sundaresan, T.S. (eds.). Indian Ferro Alloys Producers Association pp. 630-637. [ Links ]
McDougall, I., Smith, C.F.R., Olmstead, B., and Gericke, W.A. 2004. A finite element model of a Soderberg electrode with an application in casing design. Infacon X, Proceedings of the Tenth International Ferroalloys Congress, Cape Town, South Africa, 1-4 February 2004. South African Institute of Mining and Metallurgy, Johannesburg pp. 575-584. [ Links ]
Meyjes, R., Venter, J., and Van Rooyen, U. 2010. Advanced modelling and baking of electrodes. Infacon XII, Proceedings of the Twelfth International Ferroalloys Congress, Helsinki, Finland, 6-9 June 2010. Vartiainen, A. (ed.). Outotec Oyj. pp. 779-788. [ Links ]
Ramo, S., Whinnery, J.R., and Van Duzer, T. 1994. Fields and Waves in Communication Electronics. Wiley. [ Links ]
Rodriguez, A.A. and Valli, A. 2010. Eddy Current Approximation of Maxwell Equations. Springer-Verlag Italia. [ Links ]
Tangstad, M., Ksiazek, M., and Andersen, J. 2014. An industrial Si furnace excavation - results and observations. Proceedings of Siliconfor the Chemical and Solar Industry XII, Trondheim, Norway, 23-26 June 2014. [ Links ]
Valderhaug, A.M. 1992. Modelling and control of submerged-arc ferrosilicon furnaces. PhD thesis, Norwegian Institute of Technology. [ Links ]
Westly, J. 1974. Resistance and heat distribution in a submerged-arc furnace. Infacon I, Proceedings of the First International Congress on Ferro-alloys, Johannesburg, South Africa, 22-26 April 1974. pp. 121-127. [ Links ]
Westly, J. 1975. Critical parameters in design and operation of the submerged arc furnaces. Proceedings of the 33rd Electric Furnace Conference, Houston, TX, 9-12 December 1975. pp. 47-53. [ Links ]

