


Services on Demand
Article
 English (pdf)
 Article in xml format
 Article references
Indicators

Related links
-
 Cited by Google
 -
 Similars in Google
Share

 Permalink
Journal of the Southern African Institute of Mining and Metallurgy
On-line version ISSN 2411-9717
Print version ISSN 2225-6253
J. S. Afr. Inst. Min. Metall. vol.118 n.6 Johannesburg Jun. 2018
http://dx.doi.org/10.17159/2411-9717/2018/v118n6a6
INFACON XV: INTERNATIONAL FERRO-ALLOYS CONGRESS 2018
Effect of electrode shape on the current distribution in submerged arc furnaces for silicon production - A modelling approach
Y.A. TesfahunegnI; T. MagnussonII; M. TangstadIII; G. SaevarsdottirI
ISchool of Science and Engineering, Reykjavik University, Iceland
IIUnited Silicon, Iceland
IIIDepartment of Material Science and Engineering, NTNU, Norway
SYNOPSIS
This work presents computations of electrical current distribution inside an industrial submerged arc furnace for silicon production. A 3D model has been developed in ANSYS Fluent using an electrical potential solver. The electrode, arc, crater, crater wall, and side arcs that connect the electrode and crater wall are considered for each phase. The shape of the electrodes is considered as a truncated right cone. We assume that several concentrated side-arcs are distributed around the circumference of the electrode near the electrode tip. The number of side arcs varies, depending on the slope of the slant height,. Four simulation conditions are considered by changing the conductivity of the charge and by adding or removing main arcs on seven different configurations of side arcs. The phase voltages in the electrode and current distributions in crater wall are presented. The total current in the crater wall is reduced by 20 to 35% when the charge conductivity is changed by two orders of magnitude, and the phase voltage is very high when the main arc is not taken into consideration. Qualitative analysis shows that our modelling approach gives reasonable results.
Keywords: silicon smelting, submerged arc furnace, electrode shape, current distribution, current paths.
Introduction
Current distribution is critical for proper operation of submerged arc furnaces for silicon production. Control systems do not offer this information as it is not directly measurable, but metallurgists operate furnaces based on their experience and interpretation of available data. A number of recent dig-outs of industrial furnaces have expanded the available information on location-dependent charge properties, thus enabling numerical models with reasonably realistic domain configurations to be constructed. This has the potential to enhance understanding of critical process parameters, allowing more accurate furnace control.
In the silicon production process, quartz and carbon materials are fed into a submerged arc furnace. The raw material mix constitutes the furnace charge. Three electrodes penetrate the charge from above. Electrical energy is provided by the current passed to the charge through the electrodes, each of which carries one of the three phases of 50 Hz AC current, cancelling out at a star point in the charge.
The overall reaction for producing silicon is:
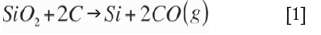
This reaction, however, takes place through a series of sub-reactions, changing the properties of the charge along the way as intermediary reaction products are formed. The current passes from the electrodes through the raw material charge and an electric arc burning at the tip of the electrode. The arc, which consists of thermal plasma in the range of 10 000-30 000 K (Saevarsdottir et al., 2001), provides heat for the energy-consuming silicon-producing reaction (Equation [4]), while the SiC-forming reaction and SiO(g) condensation reactions (Equations [2] and [3]) take place at a lower temperature higher up in the furnace (see Schei, Tuset, and Tveit, 1998).
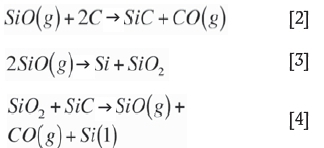
It is extremely important for the silicon recovery in this process that there is a balance between the high-temperature reaction [4] and the low-temperature reactions [2] and [3]. Therefore, it is necessary that sufficient heat is released in the arc to drive reaction [4], while a certain part should be released in the raw material charge to drive reactions [2] and [3]. The stoichiometry of reaction [4] is affected by the temperature, and the ratio is decreased at higher temperature, thus enabling a better silicon recovery. Therefore, sufficient arcing is important for good silicon recovery.
The current distribution is not well known for silicon furnaces, and cannot be directly measured. Saevarsdottir et al. (2011) calculated that the arc could be a maximum of 10-15 cm in length, based on the electrical parameters. Although there have been publications on this subject, (for example Saevarsdottir and Bakken, 2010), results from an accurate model where the current distribution can be calculated have not been published to date.
The geometry of the zones in a silicon furnace depends on the operational history, and hence a number of different geometries, sizes, and compositions are possible in the various parts of the furnace. A report on recent excavations of industrial furnaces published by Tranell et al. (2010) describes the various zones in a FeSi furnace. The results are summarized in Figure 1. Myrhaug (2003) reported similar features from an excavation of a pilot-scale furnace operating at around 150 kW. Tangstad, Ksiazek, and Andersen (2014) published results from excavations of industrial furnaces, where the interior of the furnace is divided into zones according to the materials present and their degree of conversion. Mapping the materifal distribution forms a basis for quantifying the location-dependent physical properties of the charge materials, such as the electrical conductivity.

A master's thesis by Krokstad (2014) describes measurements of the electrical conductivity of silicon carbide, and Vangskásen (2012) looked in detail at the metal producing mechanisms. Molnas (2010) and Nell (2013) have also published data on digout samples and material analysis. These are some of the basic requirements necessary to set up a reasonably realistic modelling domain with the correct physical properties. Therefore there is now a unique opportunity to create a model that enables understanding of the current distribution in the furnace. These results can be used in the development of furnace control strategies in order to improve silicon recovery and current efficiency.
Some researchers have published results on the current distribution in submerged arc furnaces using computational fluid dynamics (CFD) and the finite element method (FEM). Diahnaut (2004) presented computations of the electrical field in a SAF using CFD. The author showed the effect of contact resistance by studying the contact between two coke particles, before dealing with a full-scale furnace. The furnace was partitioned into layers to take account of different materials, and no assumptions were made regarding the current path. Bezuidenhout, Eksteen, and Bardshaw (2009) applied CFD to a three-phase electric smelting furnace to investigate the electrical aspects, thermal aspects, and flow behaviour. They demonstrated the relationships between the electrode positions, current distribution, and slag electrical resistivity. Darmana et al. (2012) used CFD to develop a modelling concept applicable for SAFs that considers various physical phenomena such as thermodynamics, electricity, hydrodynamics, heat radiation, and chemical reactions. Wang et al. (2014) investigated the thermal behaviour inside three different electric furnaces for MgO production.
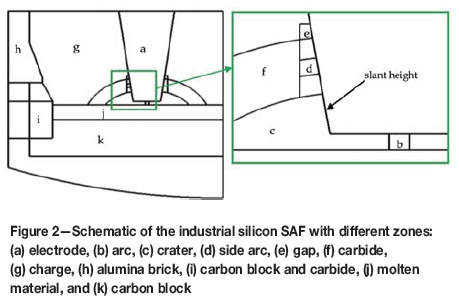
This paper presents computations of electrical current distributions inside an industrial submerged arc furnace for silicon production. A 3D model has been developed in ANSYS Fluent (ANSYS Inc., 2017a) using an electrical potential solver. The electrode, central arc, crater, crater wall, and side arcs that connect the electrode and crater wall are considered for each phase. The geometry of the electrode, for the purposes of the 3D model, is considered as a truncated right conical shape. The upper surface of the electrode is the base of the cone with a radius equals to the radius of the electrode. The radius of the bottom surface of the electrodes changes as the slope of the slant height changes. We assume that several concentrated side-arcs are distributed around the circumference of the electrode near the bottom of the electrodes, and the circular distances between each side arc are held constant. In this paper, the term 'side arc' is used for the configuration with an arc/arcs connecting the electrode and the crater wall. Depending on the slope of the slant height, the number of side arcs also varies. As this analysis pertains to a stationary case, speculation on the possible effect of variability of the phase voltage within the AC (alternating current) period is beyond the scope of this paper. The phase voltages in the electrodes and current distributions in crater walls for different slant height slope are presented.
Computational model
In this section, we describe the mathematical modelling, furnace geometry, material properties, mesh generation, and boundary conditions.
Mathematical modelling
In this paper, we will focus only on the electrical aspects of the SAF. The 3D electrical model is developed in ANSYS Fluent using an electrical potential solver. It will capture neither the time-dependent effects nor the induced magnetic field or the resulting magnetic forces in the system. Since the model considered in this paper is very complex, a quasi-static approach using the potential solver is deemed appropriate as first approach to predict current distributions. For a complete understanding, the time-dependent magnetic effects must be incorporated. A method that includes these effects has been developed and is currently being implemented in ANSYS Fluent. The electrical potential equation is therefore given by the Laplace equation (Darmana et al., 2012):

where φ and a are the scalar potential and electrical conductivity, respectively. Equation [5] is solved using the finite volume method implemented in ANSYS Fluent, version 17.2, based on the User Defined Scalar (UDS) solver. Once it is solved, the electric field (E) and hence the electric current density (/) can be determined using Ohm's Law as shown in Equations [6]) and [7], respectively.
Furnace geometry and material properties
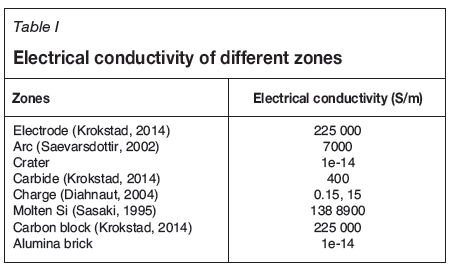
The computational domain is based on the actual design of a 32 MW industrial furnace. A simplified schematic drawing of the furnace is shown in Figure 2. Due to the proprietary nature of the information, the dimensions of the furnace are not indicated. The furnace is partitioned into different zones based on the material properties. The modelling includes the furnace lining, three truncated right conical electrodes, the charge, molten material, three arcs below the electrodes, side arcs, and three craters with crater walls consisting of carbides. For brevity, a section of the furnace and one electrode is depicted in Figure 2. For each phase, two arcs are included: the main arc, burning below the electrode, with arc length of 10 cm and diameter of 5 cm (Saevarsdottir and Bakken, 2010), and a shorter arc connecting the crater wall to the side of the electrode. The curvature of the three crater walls is assumed to be a section of a circle with a diameter of 100 cm (Saevarsdottir, 2002). The crater wall thickness and the circular distance between adjacent side-arcs are set to 30 cm. In this study, seven different configurations of side arcs are simulated, i.e., 4, 5, 6, 7, 11, 12, and 14 arcs. The furnace geometry has been created using ANSYS ICEM-CFD (ANSYS Inc., 2017b) mesh generator software. The electrical conductivity for each of the zones is assumed to be constant. The conductivity of each zone is taken from various literature sources and is summarized in Table I. Two values of charge conductivity are considered, which differ by two orders of magnitudes. Due to the uncertainty in the physical properties of the material in the furnace and the variability between furnaces, it was decided to use two extreme values of charge conductivity to estimate the importance of the result. Alumina brick is an electrically insulating material with high resistivity.
Mesh generation and boundary conditions
Mesh generation is a crucial part of any computational method. It has a significant influence on the runtime and memory use for simulation, as well as the accuracy and stability of the solution. The material volumes described in the preceding subsection were meshed using ICEM-CFD version 17 (2017). The mesh is generated using an unstructured grid because of the complexity of the furnace geometry. After performing a preliminary grid convergence study, different maximum element sizes are set on different parts of the furnace. The maximum elements sizes on arcs, electrodes, crater wall are 2, 10, and 10 cm, respectively, and on the remaining parts 30 cm. To reduce the cell count, the fine unstructured mesh is converted to a polyhedral mesh in ANSYS Fluent, reducing the cell count to almost one-third, enabling faster convergence and saving computational expense.
The model boundary conditions were specified to resemble the actual furnace as closely as possible. The outer furnace walls are set as a nonconductive wall. The top surfaces of the electrodes are defined as conductive walls by applying the respective phase currents as current density. A total current of 99 kA was applied at the top of electrode 1, and a corresponding current density of -49.500 kA on phases 2 and 3, giving a balanced system. The data is based on the design and operational criteria for the modelled furance. The interface walls between different zones are implemented as coupled boundary conditions.
Numerical cases
In this section, we study the effect of electrode shape on current distribution through different parts of the furnace, as well as the phase voltages on the electrodes. In this study, three factors have been considered. The first factor is the number of side arcs, with seven levels; the second is the charge conductivity, with two levels (0.15 and 15 S/m); and the third is the consideration of main arcs ,with two levels (with and without main arcs). Therefore, a total of 28 simulation cases have been performed. For discussion purposes, we group them into four categories. In each category, all the seven levels of side-arcs are considered. We vary only the other two factors, i.e., charge conductivity and presence of main arcs. The four cases are summarized in Table II.
For all cases, the simulations were performed by a second-order upwind scheme based on an implicit formulation. Asymptotic convergence to a steady-state solution is obtained for each case. The solution convergence criterion for all models is the one that occurs first of the following: a reduction of the residuals by twelve orders of magnitude, or a maximum number of iterations of 3000. The simulation time per case is around three hours.
For each simulation, lumped current values for various parts of the furnace were calculated from the current density using ANSYS Fluent's surface integrator. By integrating the current density component along the furnace height direction multiplied by the normal vector for the area associated with it, we obtain the current passing through the area.
As direct experimental verification of these results is not possible, it is reasonable to verify our results based on qualitative analysis. Figure 3 shows current flow on a cross-section through two electrodes. As described in the computational model section, a positive current is applied to electrode 1, and a negative current to electrodes 2 and 3. Current always flows from positive to negative or from high to low potential. As expected, the current flows from electrode 1 to electrodes 2 and 3 (not shown here) through the charge, molten Si, and crater wall. Note that for visualization purposes, the arrows indicate vector direction only, and colour indicates magnitude. To check the amount of current passing through various parts of the furnace, a cross-section between the bottom surface of the electrodes and molten Si is shown in Figure 4. This figure shows the magnitude of current density distribution for the four cases with seven side arcs. In the first two cases (a and b) there is no central arc. The only difference between the two cases is the charge conductivity. It can be seen that the current density of the charge is increased by three orders of magnitudes in (b). At the same time, it is decreased in the crater walls. The same trend can be observed between cases (c) and (d). Moreover, it can be seen that the maximum current density is in the main arcs.
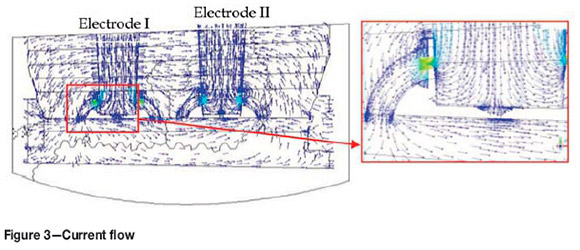
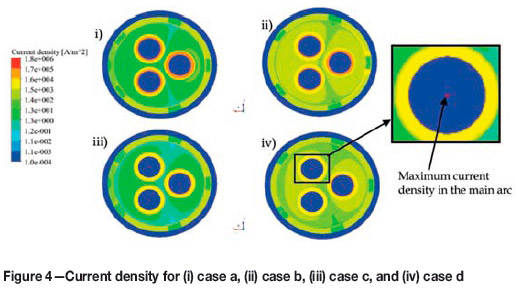
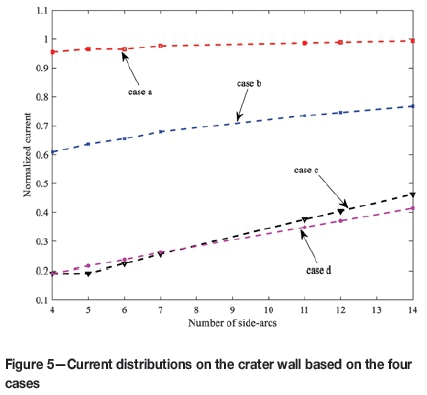
Figure 5 shows the total current through the crater wall for the first electrode of the four cases. The same relationship is observed at the other electrodes. The vertical axis is the normalized current (the fraction of the phase current) and the horizontal axis is the number of side arcs. In all cases, the current on the crater wall is increased as the number of side arcs increase. The main difference between the cases is the degree to which the current increases. A nonlinear relationship is observed in all cases. The current is decreased by approximately 20 to 35% when the charge conductivity is changed by two orders of magnitudes (from case a to b), whereas moving from case c to d, the reduction is approximately 0.06 to 6%.
The industrial furnace considered this study operated at a phase voltage between 100 and 140V. As can be seen in Table III, at least 14 and 12 side arcs are required to generate the correct phase voltage for cases a and b, respectively, whereas in the other instances 4 to 7 side arcs are needed. Using the experimentally obtained electrical properties of SiC (Krokstad, 2014), the resistance in the side-arc/carbide system is too high to obtain a reasonable furnace resistance (and thus voltage) without the presence of a central arc burning against molten Si. This fits poorly with industry observations of electrode movements by tenths of centimeters at a time, which is hard to reconcile with a central bottom arc no longer than 10-15 cm. Hence, to achieve an acceptable phase voltage the carbide layer in the crater wall must be saturated in metal or similar material. Such SiC-metal composite structures have been encountered in excavations (Tranell et al., 2010) as illustrated in Figure 1. This would lead to a much higher conductivity than that observed for the dry carbide.
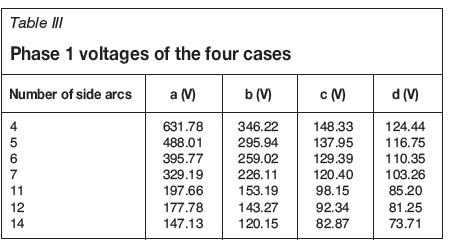
In general, the trend that can be observed in Table III is that as the number of side arcs increases (increasing slope of the slant height), the voltage decreases. Further study is required to confirm if this trend is present in the case of AC. Also, increasing the charge conductivity decreases the voltage. This means that the resistance of the furnace decreases due to the increasing electrical conductivity of the system.
Conclusions
This paper presents computations of electrical current distributions inside an industrial submerged arc furnace for silicon production. A 3D model has been developed in ANSYS Fluent using an electric potential solver. The electrodes, arcs, crater, crater wall, and side arcs that connect the electrode and crater wall are considered for each phase. The shape of the electrodes is considered as a truncated right cone. We assume that several concentrated side-arcs are distributed around the circumference of the electrode near the bottom the electrodes. Depending on the slope of the slant height, the number of side arcs varies. The phase voltage in the electrodes and current distributions in crater walls for different slant height slopes (number of side arcs) are presented. Variation in the number of side arcs has been considered, and each case was simulated four times, changing the charge conductivity and adding or removing a central arc. It was observed that the total current in the crater wall is decreased by 20 to 35% when the charge conductivity is changed by two orders of magnitude without a main arc. However, the decrease is negligible when the central arc is included. The phase voltage is very high when the main arc is not taken into account - in this case, to obtain a reasonable furnace resistance, the carbide layer in the crater-wall must be saturated in metal or similar material that has a higher conductivity than the dry carbide.
Acknowledgements
The Icelandic Technology Development Fund is gratefully acknowledged for their funding of this work.
References
ANSYS Inc. 2017a. FLUENT, ver. 17.0. Canonsburg, PA. [ Links ]
ANSYS Inc. 2017b. ICEM-CFD, ver . 17.0. Canonsburg, PA. [ Links ]
Bezuidenhout, J., Eksteen, J., and Bardshaw, S. 2009. Computational fluid dynamic modelling of an electric furnace used in the smelting of PGM containing concentrates. Minerals Engineering, vol. 22. pp. 995-1006. doi:https://doi.org/10.1016/j.mineng.2009.03.009 [ Links ]
Darmana, D., Olsen, J., Tang, K., and Ringldalen, E. 2012. Modelling concept for submerged arc furnaces. Proceedings of the Ninth International Conference on CFD in the Minerals and Process Industries. CSIRO, Melbourne. [ Links ]
Dhainaut, M. 2004. Simulation of the electric field in a submerged arc furnace. INFACON X. Proceedings of the Tenth International Ferroalloys Congress, Cape Town, South Africa. Southern African Institute of Mining and Metallurgy, Johannesburg. [ Links ]
Krokstad, M. 2014. Electrical resistivity of industrial SiC crusts. MSc thesis, NTNU, Trondheim, Norway. [ Links ]
Myrhaug, E. 2003. Non-fossil reduction materials in the silicon process - properties and behavior. PhD thesis, NTNU, Trondheim, Norway. [ Links ]
M0lnás, H. 2010. Investigation of SiO condensate formation in the silicon process. Project report in TMT 4500. NTNU, Trondheim, Norway. [ Links ]
Nell, J. and Joubert, C. 2013. Phase chemistry of digout samples from a ferrosilicon furnace. INFACON XIII. Proceedings of the Thirteenth International ferroalloys congress, Almaty, Kazakhstan. [ Links ]
Saevarsdottir, G. and Bakken, J. 2010. Current distribution in submerged arc furnaces for silicon metal/ ferrosilicon production. INFACON XII. Proceedings of the 12th iInternational Ferroalloys Congress, Helsinki, Finland, 6-9 June 2010. [ Links ]
Saevarsdottir, G., Bakken, J., Sevastyanenko, V., and Liping, G. 2001. Arc simulation model for three-phase electro-metallurgical furnaces. INFACON IX. Proceedings of the 9th International Ferroalloys Congress, Quebec City, Canada. [ Links ]
Saevarsdottir, G., Bakken, J., Sevastyanenko, V., and Liping, G. 2011. High power ac arcs in metallurgical furnaces. High Temperature Material Processes, vol. 15, no. 3. doi: 10.1615/HighTempMatProc.v5.i1.20 [ Links ]
Sasaki, H., Ikari, A., Terashima, K., and Kimura, S. 1995. Temperature dependence of the electrical resistivity of molten silicon. Japanese Journal of Applied Physics. doi:https://doi.org/10.1143/JJAP.34.3426 [ Links ]
Schei, A., Tuset, J., and Tveit, H. 1998. Production of High Silicon Alloys. Tapir Forlag, Trondheim, Norway. [ Links ]
Saevarsdottir, G. 2002. High current ac arcs in silicon and ferrosilicon furnaces. PhD thesis, NTNU, Trondheim, Norway. [ Links ]
Tangstad, M., Ksiazek, M., and Andersen, J. 2014. Zones and materials in the Si furnace. Proceedings of Silicon for the Chemical and Solar Industry XII, Trondheim, Norway. [ Links ]
Tranell, G., Andersson, M., Ringdalen, E., Ostrovski, O., and Steinmo, J.J. 2010. Reaction zones in a FeSi75 furnace - results from an industrial excavation. INFACON XII. Proceedings of the 12th International Ferroalloys Congress, Helsinki, Finland, 6-9 June 2010. pp. 709-715. [ Links ]
Vangskásen, J. 2012. Metal-producing mechanisms in the carbothermic silicon process. MSc thesis, NTNU, Trondheim, Norway. [ Links ]
Wang, Z., Fu, Y., Wang, N., and Feng, L. 2014. 3D numerical simulation of electrical arc furnaces for the MgO production. Journal of Materials Processing Technology. pp. 2284-2291. doi:http://dx.doi.org/10.1016/j.jmatprotec.2014.04.033 [ Links ]

