


Services on Demand
Article
 English (pdf)
 Article in xml format
 Article references
Indicators

Related links
-
 Cited by Google
 -
 Similars in Google
Share

 Permalink
Journal of the Southern African Institute of Mining and Metallurgy
On-line version ISSN 2411-9717
Print version ISSN 2225-6253
J. S. Afr. Inst. Min. Metall. vol.118 n.6 Johannesburg Jun. 2018
http://dx.doi.org/10.17159/2411-9717/2018/v118n6a3
INFACON XV: INTERNATIONAL FERRO-ALLOYS CONGRESS 2018
Reduction of Kemi chromite with methane
M. LeikolaI; P. TaskinenI; R.H. EricI, II
IDepartment of Chemical and Metallurgical Engineering, Aalto University, Espoo, Finland
IISchool of Chemical and Metallurgical Engineering, Johannesburg, South Africa
SYNOPSIS
Kemi chromite ore from Finland was reduced in CH4-H2 gas mixtures at temperatures from 1100° to 1350°C. Experimental variables were time, temperature, and the CH4 content of the gas mixture. The phases in reacted samples were determined by XRD and quantitative phase analysis was performed using the Rietveld method. Particle morphology and phase compositions were determined using SEM and EDS analysis. Reduction proceeded through a shrinking core model in two stages. In the first stage, hydrogen and carbon from the cracking of methane reduced the iron and some chromium to carbides. The chromium in the remaining spinel was reduced during the second stage. Iron was essentially reduced in full after 30 minutes when the temperature reached 1300°C, and at 1350°C it was completely reduced within 20 minutes. At this highest temperature, all of the chromium was eventually reduced, the residue consisting of aluminum and magnesium oxides with varying amounts of silica. At the surface of the particle iron and chromium, together with carbon, formed two alloys, an iron-dominated and a chromium-based one. The iron-based phase was partially molten at the higher temperatures. At 1300°C and 1350°C the metallization was complete. Reduction of Kemi chromite with a CH4-H2 mixture is judged as highly efficient, since high of reduction extents could be reached faster at lower temperatures compared to carbothermic reduction. This is attributed to the very high activity of carbon (way above 1.0) due to the cracking of methane into hydrogen and carbon at around 550°C in the presence of a solid phase.
Keywords: chromite, solid-state prereduction, methane, hydrogen.
Introduction
Stainless steel is, and will continue to be, a crucial material for modern civilization, as more materials are consumed by the growing population world. Chromite ore contains chromium and iron along with other elements (Lyakishev and Gasik, 1998). It is the raw material for producing ferrochrome, mainly a mixture of iron and chromium, which is used as an alloying material in the process of manufacturing stainless steel (Murthy, Tripathy, and Kumar, 2011). In chromite ores, the major metal cations are often in the forms Fe2+, Fe3+, and Cr3+, and the general formula is FeCr2O4, which has a spinel-type structure. Depending on the deposit, other cations such as Al3+ and Mg2+ can be found occupying some of the interstitial octahedral and tetrahedral sites of the spinel (Lyakishev and Gasik, 1998).
Reduction of the iron and chromium oxide components is needed to produce metallic ferrochrome. Currently, this is done in electric submerged arc furnaces (SAFs) using coke as the reductant. This requires high temperatures and therefore the furnace consumes a lot of electricity (Basson and Daavittila, 2013). It is possible to prereduce the chromite ore pellets in solid form before charging them into the SAF. This procedure lowers the electricity consumption in the SAF, due to the lesser extent of the Boudouard reaction.
The solid-state prereduction can be performed by utilizing carbon (Niayesh and Dippenaar, 1992; Kekkonen, Xiao, and Holappa, 1995), a methane-hydrogen mixture (Anacleto and Ostrovski, 2004; de Campos and Eric, 2006), or hydrogen (Arvanitidis, 1996). Reduction of chromite with a methane-hydrogen gas mixture is the most energy-efficient, since reduction takes place at a lower temperature (Anacleto and Ostrovski, 2004; de Campos and Eric, 2006). This is due to the high activity of the carbon (Anacleto and Ostrovski, 2004). At temperatures above 550°C, due to the cracking of methane, the activity of precipitating carbon starts to rise exponentially, well exceeding 1.0 (with respect to pure solid graphite, which would have unit activity). This is well known thermo-dynamically and is due to the fact the precipitated carbon is not yet in graphitic form (Taskinen, Fabritius, and Eric, 2014). The reaction mechanism is based on the adsorption of methane onto the active oxide surface. After adsorption, the methane cracks into hydrogen gas and solid carbon as described in Equations [1]-[6]:
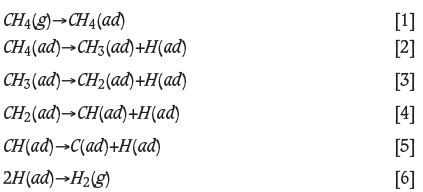
resulting in the overall reaction of methane adsorption on the oxide's active surface as in Equation [7]

The overall reaction for reduction of chromium by methane oxide can be represented as:

This reaction mechanism has been proposed for both pure chromium oxide (Anacleto and Ostrovski, 2004) and natural chromite (de Campos and Eric, 2006). In the present work, the aim was to investigate the characteristics of methane reduction for a specific chromite mined in Kemi, Finland.
Materials and methods
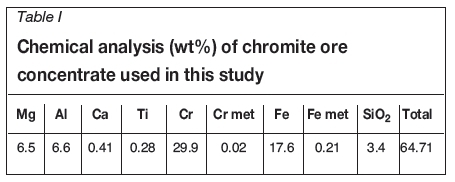
Chromite ore from Kemi has a relatively low Cr/Fe ratio, but due to the mine's proximity to a stainless steel plant, it is nevertheless a profitable deposit for mining (Huovinen, 2007). XRD analysis of the received concentrate indicated that Mg-Al-Cr-Fe spinel was the main mineral in the sample, with very little separate silica phase. A chemical analysis of the raw material is presented in Table I.
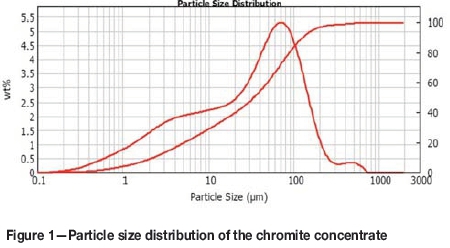
The particle size distribution of the concentrate is shown in Figure 1. The analysis was done using a Mastersizer 2000 from Malvern Instruments. Five measurements were conducted using 4 bar dispersion pressure and Fraunhofer approximation for the calculations.
The reduction experiments were conducted on a loose bed of chromite concentrate powder in a closed, horizontal-tube electric furnace. One gram of Kemi chromite concentrate was reduced for various time intervals (10, 20, 30, 60, 90, and 120 minutes) in controlled atmospheres of varying CH4-H2 contents (10, 20, and 30 vol% CH4). Gas flow through the furnace was kept constant at 1 l/min. The reduction temperatures were 1100, 1200, 1300, and 1350°C. Argon was used for a reference test and as an inert gas for purging the furnace. The gas components used were instrumental argon (Ar 99.999%), industrial hydrogen (H2 99.99%), and industrial methane (CH4 99.5%), all supplied by AGA, a member of the Linde Group. Alumina crucibles were used as sample holders for the chromite concentrate.
Phase characterization of the reduced samples was done by X-ray diffraction (XRD), using an X'pert PRO by PANalytical. Quantitative phase analysis was by the Rietveld method (Hem et al., 2009) with PANalytical's X'Pert HighScore Plus program. SEM-EDS analysis was performed using a LEO model 1450 VP and Oxford Instruments INCA software. The amount of carbon in the samples was determined using an Eltra CS-2000 S/C analyser.
The isothermal sections and liquidus contour diagrams of the C-Cr-Fe system were calculated with MTDATA software (Davies et al., 2002) using the iron-base alloy database TCFe (National Physical Laboratory, 2015). The calculation included 21 possible condensed phases. The gas phase was excluded because it is of only minor importance in the calculations and phase equilibria of the system.
Results and discussion
Reduction mechanism
SEM analysis clearly showed that an outer layer of metal carbides formed, with inner layers of partially reduced chromite. Beneath the partially reduced regions, there was an unreacted core with the same composition as the raw material. This is referred to as a shrinking core mechanism and it has been observed previously for chromite reduction with methane (de Campos and Eric, 2006). The shrinking core was observed throughout the experimental series and it appeared to form in two stages. In the first stage, the iron is completely reduced along with part of the chromium. In the second stage, the rest of the chromium is reduced completely.
An example of the first reduction stage can be seen in Figure 2, where the outer layer is almost white, the partially reduced area is a darker gray, and the unreacted core is a lighter gray. Reduction was carried out at 1100°C, with 10 vol% CH4, for 20 minutes. EDS analyses were performed on the points indicated in the image. The compositional trends are shown in Figure 3. An EDS analysis of the raw material is also illustrated (dashed lines) in order to demonstrate that the core is, in fact, unreacted chromite ore. Small amounts of calcium and titanium are excluded from the data for clarity reasons.
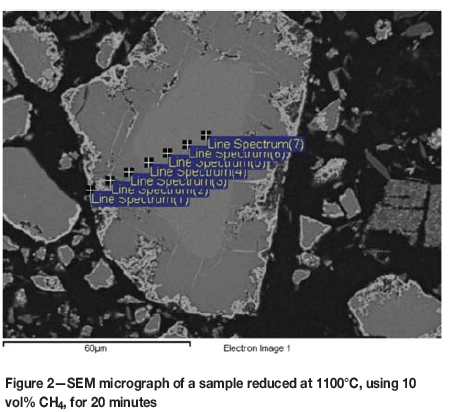
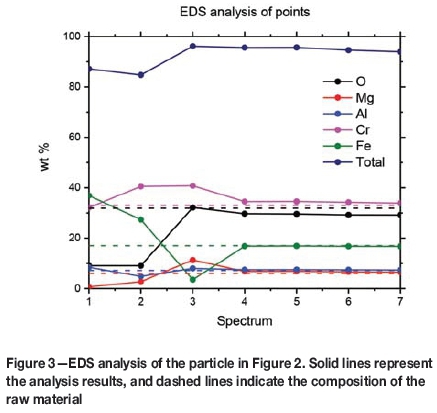
Spectra 4 to 7 are taken from the unreacted core. Their compositions match relatively well with the dashed lines representing the raw material before reduction. Spectrum 3, which falls inside the darker grey area, has a significantly lower iron content, indicating that iron has been reduced to the metallic form and diffused to the surface, represented by spectrum 1. The amounts of chromium and magnesium are higher in spectrum 3, because most of the iron has been removed from this area. Spectrum 1 is on the white outer rim of the particle. It consists mostly of iron and chromium, with the oxygen content considerably lower than in other regions. This indicates that the outer layer is mostly metallic chromium and iron.
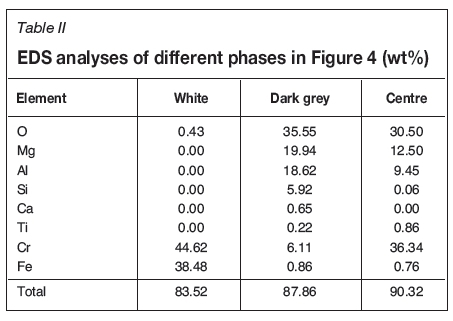
Figure 4 and Table II show the SEM micrograph and EDS analysis for a particle in the second stage of the shrinking core process, where iron has been almost completely reduced and chromium reduction is advancing. Table II shows the average EDS analysis results for the white areas, dark grey rims around the white beads, and central areas. Reduction was performed at 1300°C, with 30 vol% CH4, for 120 minutes. The small amounts of calcium and titanium were again excluded from the data for clarity reasons.
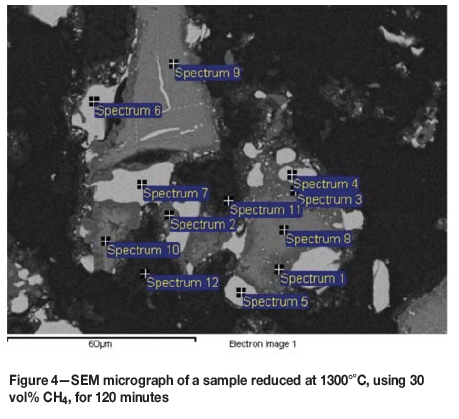
The iron content is very low (< 1 wt%) outside the white areas. The chromium concentration here behaves more like the iron did in the sample depicted in Figure 2, first decreasing, but then increasing towards the centre. This indicates that almost all the iron has been reduced and has accumulated in the white areas as carbides, while chromium reduction is advancing towards the core of the particle.
It can be seen from Table II that the bright areas in Figures 2-4 consist mostly of iron and chromium. However, the samples for SEM analysis were coated with carbon and therefore the EDS analysis excludes all carbon. The total mass of material is lower in the lighter areas, and therefore it can be concluded that there is also carbon in the light areas on the edges of the particles. This indicates that iron and chromium might form carbides as they are reduced, which was observed by Soykan, Eric, and King (1991) with solid carbon as the reductant.
Figures 2 and 4 both show that the reduction also advances within the particle along cracks that form along the crystalline structure of the chromite spinel. This has also been observed in other studies (de Campos and Eric, 2006; Soykan, Eric, and King, 1991; Perry, Finn, and King, 1988).
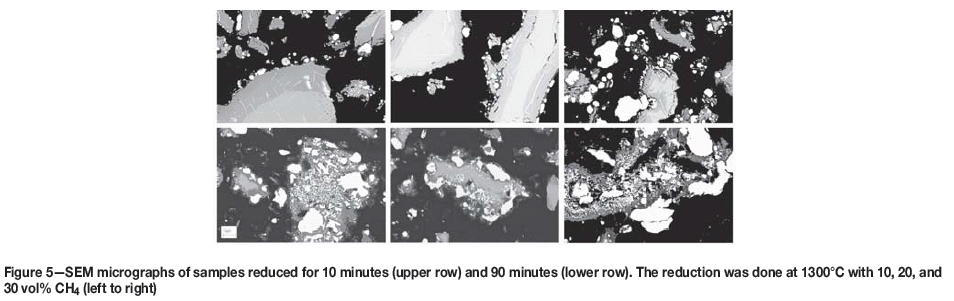
In addition to the particles reducing through the shrinking core mechanism, collapsed particles were present in all the samples. The shrinking core mechanism was observed to be dominant in the earlier stages of the reduction. As reduction progresses, the particles start to collapse, resulting in reduction also inside the particle and not just on the outer surface, and in small cracks inside the particle. This is evident in Figure 5, which compares the particles reduced at 1300°C with varying methane concentrations for 10 min and 90 minutes' reduction time. The upper row of micrographs is with 10 minutes' reduction time and the lower is with 90 minutes. The methane contents of the gas mixture are 10, 20, and 30 vol%. This illustrates a change in the reduction mechanism with reduction time.
Iron metallization
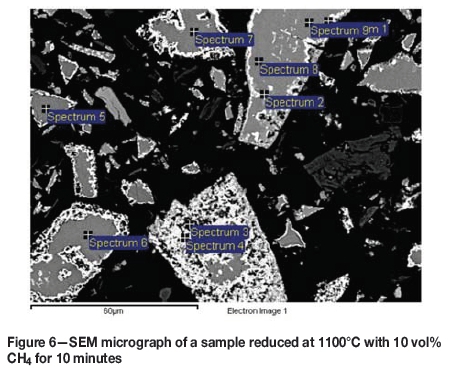
The first stage of reduction advances significantly in the first 10 minutes at all temperatures and with all CH4-H2 mixtures. A micrograph and EDS analysis of the reduced areas in the sample reduced with 10 vol% CH4 at 1100°C for 10 minutes are shown in Figure 6. The white reaction product layers on the edges of the particles are clearly visible.
At 1300°C practically all the iron was reduced and had diffused into the metallic phase (white areas). Figure 7 compares two micrographs of samples reduced at 1300°C with 10 vol% CH4 for 20 and 30 minutes. Table III shows the EDS analyses of the grey areas in the centre of the particles.
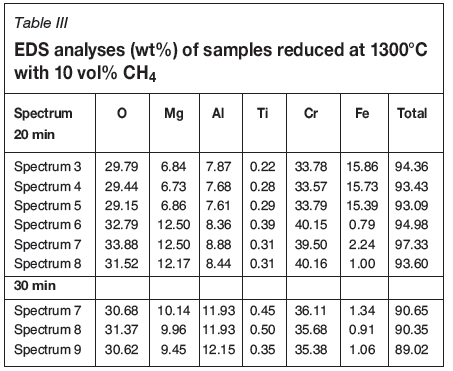
After 20 minutes, the centre of the particle still contains unreduced material (in spectra 3 to 5), where the iron content is around 15 wt%, which is very close to the 17 wt% of the raw material. However after 30 minutes' reduction time, this phase is no longer detectable and the iron content throughout the particle's grey centre is around 1 wt%. The same phenomenon occurs at 1300°C regardless of the methane content used. When the temperature increases to 1350°C, the unreacted phase is barely detectable after 20 minutes' reduction time.
Chromium metallization
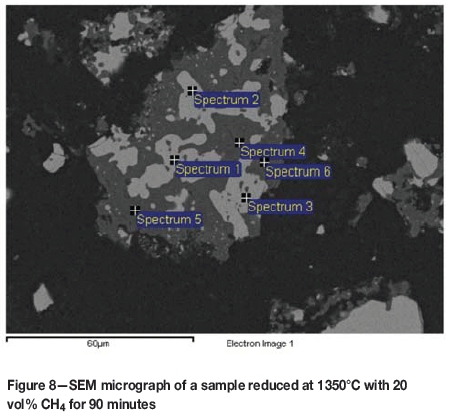
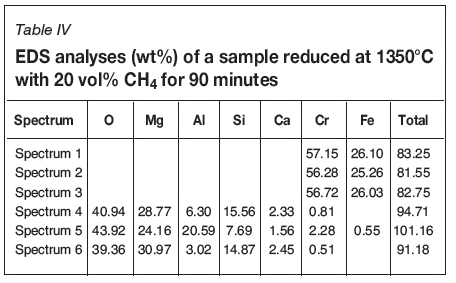
Generally, the iron-depleted, but still chromium-rich, intermediate phase disappeared at 1350°C with a reduction time of 60 minutes or more and a CH4 content of 10 or 20 vol%. With 30 vol% CH4, reduction for 30 minutes resulted in the disappearance of the phase, indicating that full reduction was achieved. A typical micrograph and EDS analysis of the samples reduced at 1350°C for 90 minutes are shown in Figure 8 and Table IV. Only two phases remain in the particle; the light grey areas of iron-chromium carbide and grey areas consisting of Mg-Al spinel with some Si, Ca, and traces of Fe and Cr.
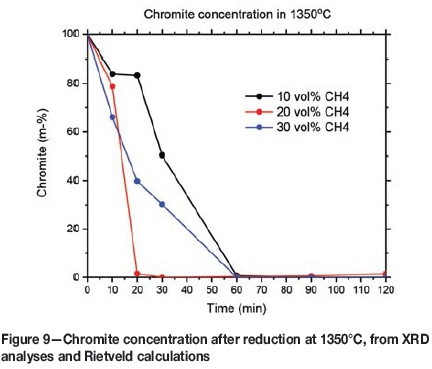
Full chromite reduction at 1350°C was also supported by the XRD analyses and Rietveld calculations. The chromite concentrations in samples reduced at 1350°C are presented in Figure 9. Utilizing 20 vol% methane resulted in faster reduction than 30 vol% methane. This could be due to more solid carbon accumulating on the surface of the sample at 30 vol% methane, hindering diffusive gas flow to the chromite surface.
Iron- and chromium-based alloys
During the second stage of reduction, the fraction of chromium in the reduced phase increases as the process advances. More chromium accumulates in the reduced (white) metallic areas, until the phase becomes saturated with it. At this point a chromium-based phase starts to form within the reduced phase. The two phases are visible in several samples and were analysed where the surface areas were large enough for EDS analysis. Figure 10 shows a SEM micrograph in which the two phases are clearly distinguishable at the right-hand side of the image. At the left-hand side, the phases have begun to separate, but the surface of the particle was not suitable for EDS analysis. This image shows how the separation of the two phases progresses through growth of smaller formations towards larger phase areas as diffusion progresses. The EDS analyses for the two phases in the right-hand side particle are listed in Table V.
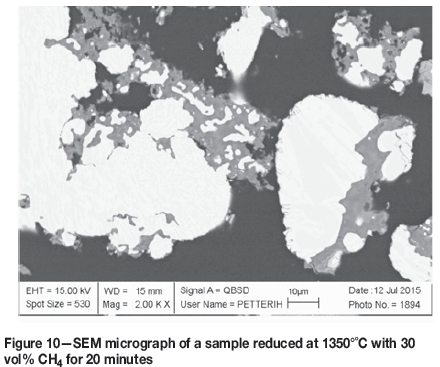
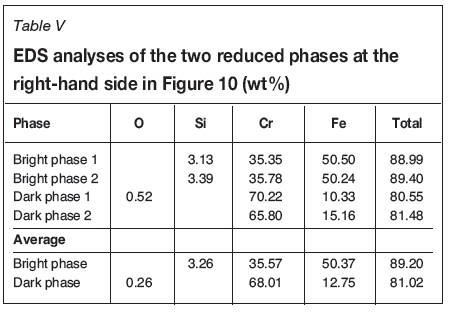
The darker grey phase consists mostly of chromium and the brighter grey phase contains mostly iron. Therefore, the darker phase is the new, chromium-based alloy. In both examples, the brighter phase has a higher total analysis, which indicates that the darker phase contains more carbon than the bright phase. A rough evaluation of the Cr-Fe-C ternary plot at 1300°C, presented in Figure 11, indicates that the iron-based phase is partly molten, but the chromium-based phase is completely solid. The sharp corners of the areas of chromium-based alloy in Figure 10 also confirm that the phase is formed as a solid. The composition of the iron-based phase is depicted with green lines in Figure 11, and that of the chromium-based phase with red lines.
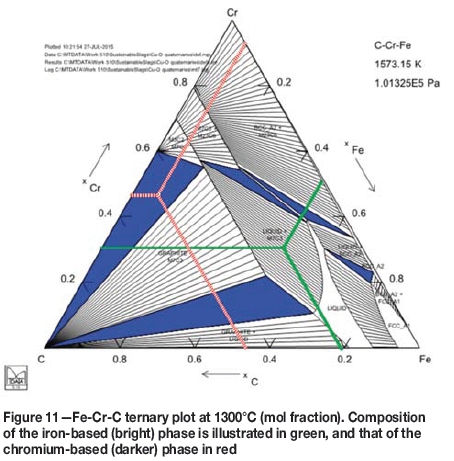
The compositions of the phases in Figure 11 were calculated as an average from all the analyses of the two phases throughout the samples where they were present. Carbon was then assumed to balance the total to 100%, but it should be noted that some silica remains in the iron-based phase, and a very small amount of oxygen is present at some of the analysis points. Also, the ternary plot represents a system in equilibrium, but all the obtained results are from systems that most probably are not in equilibrium, but at a stage of transformation. The illustration is therefore just an approximation of a more complex system.
Summary and conclusions
Chromite concentrate from the Kemi deposit in Finland was reduced in CH4-H2 atmospheres. Altogether 72 experiments were conducted with three variables: temperature, time, and the content of methane in the feed gas mixture. The reduction temperatures were 1100°, 1200°, 1300°, and 1350°C and the reduction times 10, 20, 30, 60, 90, and 120 minutes. Three methane contents were used; 10, 20, and 30 vol%, with the balance H2.
The reduction was observed to proceed mainly through a shrinking core mechanism in two stages. In the first stage, carbon from the cracking of methane reduces the iron and some chromium to carbides. After this, and partly overlapping with the first stage, a second stage of reduction begins, in which the chromium in the remaining spinel is reduced. The second reduction stage takes place at 1200°C and above.
Iron was essentially completely reduced after 30 minutes at 1300°C. As the temperature was increased to 1350°C, the iron was almost completely reduced from the chromite after 20 minutes. At the highest temperature, 1350°C, all of the chromium was eventually reduced after 30-60 minutes, resulting in residual aluminum and magnesium oxides with varying amounts of silica being left from the original Kemi chromite. As chromium reduction proceeded, two separate metallic phases were formed in the reduced areas, one iron-based and one chromium-based.
Metallization was observed to start immediately after the chromite was exposed to CH4-H2 mixtures, as chromite reduction to metal was observable after only 10 minutes of reduction time. At temperatures of 1300°C and 1350°C, metallization was completed within the duration of the experiments, as only very small amounts of iron and chromium remained in the unreacted zones. Therefore, reduction of Kemi chromite with a CH4-H2 mixture can be regarded as highly efficient compared to reduction with only solid carbon as the reductant. Similar levels of almost complete reduction of chromite spinels by ordinary carbothermic reduction require temperatures over 1500°C. This can be attributed to the high thermodynamic activity of carbon when it is provided by cracking of methane into carbon and hydrogen.
Acknowledgements
The authors are grateful to Tekes and Finland Academy for providing the part-time Finland Distinguished Professor position to R.H. Eric and funds for this research project. The CMEco project and the Technology Industries of Finland Centennial Foundation are acknowledged for their collaboration and support.
References
Anacleto, N. and Ostrovski, O. 2004. Solid-state reduction of chromium oxide by methane-containing gas. Metallurgical and Materials Transactions B, vol. 35, no. 4. pp. 609-615. [ Links ]
Arvanitidis, I., Artin, C., Claeson, P., Jacobsson, H., Johansson, P., Rassmus, J., and Swartling, D. 1996. Study of the kinetics of reduction of iron chromate by hydrogen. Scandinavian Journal of Metallurgy, vol. 25, no. 4. pp. 141-147. [ Links ]
Basson, J. and Daavittila, J. 2013. High carbon ferrochrome technology. Handbook of Ferroalloys. Gasik, M.I. (ed.). Elsevier. Chapter 9. pp. 317-363. [ Links ]
De Campos, M. and Eric, R.H. 2006. Reduction behaviour of chromite in the presence of a hydrocarbon gas. Proceedings of the Sohn International Symposium. Advanced Processing of Metals and Materials. Vol. 1. Wiley. [ Links ]
Davies, R.H., Dinsdale, A.T., Gisby, J.A., Robinson, J.A.J., and Martin, S.M. 2002. MTDATA - Thermodynamic and phase equilibrium software from the National Physical Laboratory. Calphad, vol. 26, no. 2. pp. 229-271. [ Links ]
Hem, S.R., Louw, J.D. de V., Gateshki, M., Göske, J., Rindbek Larsen, O., and Strangeways, J. 2009. Sample preparation for quantitative Rietveld analysis, phase identification and XRF in one step: automated sample preparation by Centaurus. Proceedings of the 7th International Heavy Minerals Conference. Southern African Institute of Mining and Metallurgy, Johannesburg. pp. 49-56. [ Links ]
Huovinen, I. 2007. Kemin kromiitin Cr/Fe-suhde kromiitin raekoon funktiona Pohjois-Viian, Elijärven ja Elijärven E-malmioissa. Pro gradu, Department of Geosciences, University of Oulu. 104 pp. [ Links ]
Kekkonen, M., Xiao, Y., and Holappa, L. 1995. Kinetic study on solid state reduction of chromite pellets. Proceedings of the 7th International Ferroalloys Congress (INFACON 7), Trondheim, Norway. Tveit, H., Tuset, J.K., and Page, I.G. (eds). Norwegian Ferroalloy Producers Research organization (FFF). pp. 351-360. [ Links ]
Lyakishev, N.P. and Gasik, M.I. 1998. Metallurgy of Chromium. 1st edn. Allerton Press, New York. [ Links ]
Murthy, Y.R., Tripathy, S.K., and Kumar, C.R. 2011. Chrome ore beneficiation challenges & opportunities - A review. Minerals Engineering, vol. 24, no. 5. pp. 375-380. [ Links ]
National Physical Laboratory, 2015. MTDATA - Databases. http://www.npl.co.uk/science-technology/mathematics-modelling-and-simulation/mtdata/databases/ [accessed 13 August 2015]. [ Links ]
Niayesh, M.J. and Dippenaar, R.J. 1992. The solid-state reduction of chromite. Proceedings of INFACON 6, Cape Town. South African Institute of Mining and Metallurgy, Johannesburg. pp. 57-63. [ Links ]
Perry, K.P.D., Finn, C.W.P., and King, R.P. 1988. An ionic diffusion mechanism of chromite reduction. Metallurgical Transactions B, vol. 19, no. 4. pp. 677-684. [ Links ]
Soykan, O., Eric, R.H., and King, R.P. 1991. The reduction mechanism of a natural chromite at 1416°C. Metallurgical Transactions B, vol. 22B. pp. 53-63. [ Links ]
Taskinen, P., Fabritius, T., and Eric, R.H. 2014. A new FiDiPro project: Sustainable production of ferroalloys. Materia, vol. I, no. 5. pp. 46-50. [ Links ]

