


Services on Demand
Article
 English (pdf)
 Article in xml format
 Article references
Indicators

Related links
-
 Cited by Google
 -
 Similars in Google
Share

 Permalink
Journal of the Southern African Institute of Mining and Metallurgy
On-line version ISSN 2411-9717
Print version ISSN 2225-6253
J. S. Afr. Inst. Min. Metall. vol.118 n.5 Johannesburg May. 2018
http://dx.doi.org/10.17159/2411-9717/2018/v118n5a9
PAPERS OF GENERAL INTEREST
A new approach for predicting bench blasting-induced ground vibrations: A case study
X. Hu; S. Qu
University of Science and Technology Beijing, China
SYNOPSIS
The paper describes efforts to find an effective and reasonable method for predicting ground vibrations induced by bench blasting. In order to reflect the effect of actual topography and geological conditions, two concepts - the equivalent path and equivalent distance - are introduced to take into account the effects of topographic features and properties of the rock and rock mass. An equivalent-path-based equation, the EPB equation, is thus proposed, which takes into account the impacts of maximum charge quantity and explosion heat of the explosive, acoustic impedance of the rock, integrity coefficient of the rock mass, as well as the equivalent distance. A total of 48 field seismic monitoring tests were carried out and the constants of the EPB equation were determined. Comparison of the predicted peak particle velocity values with those measured shows that the average error of the prediction is much lower, demonstrating the applicability of the EPB equation in the prediction of bench blasting-induced ground vibrations.
Keywords: bench blasting, ground vibration, peak particle velocity, prediction, equivalent path, equivalent distance.
Introduction
Drill-and-blast is the most common method in rock excavation engineering. Usually, these blasting operations are performed at sites close to inhabited places or factory premises(Xia et al., 2014), where ground vibrations induced by blasting may have an adverse effect on nearby buildings or facilities that need to be protected, such as slopes of open pit mines. For this reason, it is essential to make an acceptably accurate prediction of the vibrations, and therefore, define a safe charge of explosives during blasting (Kuzu, 2008; Nateghi, 2011). The prediction of ground vibrations induced by blasting is always a topic of general interest and numerous investigations have been carried out. Some commonly used and representative formulae are:
Sadaovsk's formula (Li, Ling, and Zhang, 2009):

USBM (Duvall and Fogelson) formula (Ambraseys and Hendron, 1968):

Langefors-Kihlstrom formula (Langefors and Kihlstrom., 1963):

Indian Standard formula ( Bureau of Indian Standards, 1973):

where PPV stands for the peak particle velocity at the measuring point, Q is the maximum explosive charge per delay period, K and a are the site constants which are related to the blasting condition and the rock features, and R is the distance between the explosion source and the measuring point. As mentioned above, there is a general form:

where β is another constant. The equations express the correlation between the vibration intensity, explosive quantity, and the distance. However, because of factors relating to the explosion source, the terrain, and geological conditions, the results from the above formulae may deviate substantially from the measured values, and fall outside the permissible error range (Nateghi, 2011; Khandelwal and Singh, 2007).
Many studies have been conducted in order to find an effective method for the prediction of blasting vibration. For example, Bouckovalas and Papadimitriou (2005 explored the effects of slope geometry, predominant excitation frequency and duration, as well as the dynamic soil properties on seismic ground motion. They found that topography may lead to intense amplification or suppression at neighbouring points behind a slope crest, and a general trend of amplification near the crest and suppression near the toe of the slope seems to hold for the horizontal motion. Nguyen and Gatmiri, (2007 conducted a numerical study on the 2D scattering of seismic waves by local topography using the direct boundary element method, and found that local topographic irregularities play an important role in the modification of seismic ground motion at the irregular features themselves and in the neighbourhood. Kuzu, 2008 showed the effect of geological factors in predicting the level of blast-induced ground vibrations. Fiore (2010) focused on the evaluation of seismic site effects and their relation to the local topographical slope and proposed an empirical method to estimate the seismic amplification in the regular slope far from the crest and valley zones. Nateghi (2011) described ground motions induced by blasting near underground and surface concrete structures during the construction of upper Gotvand Dam, analysed the effects of different rock formations, different detonators and explosives, and evaluated the relationship and the predicted influence on neighbouring concrete structures according to the USBM method. Trip, Kontoe, and Wong (2013) analysed the effects of slope topography on ground motion in deep soil layers and found that the topographic amplification and soil layer amplification effects interact, suggesting that in order to accurately predict topographic effects, the two factors should be considered together. Some scholars have revised the formulae on the basis of Sadaovsk's formula (e.g. Song and Xiao,2010). With the development of computing science, an artificial neural network (ANN) method has also been increasingly used in PPV prediction in recent years (Amnieh, Mozdianfard and Siamaki, 2010; Amnieh, Siamaki, and Soltani, 2012,).
In the present research we aimed to find a new method for prediction of PPV for ground vibrations induced by bench blasting. In order to achieve this aim, firstly, the influencing factors of bench blasting vibration from two aspects, including the explosion source factors and the propagation path factors, were analysed. Then, a new formula for predicting bench blasting induced ground vibrations was established based on the analysis. Finally, the accuracy and rationality of this method were analysed and validated by statistical analysis and a comparative approach.
Analysis and discussion of influencing factors
Factors associated with the explosion source
It is globally recognized that the PPV increases with the maximum explosive charge quantity Q fired per delay in multi-hole millisecond delay bench blasting. In the governments regulations (People's Republic of China, 2014) and in the empirical equations mentioned (Li, Ling, and Zhang, 2009; Ambraseys and Hendron, 1968; Langefors and Kihlstrom, 1963; Bureau of Indian Standards, 1973), the Q value has been taken as a key parameter in estimating blasting-induced ground vibrations. Ground vibration arises from the energy released by the detonation of explosives. The strength of commercial explosives differs greatly from type to type. Therefore, it seems reasonable, and indeed necessary, to take the energy release properties of the explosives into account. In other words, it may be useful to take the explosive charge quantity Q and energy release of the explosive simultaneously into consideration in order to ensure reliability of blasting vibration predictions.
An explosive is a chemical compound or mixture of compounds that undergoes a very rapid reaction when initiated, and little heat is lost by transmission and radiation before it generates seismic waves propagating outward. As a result, the detonation of an explosive charge can be considered as a constant volume process, and the explosion heat Qvof an explosive at constant volume can be used to describe the influence of explosive energy capacity, so the relation between PPV and the total energy of explosive per delay can be expressed as:

The propagation path of a seismic wave from blasting
Influence of topography on the propagation path
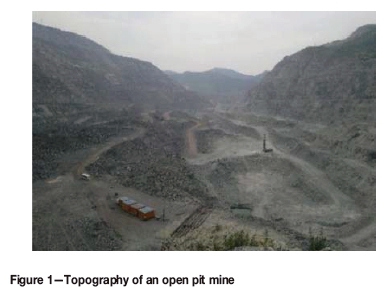
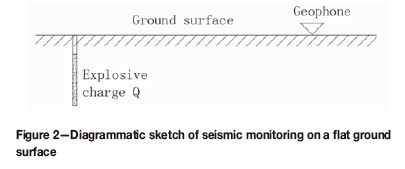
As shown in Figure 1, the topography in open pit mines usually consists of benches, slope, and pits, with limited flat ground surface. In the application of the above-mentioned empirical equations to a flat ground surface (Figure 2), the distance R is simply considered to be the length of the straight line from the explosive charge to the monitoring geophone at the measuring point.
However, as Figure 3 shows, when monitoring geophones are positioned on a slope over the pit or even at a point outside of the mine, the topography can be much more complex and it is likely that there is no straight line along which the seismic wave propagates to reach the geophone. Unfortunately, this situation often occurs, so an effective and usable definition of the distance from the blast to the measuring point is needed in this kind of topography.
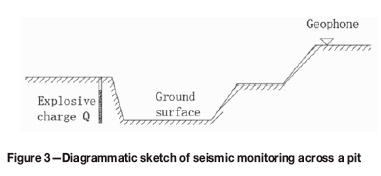
As is shown in Figure 3, the seismic wave generated by detonation of the explosive charge Q will propagate under the ground surface to the measurement point but never passes through the atmosphere above the surface. We assume here that the shortest path through which the seismic wave can travel beneath the ground surface be used as the distance from the explosion source to the measuring point. If this assumption is valid, this minimum distance will function equivalently to the parameter R of the above-mentioned empirical equations in flat ground surface circumstances, and can thus be termed the 'equivalent distance'. Consequently, the path corresponding to the equivalent distance can then be defined as 'equivalent path' in a conceptive sense.
(1) Equivalent path on a bench-like surface Benches are the main topographic features of open pit mines. For bench-like topography cases as shown in Figure 4, the equivalent path can be determined as follows.
1. Take the blast-hole centre P0 of the maximum explosive charge as the starting point and draw a half-line l0.
2. Take the straight line passing point P0 and normal to the page as the axis, rotate l0 under the ground surface towards the measuring point M, stop when l intersects the surface, mark the intersection point as P1 and the length from P0 to P1 as R0.
3. Then take the straight line passing through point P1 and normal to the page as the axis, rotate l1 (a half-line starting at point P1) under the ground surface towards the measuring point M. Stop when it intersects the surface, and mark the intersection point as P2 and the length from P1 to P2 as R1.
4. Repeat the above procedures until li(a half-line starting at point Pi) reaches the measuring point M.
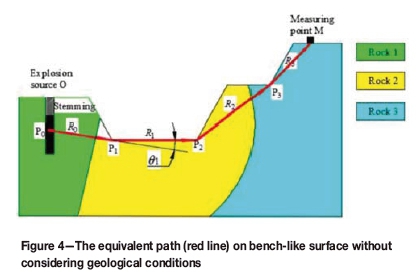
The series of straight-line segments P0P1, P1P2, P2P3,... is the so-termed 'equivalent path' and the equivalent distance can thus be defined as the sum of the straight-line segments from point P to point Pi+1, i.e.
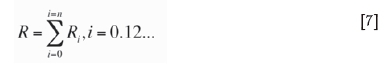
However, in accordance with the Huygens-Fresnel principle, the amplitude of seismic waves will decrease with the intersection angle ft, the angle of the wave propagation direction to the ground surface, as shown in Figure 4. The Kirchhoff obliquity factor can be expressed as (Gwenaël, Judicaël, and Guillaume, 2011):
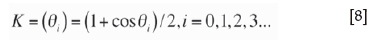
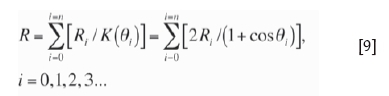
To take the influence of Kirchhoff's obliquity factor into consideration, Equation [7] can be rewritten as
(2) Equivalent path on recessed surface Besides bench-like surfaces, recesses and bumps are two other major features of the topography in open pit mines. Experiences show that bumps have little influence on the equivalent path, while recesses have much.
Propagation of seismic waves within the recessed surface is a complicated process and it is not possible to express it mathematically at present. However, the equivalent path concept may provide an opportunity to give an answer to the problem, at least to a certain degree. Take the case shown in Figure 5 as an example. In this case the recess is from point P2 to point P3. The equivalent path on the recessed surface can be approximately determined by the following procedure.
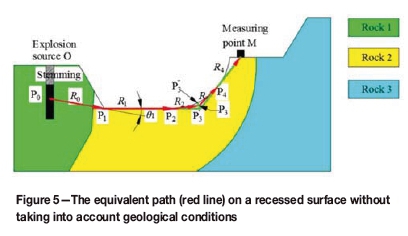
1. Draw a straight line l1 from point P1 passing point P2.
2. Draw a straight line l2 from point M and rotate it with point M as axis until it becomes tangent to point P4.
3. Suppose the two straight lines intersect at point P3. Mark the nearest point from point P3 to the ground surface as P'3, and mark the midpoint of the line segment P3P3 as
4. Then the equivalent path between point P2 and point P4 can be defined as two parts: R2 from P2 to P3 and R3 from P3 to P4.
Influence of the rock property factor on the propagation path
In addition to the influence of topography on the propagation path, the site-specific characteristics should also be incorporated into the model for predicting blasting-induced vibration. As Kuzu (2008) noted, the site-specific ground characteristics must be taken into account, particularly if the ground conditions are variable, like in this case. Because of the complexity of the relationship between geological conditions and rock characteristics and the process of wave transmission, identifying one or more parameters that can comprehensively describe the characteristics of the rock mass appears particularly important. Fortunately, the elastic wave impedance and the integrity coefficient of rock can describe the physical and mechanical properties of the rock mass, such as the joint frequency and fracturing (Wang, 2010).
The relationship between the stress and the particle vibration velocity v can be written as:

where ρ and cm are respectively the density and longitudinal wave propagation velocity of the rock. So if the stress value is constant, there is a positive correlation between the PPV and the value of wave impedance of rock pcm.
The rock mass in reality often contains geological discontinuities such as fissures, fractures, and faults. Research and experience indicate the important role of geological discontinuities in the decay of seismic waves [2, 3]. As it is hard to define the impedance of the rock mass in an ideally theoretical manner, it seems reasonable to define the impedance z of the rock mass as the following:

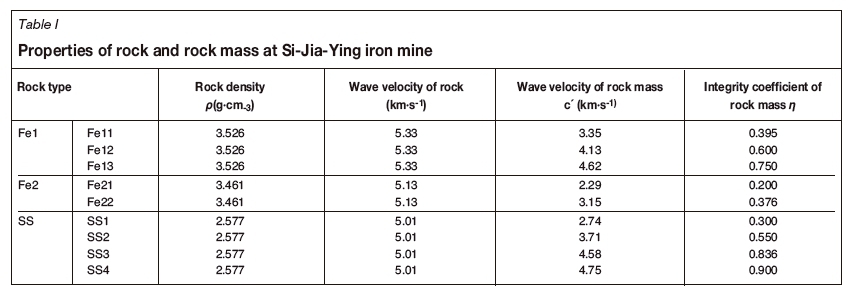
where ρ is the rock density in g∙cm-3, cm is longitudinal wave propagation velocity in m∙s-1, and η is the integrity factor of the rock mass, η= (cm / cr)2, where cr is the longitudinal wave propagation velocity of the rock in m∙s-1.
Therefore, the impedance z of the rock mass and PPV are negatively correlated, which can be expressed temporarily as

Construction of prediction model
Based on the above analysis, a formula relating PPV to the equivalent distances and the rock properties can be constructed as:
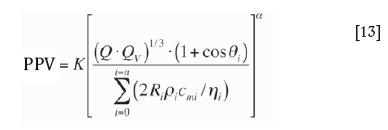
(hereafter termed the EPB equation).
where i = 0,1,2,3...
PPV is peak particle velocity) cm∙s-1]
Q is the maximum explosive charge fired per delay (kg)
Qv is the explosion heat of explosive at constant volume (kJ∙kg-1)
Pi is the demarcation point of rock properties and the inflection point of propagation direction on the equivalent path
Ri is the equivalent distance from point Pi to point Pi+1 (m)
θi is the intersection angle of the wave propagation direction to the ground surface at the Pi(degrees) (obviously, Qiequals zero when point Piis at the point P0 or the demarcation point of rock properties)
pi is the density of rock on the equivalent path, whose equivalent distance is Ri(g∙cm-3)
ղi is the integrity coefficient of the rock mass on the equivalent path, whose equivalent distance is Ri, and ղi = (cm / cr)2, in which cm and Cr are the wave velocity of the rock mass and rock respectively (m-s-1)Kand a are constants.
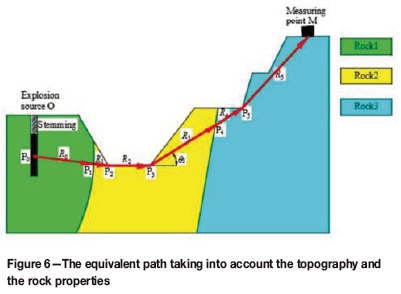
As shown in Figure 6, P1 and P4 are the demarcation points of rock properties, and P2, P3, and P5 are the inflection point of the propagation direction. θ3 is the intersection angle at point P3.
Verification of prediction model
Field seismic monitoring tests
Seismic monitoring tests were conducted in Si-Jia-Ying iron mine, a large-scale open pit mine where multi-hole millisecond-delay bench blasting is applied. The layout of the blast-holes is triangular and the initiation method is hole-by-hole. The burden is 5 m, the distance between holes is 7 m, and the distance between rows is 6 m. The values and numbers of the parameters involved in the EPB equation were measured and collected systematically for each of the tests, for determining the values of the constants K and a and also for examining the accuracy and reliability of the EPB equation in prediction of blasting-induced PPV.
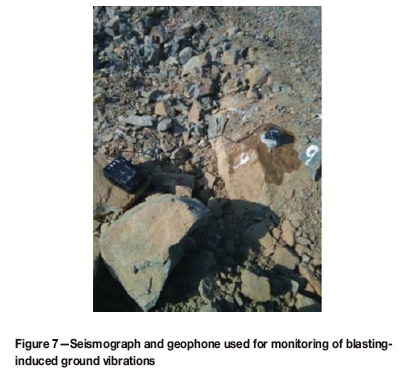
Equipment and procedure
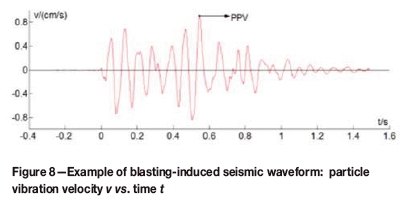
Ten blasting seismographs (model NUBOX-6016, Figure 7) were used in this programme. Each seismograph uses an integrated triaxial geophone to convert ground movement/velocity into a voltage, which is simultaneously recorded by the seismograph in the manner of waveforms as shown in Figure 8. The seismic analysis software of the instrument provides features for graphical output of the waveforms in each of the three axes. PPV and dominant frequency/are measured automatically by the software from the waveform that results from the vector composite of the three mutually perpendicular components.
Geophones are fixed to a hard surface with plaster, or linked with sharp steel pins 20 cm in length to other types of ground surface, for coupling of the instrument to the ground and assuring a fair recording quality.
As shown in Figure 9, the geophones were fixed in a line at different distances from the blast, with the line oriented toward the mass centre of explosive charge Q of the blast.
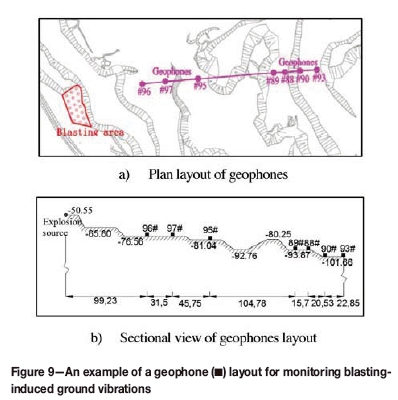
The coordinates of the geophones and the charge for each blast were measured and documented for use in the analysis.
Parameters and results of tests
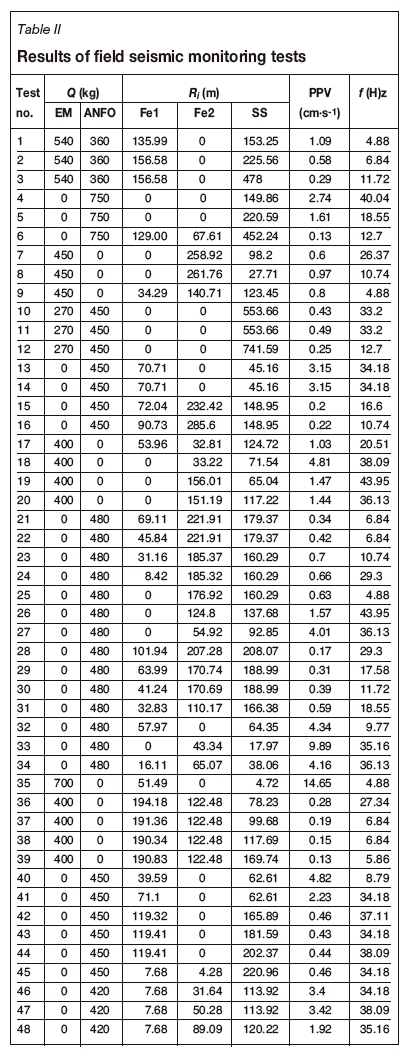
A total of 48 seismic monitoring tests were conducted. In each of the tests, condition parameters such as explosion heat at constant volume, the properties of the rock and rock mass, as well as rock type distribution in the mine were recordedollected. Waveforms in each of the three mutually perpendicular geophones and the resultant velocity-time curve for each seismograph were recorded. PPV correlation analyses were then carried out to determine the constants K and α of the EPB equation and for error analysis.
Condition parameters
Two types of explosive products, an ANFO and an emulsion, are available for blasting at the Si-Jia-Ying open pit mine. The explosion heat Qv at constant volume is 3840 kJ∙kg-1 for ANFO and 3200 kJ∙kg-1 for emulsion (EM). Properties of the rock and rock mass are shown in Table I.
Result o/the tests
The results of the 48 tests are shown in Table II.
Analysis and discussion
The values of the constants K and α of the EPB equation were determined by correlating the measured PPV with the equivalent distance of the 48 seismic monitoring tests. The least-squares method was applied in this procedure and the
relevance coefficient Rc and root mean square error RMSE of the correlation were obtained. Taking the logarithm of the EPB equation yields:
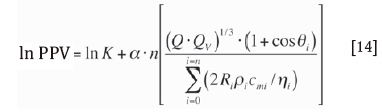
where i = 0,1,2,3L L
Then let y = ln PPV,
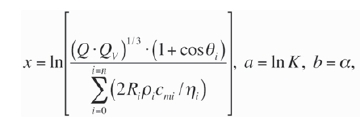
Equation [13] can thus be written as

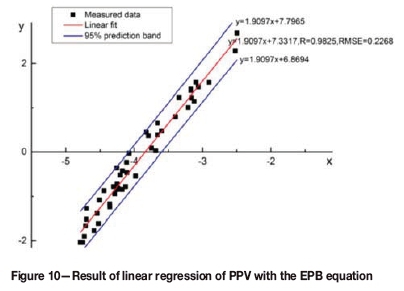
As shown in Figure 10, by correlating the EPB equation with the data listed in Table I and Table II at a confidence level of 95% the constants K and α are found to be 1528 and 1.91 respectively. Therefore, the EPB equation can then be written as the following:
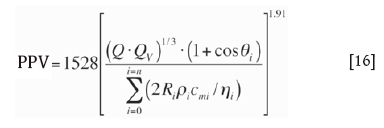
Figure 10 also shows that the correlation coefficient Rc equals 0.9825 and equals 0.2268 at a confidence level of 95%, indicating that the PPV of bench-blasting ground vibrations is highly correlated with the equivalent distance, the maximum explosive charge per delay, and explosion heat of the explosive, as well as the wave impedance of rock and integrity coefficient of the rock mass over the entire equivalent distance.
The relative errors are obtained by comparing the predictive PPV values with the measured values in field seismic monitoring tests. The results of the relative errors, ε, are presented in Table IV.
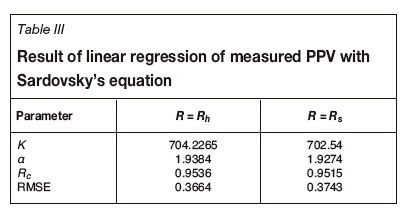
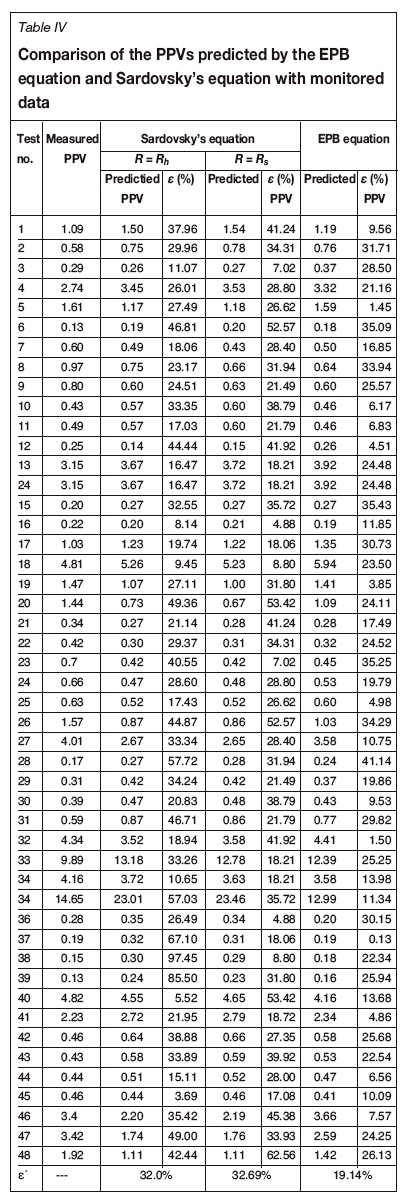
The same operation was conducted with Sadaovsky's equation method. In the process of analysis, the distance parameter in Sadaovsky's equation (PPV = K(Q1/3R-1) is substituted with the horizontal distance Rh and spatial distance Rsfrom the blast to measuring point respectively. The fitting results are shown in Figures 11 and 12. The correlation coefficient of the regressions is shown in Table III. Furthermore, errors from Sadaovsky's equation are also calculated and compared for an evaluation purpose. The results of the relative errors, ε, are shown in Table IV.
From Figures 10-12, it is not difficult to find that although the correlation coefficients with Sardovsky's equation are also fairly high (0.9536 and 0.9515), they increase to 0.3364 and 0.3743 respectively, compared to 0.2268 for the EPB equation. Furthermore, the distribution of the measured data points in Figure 10 becomes more concentrated compared with Figures 11 and 12, which indicates the effectiveness of the EPB equation.
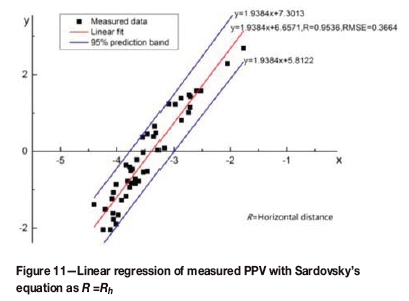
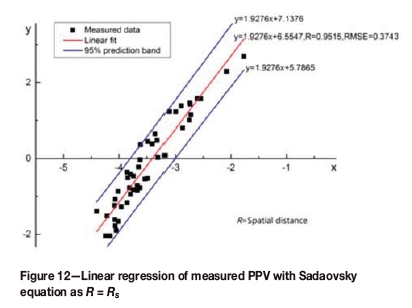
It can also be observed in Table IV that ε', the mean value of the relative error ε of the PPV predicted by the EPB equation to the measured PPV, is 19.14% , while ε' comes to 32.00% and 32.69% with R=Rh and R=Rs respectively using Sardovsky's equation.
Summary and conclusions
Under the condition of the consistency of site factors, including site topographic and geological conditions, the effectiveness of early empirical prediction equations such as Sadaovsky's equation is obvious. However, these equations are unsuitable for irregular topography such as benches and complicated geological conditions. A new method for predicting blasting-induced vibration, using the EPB equation, is suggested, which takes into account the irregular topography and complicated geological conditions.
In many cases of field bench blasting, the topography between a blast and points of concern is highly irregular, and hence the seismic waves do not propagate along a single straight line to the measuring points. In this paper, it is assumed that the equivalent path and equivalent distance can be used to characterize the distance dimension based on the minimum distance principle. Meanwhile, the wave impedance of rock and integrity factor of the rock mass are used to model the effect of rock properties and discontinuity characteristics of the rock mass on the path of wave propagation.
In this paper, it is considered that PPV is positively related to the energy released from detonation of the maximum explosive charge quantity fired per delay period in a blast. Different explosives release different energies when detonated, so here we use the product of the detonation heat (Qv) and the maximum explosive charge quantity (Q) to represent the energy released by detonation.
As a result of linear correlation analysis on PPV data obtained in 48 field bench-blasting measurements, the constants K and a of the EPB equation are determined to be 1528 and 1.91 respectively. By comparing the predicted values with the measured data from field seismic monitoring tests, the error of the prediction with the EPB equation is found to be about 19.14%, much lower than that of Sadaovsky's equation (32.00% and 32.69%), indicating that the EPB equation is capable of describing the relationship of peak particle velocity with equivalent distance with high reliability, and is fairly reliable for use in predicting bench blasting-induced ground vibrations.
In conclusion, the EPB equation can easily be used in open pit mines where the factors in the equation such as the equivalent path and distance, rock density and wave velocity, and integrity coefficient of the rock mass can be easily measured. However, further study is needed to confirm the usefulness and reliability of the EPB equation in underground environments.
Acknowledgement
This study was supported by the National Natural Science Foundation of China (Grant No. 51274020).
References
Ambraseys, N.R. and Hendron, A.J. 1968. Dynamic behaviour of rock masses. Proceedings of Rock Mechanics in Engineering Practices. Wiley, London. pp.203-207. [ Links ]
Amnieh, H.B., Mozdianfard, M.R., and Siamaki, A. 2010. Predicting of blasting vibrations in Sarcheshmeh copper mine by neural network. Safety Science, vol. 48. pp. 319-325. [ Links ]
Amnieh, H.B., Siamaki, A., and Soltani, S. 2012. Design of blasting pattern in proportion to the peak particle velocity (PPV): Artificial neural networks approach. Safety Science, vol. 50. pp. 1913-1916. [ Links ]
Bouckovalas, G.D. and Papadimitriou, A.G. 2005. Numerical evaluation of slope topography effects on seismic ground motion. Soil Dynamics and Earthquake Engineering, vol. 25. pp. 547-558. [ Links ]
Bureau of Indian Standards. 1973. Criteria for safety and design of structures subjected to underground blast. ISIBulletin, IS-6922. [ Links ]
Fiore, D.V. 2010. Seismic site amplification induced by topographic irregularity: Results of a numerical analysis on 2D synthetic models. Engineering Geology, vol. 114. pp.109-115. doi:http://dx.doi.org/10.1016/j.enggeo.2010.05.006 [ Links ]
Gwenaël, G., Judicaël, P., and Guillaume, D. 2011. Time-domain impedance equationtion for transmission line matrix modelling of out door sound propagation. Journal of Sound and Vibration, vol. 330. pp. 6467-6481 [ Links ]
Khandelwal, M. and Singh, T.N. 2007. Evaluation of blast-induced ground vibration predictors. Soil Dynamics and Earthquake Engineering, vol. 27. pp. 116-125. [ Links ]
Kuzu, C. 2008. The importance of site-specific characters in prediction models for blast-induced ground vibrations. Soil Dynamics and Earthquake Engineering, vol. 28. pp. 405-414. [ Links ]
Langefors, U and Kihlstrom, B. 1963.The Modern Techniques of Rock Blasting. Wiley, New York. [ Links ]
Li, X.B., Ling, T.H., and Zhang, Y.P. 2009. Analysis of Blast Vibration Signals-Theories and Methods. Science Press, Beijing. pp. 161. [ Links ]
Nateghi, R. 2011. Prediction of ground vibration level induced by blasting at different rock units. International Journal of Rock Mechanics and Mining Sciences, vol. 48. pp. 899-908. [ Links ]
Nguyen, K.V. and Gatmiri, B. 2007. Evaluation of seismic ground motion induced by topographic irregularity. Soil Dynamics and Earthquake Engineering, vol. 27. pp. 183-188. [ Links ]
People's Republic of China. 2014.National Standards Compilation group of safety regulations for blasting (GB6722-2014). Standards Press of China, Beijing. [ Links ]
Song, G.M. and Xiao, Q.H. 2000. Research on the methods of measurement and evaluation of blasting vibration in open-pit mines. Nonferrous Metal (Mining), vol. 4. pp. 24-27. [ Links ]
Tripe, R., Kontoe, S., and Wong, T.K.C. 2013. Slope topography effects on ground motion in the presence of deep soil layers. Soil Dynamics and Earthquake Engineering, vol. 50. pp. 72-84. [ Links ]
Wang, X.G. 2010. Handbook of Blasting. Metallurgical Industry Press, Beijing. pp. 225. [ Links ]
Xia, X., Li, H.B., Niu, J., Li, J., and Liu, Y. 2014. Experimental study on amplitude change of blast vibrations through steps and ditches. International Journal of Rock Mechanics and Mining Sciences, vol.71. pp. 77-82. [ Links ]
Paper received Mar. 2017
revised paper received Jun. 2017

