


Services on Demand
Article
 English (pdf)
 Article in xml format
 Article references
Indicators

Related links
-
 Cited by Google
 -
 Similars in Google
Share

 Permalink
Journal of the Southern African Institute of Mining and Metallurgy
On-line version ISSN 2411-9717
Print version ISSN 2225-6253
J. S. Afr. Inst. Min. Metall. vol.118 n.5 Johannesburg May. 2018
http://dx.doi.org/10.17159/2411-9717/2018/v118n5a1
STUDENT PAPERS
Optimization of the load-and-haul operation at an opencast colliery
O. Pasch; S. Uludag
School of Mining Engineering, University of Pretoria, South Africa
SYNOPSIS
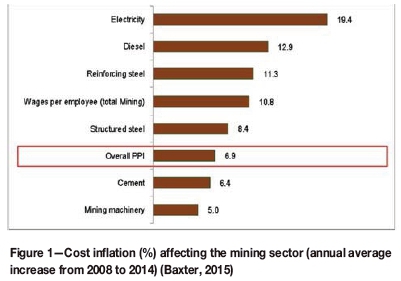
The current coal mining climate is characterized by coal price volatility, political instability, high labour costs, and increasing operational costs. This is exacerbated by a steady decline in the growth of global coal demand due to the increased use of alternative and renewable fuels in the energy industry. Locally, the overall mining cost inflation indices shows a yearly increase of 2% over the national consumer inflation. In order for coal mines to survive and mine profitably, they need to capitalize on the opportunity to improve their productivity and focus on one factor they can control: operational efficiency. Increasing productivity is one of the key drivers to counter diminishing profit margins. Increasing production effectively reduces operating costs. However, the emphasis should not only be on increasing output with the same input, but increasing the output while decreasing the input, and ultimately adding optimum value to current resources. Research shows that an increase in production will ultimately decrease the operation's unit cost, especially fixed costs.
In this study a load-and-haul fleet optimization approach has been used to identify the opportunities for operational improvement at an opencast colliery. The study combines the results of a literature review, on-site time studies, and statistical data analysis in order to determine the best loader-truck fleet combinations for increased production. Several relevant key performance indicators (KPIs) for the evaluation and identification of productivity improvement opportunities were defined during this study. These KPIs are bucket fill factor, loading conditions, loading cycle time, utilization, and deviations from schedule. The priority delays determined by on-site time studies compared to the time book for each delay showed that idle or waiting time by the loaders, face preparation and relocation, and process delays had significant deviations. However, the results showed that this operation is under-trucked, hence optimizing the loader-related inputs proved less effective than optimizing truck-related inputs. The results indicated that a homogeneous truck fleet consisting of five Caterpillar 789C trucks, combined with a Caterpillar 994K loader, is the most efficient fleet option and will produce 1455 t/h. The combined optimized effect of each identified KPI of production led to a tonnage improvement opportunity of 5421 t per shift.
Keywords: optimization, productivity, load-and-haul fleet, KPIs, under-trucked, tonnage improvement opportunity.
Mine background
The opencast coal mining complex extends over two mines within the Witbank Coalfield, to the south of Emalahleni, Mpumalanga Province. The target pit is currently a mature opencast strip-mining operation that extracts multi-layered coal seams, exercising a throw-over method to the low-wall side to the north and advancing in a southerly direction. The area was previously mined using a conventional underground bord-and-pillar method.
The mining complex produced a total of 30.4 Mt in the preceding financial year, about 8.5 Mt/ of which was produced at the opencast colliery. The mine was established in 2010 and consists of a mixture of greenfield and brownfield operations that supply energy coal to both local and export markets. Coal is supplied to Eskom's power station via a conveyor system, while a higher quality export grade is supplied to mainly European and Indian markets.
Project background
In recent years, the global effort towards utilization of alternative and renewable energy resources has driven the demand for energy from coal downward. In addition to this, various sources have highlighted that fact that coal is a finite resource; it is inevitable that coal resources are heading towards depletion. Meanwhile, supplying coal has become increasingly more challenging. This is because mining operations usually extract the reserves nearest to the surface or the most conveniently accessible reserves. Coal deposits that have been left in situ by previous operations may now be sterilized, or if the extraction opportunity exists, will require sizeable financial investments. Operational costs for South African mines are increasing at a rate that diminishes the margin to mine profitably. The developing South African economy has had difficulty maintaining a positive GDP growth rate, weakening the rand to US dollar exchange rate. Not only does this play a decisive role in the mining industry's export sector, but it also increases mining operational input costs significantly. Most operational expenses like consumables, electricity, equipment, fuel, and various overhead costs are heavily inflated by a weaker rand.
Production challenges
Pillar mining is one of the most challenging coal extraction methods in an opencast environment. Remnant coal pillars in old workings are also susceptible to spontaneous combustion. Not only does this degrade the quality of the coal, it also creates an extremely hazardous operating environment. As a result, overheating of equipment occurs frequently, which leads to regular production stoppages. The ambient environment caused by the smoke reduces operator visibility and generates uncomfortable operating conditions. The uneven and undulating country rock results in water accumulation on the pit floor. This contributes to productivity losses in a number of ways, including trapping of equipment by mud, pumping arrangements, unseen potholes damaging tyres, and material losses from loaded haul trucks. Another factor that affects productivity is operator proficiency. Operators may be tempted to ignore reporting and logging responsibilities as a result of working in a strenuous environment.
The exposure of country rock underneath the coal seams also adds to the challenges. This results in poor road conditions that affect hauling by increasing travel time, causing excessive wear on haul truck tyres, and increasing safety risks, to mention only a few. Hauling coal from a pit some 60 m below surface means that loaded trucks must travel upwards at steep inclines. This reduces the speed trucks can travel at and adds considerable time to the hauling cycle. As extraction advances with each strip, the hauling distances to the tipping points increase, in turn increasing the truck cycle time.
Objectives and methodology
The following objectives were formulated.
► Determine and quantify the main factors that affect the productivity of the load-and-haul fleet at the mine by means of value drivers.
► Identify, compare, and analyse the major delays that have created shortcomings in the current extraction process to arrive at the potential capacity of the mine's extraction process.
► Identify the tonnage improvement opportunity associated with each KPI.
► Recommend practical improvements that target priority KPIs in order to increase productivity at the target pit.
► Develope an optimized fleet solution for the current coal extraction operation through the basic mining equations.
► Conduct a basic cost evaluation for each improved KPI based on benchmarking and industry standards.
A literature review was conducted to gain understanding of the background of the project as well as to limit the context to the milieu of the investigation. In addition, the literature was used to gain knowledge of industry standards in order to benchmark costs where applicable. Various literature sources were continuously reviewed to add knowledge and understanding to the problem statement throughout the investigation. Preliminary research related to the theme of the study includes conventional data-gathering techniques like interviews with employees of the mine and group-based discussions. These insights added qualitative value and support to a mainly quantitative investigation. Documents, records, and statistical data were also retrieved from the mine's online Integrated Management System and utilized. Information relevant to the project scope was made available to the investigator with permission from the General Manager of the operation. The third method of investigation was based on a time study where the investigator recorded overall loading and hauling cycle times over 15 twelve-hour shifts. Simultaneously, side-by-side on-site observations were recorded. This allowed the investigator to record multiple 'day-in-the-life-of observations whereby half-hourly events could be logged. These methods can be categorized as visual observations done over a period of 180 hours. Quantitative data obtained was used to calculate a benchmarked improvement tonnage opportunity target.
The Time Usage Model, proposed under the ownership of the mine was applied during the course of the study, which drives a consistent approach to measure productivity. This model provides a standard methodology to calculate time-related parameters for equipment at the mine. Time-related parameters are one of the most fundamental aspects in measuring the relative performance of mines, hence this model contributes to the continuous iteration in order to achieve optimum productivity.
Scope of study
The investigated extraction processes are limited to the targeted pit's loading and hauling fleet. Only KPIs and value drivers from extraction processes will be considered in creating a benchmark for the mine. A generic methodology on how to adapt the in-pit extraction processes is only applicable to similar operations. i.e. opencast collieries. Due to the confidential nature of mining financials, relative measures for operational costs of the mine are used unless stated otherwise.
Literature review
Production
The following key excerpts were taken from various sources relevant to the company's coal market.
► South Africa supplied 66 Mt for the global coal supply in 2016 (Anon., 2016)
► South African collieries produced 176.9 Mt in 2007 to supply the local market (Anon., 2016)
► The company produced 14.85 Mt in FY16 for export, of which an estimated 8.25 Mt were produced at the targeted mine (Anon., (2015). A decrease to 12.8 Mt in FY18 is expected by the company (Anon., 2016)
► The targeted mine supplied Eskom with 8 Mt in FY15. The company plans to decrease the mine's contribution to 6.75 Mt in FY 17 (Anon., 2015).
A common focus for a mining operation is to improve productivity to reduce cost pressures. However, two increasingly important and inevitable factors remain critical, which mining companies must continuously analyse and evaluate in order to maintain profitability - the depletion of coal resources and the shift towards alternative energy (renewable energy sources).
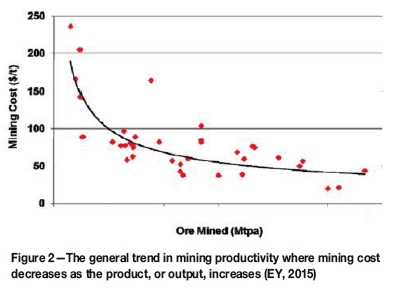
Productivity in mining terms can be generally defined as the same output for less input. Baxter (2015) argues that productivity gain should be measured as a form of optimization. In other words, the drive to productivity should focus on increasing the ratio of output to input. This is evident from Figure 2, which highlights the general motivation to increase the product or output but reduce the input or cost per unit.
Load-and-haul operation
The load-and-haul operation can be seen as a continuous cycle that is made up of different production steps or activities. The load-haul cycle time is the total time to complete a full cycle. The critical cycle steps, as time fractions of the total cycle, have been identified by Krause (2006):
► Spotting at loading is the time required for a truck, as soon as it arrives near the vicinity of the loader, to manoeuvre into a stopping position for loading.
► Loading time is the total time for the loader to load the bucket of the truck to its required payload.
► Hauling-full time is the total travelling time for a loaded truck to reach the dump site from the loading site.
► Travel empty time refers to the total travelling time to for an empty truck to reach the load site from the dump site.
► Queuing time is the total time an empty truck has to wait in line before it can manoeuvre into a position for loading.
Another factor that is commonly ignored is the waiting time of a loader. 'Waiting at dump', 'Queuing', and lastly 'Waiting time of loader' are the three noteworthy delays that are not directly caused by the performance of the equipment, but rather due to load-haul equipment combinations.
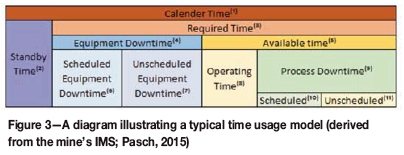
Time usage model
The company promotes the use of a standardized method by which productivity can be measured and calculated, in addition to the reporting and documenting of equipment usage. Figure 3 illustrates a typical time usage model. The time usage model illustrates time factors that are related to the total time that equipment is not performing its required, planned, and intended function. However, the total time under consideration when equipment is performing its required, planned, and intended function is referred to as Equipment Production Time or Direct Operating Hours (DOH). The DOH is defined by the time when measurable throughput in the process is established. This is generally considered to be the product of the available time for equipment to perform work and the actual utilization time to maintain a productive cycle. Various equipment performance metrics that will determine the productivity of an operation can be derived from the time factors. These relative measures are generally called key performance indicators (KPIs) (Choudhary, 2015).
Equipment match factor
In a load-and-haul operation, the capacities of the loaders should be compatible with the capacities of the truck fleet. Choudhary (2015) presents a simplified model to determine if a fleet is under-trucked or over-trucked. This is represented by the following formula:
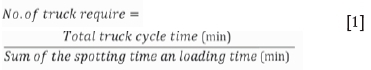
If the current fleet operates with a number of trucks exceeding the value determined by Equation [1], the fleet is said to be over-trucked, and if less than the value, under-trucked. Equation [1] does not consider the queuing times, thus it can only be applied as a comparison whereby two ideal fleets are considered.
The equipment match factor (MF) between two interdependent pieces of equipment takes into account the total cycle time of the equipment. According to Choudhary (2015) and Krause (2006), the equipment match factor refers to the ideal capacity and number of trucks that are paired in operation with a loader and how well they are suited to each other. The variables in Equation [2] are dependent on the equipment specifications as well as fixed performance capacities, i.e. payload, truck height, and loader reach to name a few.

The match factor, which provides a measure of the productivity of the fleet, can be calculated by Equation [2]. Although the MF ratio does not take into account the equipment capacities and specifications, it is inherently considered by applying the equipment cycle times in the equation. Choudhary (2015) notes that the MF ratio is not to be applied to the efficiency of the production itself, but only to the efficiency of the selected combined fleet. Choudhary (2015) goes on to state that an MF of 1.0 indicates that the fleet is 100% compatible regarding size and timing, but in this instance the combination can only produce 10% of the capacity of a fleet that has an MF of 0.5. The mining industry would rather opt for a lower MF limit, as this will correlate with a lower operating cost. Choudhary (2015) states that the MF is best applied in combination with other approaches, such as experiential and iterative methods, for determining the haulage fleet size.
Equipment specification
The mine has become accustomed to the exclusive use of CAT equipment for their load-and-haul operation. According to CAT Mining (2017), the 993K loader with a standard coal bucket is sized to load 90 t in three to four passes to the 777D, and load 136 t in six passes to the 785C. This amounts to an average of approximately 22.5 t per load. The 994K loader with a standard coal bucket is sized to load 136 t in four passes to the 785C and 177 t in five passes to the 789C. It is also capable of loading 227 t to the 793 in six passes. Hence, in theory, the 994K loader can average approximately 36 t per load. Bucket selection is a critical factor in any extraction process. According to CAT Mining (2017), in-seam coal is best mined with a rock-type bucket, and they recommend that serrated edge buckets be used as this provides the highest penetration rates.
Bucket fill factor (BFF) is used to determine how well the volume of a bucket is utilized. Bucket fill factor is very useful to determine the productivity of a combined fleet. Mathematically, it is expressed in Equation [3] (Mohammadi, Rai, and Gupta, 2015). Bucket fill factors are usually impractical to obtain from in-field measures but an estimation scale can be used to objectively rate each bucket load accordingly.
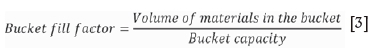
Productivity for coal haul trucks is not limited by the nominal payload perse, but rather by the volumetric design and dimensions of the bucket. Due to the low relative density of coal, which is amplified by the swell factor of broken coal during loading, there is no theoretical limitation to the output per ton and the truck payload.
Results and interpretation
The total fleet sizes seen in Table I and Table II indicate the available equipment for the duration of the study. The sample size includes the equipment from the fleet on which observations, measurements, and recordings were made and from which relevant data was collected. However, the most significant amount of data was measured and recorded from 994K loaders and 789K haul trucks.
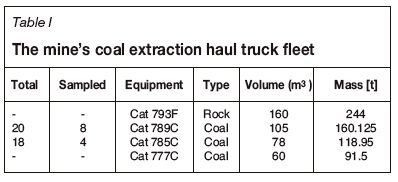
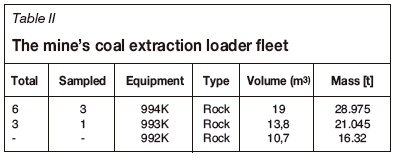
It can be argued from the total and sampled fleet sizes that the load-and-haul coal extraction operation is under-trucked. However, under-trucking or over-trucking varies with the time parameters in the truck cycle time. According to CAT (2017), each loader has been benchmarked to service at least three to five trucks. From Table I and Table II, looking at the sampled fleet size, it is seen that one 994K loads on average loads two trucks, which indicates that the operation is under-trucked.
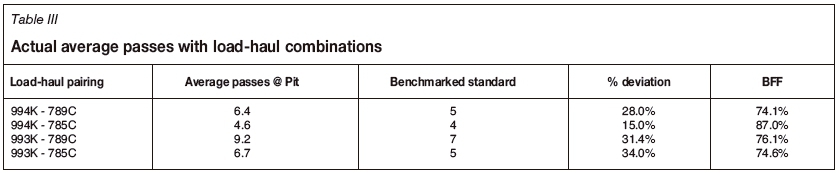
Bucket fill factor
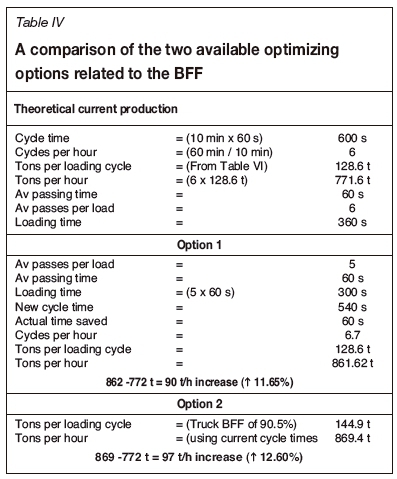
Table III shows that each loader-truck combination deviates significantly from the benchmarked passes or loader loads prescribed by CAT Mining (2017). The 994K-789C pairing deviates 26% from benchmarked practice, effectively resulting in a 74.1% BFF for the loader (see Figure 1).
Optimizing the loader BFF to a mine-ideal standard will inevitably decrease the passes per load. Increasing the BFF of the loader results in two improvements the overall productivity. The first is a decrease in passes, which will shorten the loading time while still maintaining the same mass per loading cycle. This results in a 90 t/h increase (see Table IV). However, if the cycle is under-trucked, reducing the loader cycle time will not necessarily add direct production value. This is because the loader has to wait for trucks in an under-trucked cycle. No additional tonnage can be hauled unless another truck is added to the cycle. Additional available time 'created' in this improvement can, however, be spent on face preparation for the next load. A second option may be considered whereby an additional load can be loaded, making six loads per loading cycle. This will increase the BFF of the trucks to 90.5% (144.9 t). This results in a total increase of 156 t/h (see Table IV). Applying this method will evidently increase the tonnage produced in an under-trucked cycle since more tons are added while operating at the same loading and truck cycle time.
The Australian Department of Resources, Energy and Tourism (2014) has indicated that with an increase in the average payload, the fuel cost per ton decreases as more tons are being hauled. The aforementioned source also states that the fuel usage does not increase significantly when the payload is increased from 80% to a 95% BFF (Australian Government, 2014). By comparing only fuel costs of the current BFF to the second tonnage improvement opportunity, the net opportunity profit per hour resulted in a R19.6 per ton decrease in unit cost.
Loading conditions
Loading conditions in-pit differ greatly from stockpile loading conditions. Loading times from the pit and from the stockpile will also differ from theoretical loading times, as well as benchmarked loading times and assumed conditions. In the case of this study, stockpile loading conditions are presumed to be either ideal or near-ideal for the following observed reasons.
► The stockpile floor grade is periodically maintained by graders, thus providing a flat and horizontal load floor that improves loading performance.
► The coal stockpiles are loosely packed against the angle of repose; hence minimum penetration force is used over the shortest possible time at an angle that is ideal for bucket designs to maximize bucket fill factors.
► Less spontaneous combustion on stockpiles, as the time the coal spends on the stockpiles is kept to a minimum. This allows for loader operators to plan and execute loading methods at a high accuracy and in the shortest possible time.
► If stockpiles are effectively managed, the loader can be ideally positioned for the loading method used, with sufficient space to move around.
The following conditions and practices were observed at in-pit loading operations.
► Uneven floor conditions as toes and irregularities in the footwall of the coal seam occur frequently, resulting in low bucket fill factors and consequently increasing loading time.
► Increased breakout force is required by the loaders to break coal from in situ conditions, thus increasing loading time.
► Limited space and changing coal face conditions in the pit led to frequent manoeuvring and positioning for loading trucks. This caused the loading method to change frequently, adding to time wasted.
► Spontaneous combustion caused extreme loading conditions, preventing the operator from loading efficiently. Operators have to continuously assess the ambient conditions and manoeuver into positions that enable the loader to remain at a safe distance from the burning coal but still access the coal face.
Cycle times
A mine ideal standard was developed to compare actual results against a targeted mine potential. The mine ideal was determined by benchmarking equipment specifications, supported by the upper quartile data distribution of recorded data obtained from the mine. This means that the mine ideal is now standardized and based on the best cycle activity time that had been reached in a quarter of the time over which the data were recorded. The cycle times were recorded (see Table V) for 161 truck cycles for the combination of 994K loader and 789C haul truck. The most significant contributor to the overall cycle time deviation is the loading activity, which contributed 37%. This is mainly due to mitigating the hazardous loading conditions i.e. water-spraying, floor grading, and face preparation. It was also determined that 27% of the total deviation is due to the queuing time. The results indicated that the current extraction technique or loading cycles could possibly be over-trucked, or the loader is not fully utilized for loading the trucks. This is in contrast with the results from the fleet sizes, which showed an under-trucked operation. The queuing times can be explained by a few localized events where either all trucks were dispatched to one loader when the other loaders were unavailable, or downstream process downtime due to crusher maintenance.

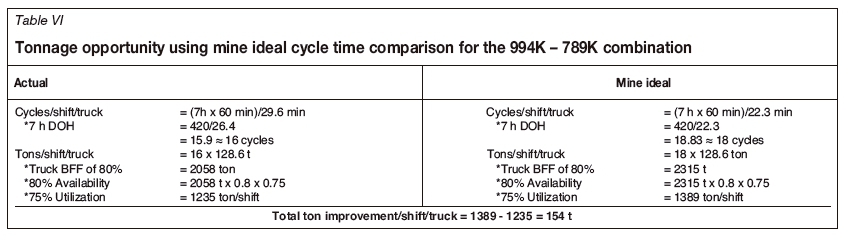
Table VI highlights the tonnage opportunity per shift or production improvement opportunity when only the cycle time is optimized to a mine ideal. It is important to keep in mind that the above summary is presented on the assumption that there is no queuing time, which is expected in an under-trucked operation, but frequently impractical. Yet, with the reduction in cycle time of four minutes and four seconds, the total improvement is 154 t per shift per truck for the 994K-789C combination.
In the case of improved cycle times, the payload per cycle will remain constant, in conjunction with all other factors, ceteris paribus, i.e. maintenance, tyres, and operator/labour costs. The fuel costs may increase due to the increase in the total haulage distance per shift, but this may be considered as negligible as the fuel cost associated with idling at queuing are assumed to be used for hauling. The total cost opportunity due to the increase in tonnage per shift amounted to a net decrease of R1.94 per ton.
Equipment match factor
According to Equation [1], the optimal number of 789C trucks paired with one 994K loader is five. Currently, the fleet is operating at an average MF of 0.59. This confirms that the operation is currently under-trucked. According to Equation [2], the mine ideal MF ratio should be 0.96. The MF ratio can now be used as an index of the overall fleet efficiency or as a relative efficiency measure. Including the waiting and queuing times recorded in the study will provide a more accurate insight into cases where mixed fleets are used, as is the case at this mine. Results show that the optimum fleet in terms of tons produced per hour consists of one 994K loader and five 789C haul trucks. This yielded a total of 1455 t/h. Alternatively, removing one 789C truck in this fleet will decrease the tonnage by approximately 75 t/h. From the results, it can be deduced that there may be a linear relationship between the MF and the queuing times. In reducing the queuing time, the MF will tend to 1.0, which indicates a perfect MF. Combinations with the lowest queuing times does not necessarily reflect the best possible production fleet. The MF ratio for the optimized fleet yielded the largest MF ratio in this specific case, yet it resulted in the best possible production fleet. Thus, these MF calculations cannot be used in isolation from other fleet optimizing measures.
Productivity
Due to the nature of time studies and the associated methodology, the study focused on activities associated with delays in the extraction process. The average reported availability over the study period was 86.6%, according to data collected from the mine's Integrated Management System (IMS). Figure 5 compares the observed and reported utilization. In eight out of ten days, the observed utilization was lower than what was reported. The average IMS reported utilization is 83.2%, whereas the average measured results show a 71.3% utilization. For the period between Christmas Day and New Year's Day, utilization reduced significantly. This period is generally known in the mining industry as the 'Silly Season', which typically reflects increased lost-time injury (LTI) trends.
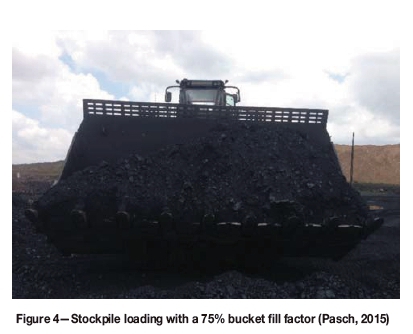
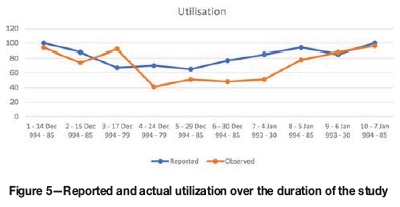
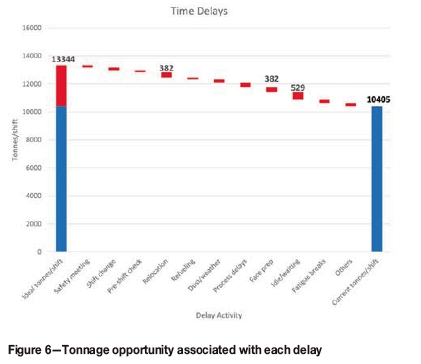
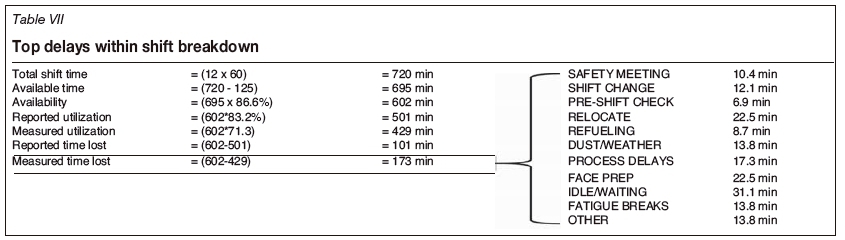
Table VII shows the contribution of each delay to the total measured lost time. The main contributors to these delays are idle or waiting time. Using the rate of production, 1445 t/h, this amounts to a total of 10 405 t per shift and consequently 20 810 t/d. If delays could be reduced so that the full 602 minutes available could be utilized, a total of 26 688 t/d could theoretically be achieved for the targeted pit.
Figure 6 highlights the opportunity tonnage associated with each delay. An additional 2 940 t per shift is achievable, which could increase revenue by 18%.
Conclusions
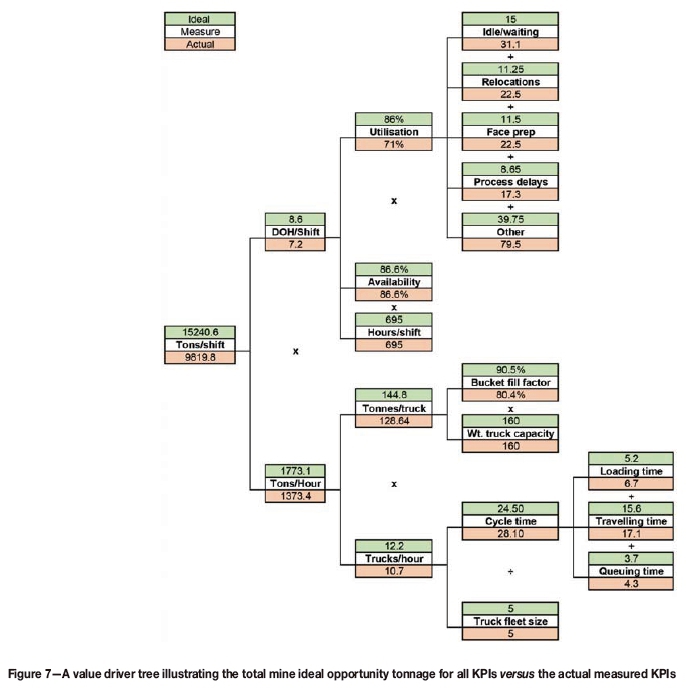
The targeted pit is a high-producing asset for the mine, and the company is heavily dependent on this pit as an operation and a company. Several relevant KPIs for the evaluation and identification of productivity improvement opportunities were defined during this study. These KPIs are bucket fill factors, loading conditions, cycle and loading time, time utilization, and deviations from schedule. The combined tonnage improvement opportunity can be viewed in Figure 7, which reflects a theoretical improvement of 49.4%. From the research, it is evident that an increase in production will ultimately decrease the operational unit cost, which could increase profit margins significantly.
Recommendations
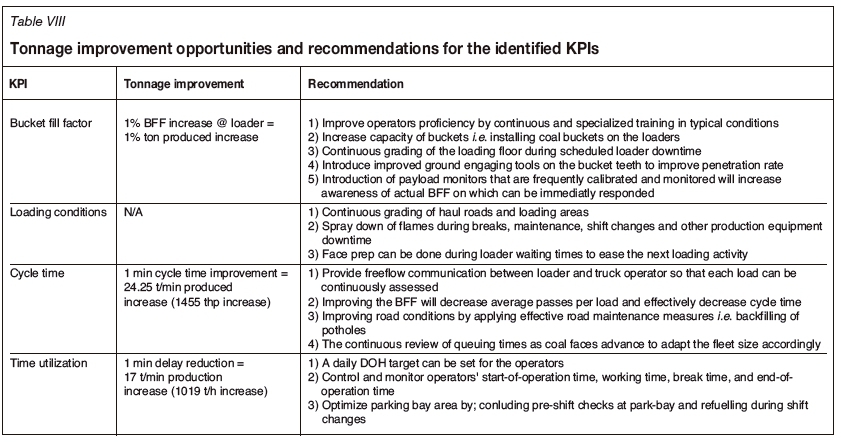
Recommendations for each KPI are summarized in Table VIII.
Suggestions
► An investigation is necessary to confirm the use of the correct buckets. Bucket costs are relatively expensive in consideration of operational costss. In addition, an analysis can be conducted to consider additional bucket protection as this can affect the performance of the machine through higher horsepower demand, higher fuel consumption, and reduced productivity.
► It is suggested that future studies that are largely dependent on statistics should be analysed by means of statistical approaches, for instance, Monte Carlo simulations and chi-square tests. This will increase the accuracy of any conclusions reached in conjunction with a significant amount of measured field data. If this is made available to the investigator, a substantial value can be drawn from such investigations.
References
Anon. 2016. FY16 Financial Results & Outlook. [ Links ]
Anon. 2015. Equity Research, Australia: CreditSuisse [ Links ]
Australian Government. 2014. Analyses of diesel use for mine haul and transport operations. Department of Resources, Energy and Tourism. https://www.eex.gov.au/sites/g/files/net1896/f/files/2014/06/Analyses-of-Diesel-Use-for-Mine-Haul-and-Transport-Operations.pdf [accessed 30 May 2017]. [ Links ]
Baxter, R. 2015. RSA coal mining industry - Economic overview and realising the potential of the sector. Chamber of Mines, Johannesburg. [ Links ]
CAT Mining. 2017. Products - Equipment. https://www.cat.com/en_ZA/products/new/equipment/wheel-loaders.html [accessed 14 April 2017]. [ Links ]
Choudhary, R.P. 2015. Optimization of load-and-haul mining systems by OEE and Match Factor for surface mining. International Journal of Applied Engineering and Technology, vol. 5, no. 2 (April-June). pp. 96-102. [ Links ]
Mohammadi, M., Rai, R, and Gupta, S. 2015. Performance measurement of mining equipment. International Journal of Emerging Technology and Advanced Engineering, vol. 5, no. 7. pp. 240-248 [ Links ]
Krause, A.J. 2006. Shovel - truck cycle simulation methods in surface mining. MSC thesis, University of the Witwatersrand, Johannesburg. http://hdl.handle.net/10539/4763 [accessed 18 May 2018] ♦ [ Links ]
Paper received May 2018
Paper written on project work carried out in partial fulfilment of BEng (Mining Engineering) degree

