


Services on Demand
Article
 English (pdf)
 Article in xml format
 Article references
Indicators

Related links
-
 Cited by Google
 -
 Similars in Google
Share

 Permalink
Journal of the Southern African Institute of Mining and Metallurgy
On-line version ISSN 2411-9717
Print version ISSN 2225-6253
J. S. Afr. Inst. Min. Metall. vol.118 n.4 Johannesburg Apr. 2018
http://dx.doi.org/10.17159/2411-9717/2018/v118n4a11
PAPERS OF GENERAL INTEREST
The effects of orepass loss on loading, hauling, and dumping operations and production rates in a sublevel caving mine
B. SkawinaI; J. GrebergI; A. SalamaII; A. GustafsonI
IDepartment of Civil, Environment and Natural Resources EngineeringDivion of Mining and Rock Engineering, hulea University of Technology, hulea, Sweden
IIDepartment of Chemical and Mining, College of Engineering and Technology, The University of Dar es Salaam, Tanzania
SYNOPSIS
Orepass failure is a well-known problem in deep mines, and the risk of losing an orepass is associated with severe production disturbances. In the near future, one possible scenario in the Loussavaara Kiirunavaara Aktiebolag (LKAB) Malmberget mine is to concentrate the mining operation in fewer, but larger, production areas. In this paper we evaluate the effects of orepass loss on loading, hauling, and dumping operations and production rates using discrete event simulation, by simulating part of the Malmberget mine loading and hauling system under different environmental and operational constraints.
Keywords: LHDs, orepass loss, production simulation, underground iron ore mining.
Introduction
Underground mining of iron ore takes place through a number of different unit operations, such as extraction, transport, storage, or sizing of the material. In caving and sublevel stoping mines, orepass systems are commonly used to transfer broken rock between different levels (Hambley, 1987). Orepass structures are exposed to the risk of failure, leading to a need for redevelopment or rehabilitation, thus creating a major problem for the mining operations (Brummer, 1998). An orepass can be lost as a result of operational or structural failure, leading to either short-term or longterm loss. This paper focuses on the effects on the LHD operations and related production rates following a long-term loss of one or more of the orepasses in an underground mine using sublevel caving. In this study, long-term is defined as the time that it takes to mine out a whole production area. The effects of increasing the LHD fleet size in order to maintain production are also analysed. Different scenarios have been used to analyse different production areas, different numbers of vehicles, and different numbers of available orepasses.
LKAB Malmberget mine
The LKAB's Malmberget mine, located in northern Sweden, is an iron ore mine using the sublevel caving method to extract ore. Underground operations in Malmberget began in 1920 (Quinteiro and Hedström, 2001). Sublevel caving was introduced as the main mining method in the 1970s, and since then main haulage levels have been built on levels 600, 815, 1 000, and 1 250 metres. The ore reserves are distributed over 20 large and small orebodies, 14 of which are currently in production. The orebodies are spread over an area 5 km long and 2.5 km wide.
A total of three production areas (A, B, and C) are analysed in this study (Figures 1-3). The figures depict the orebody outlines, the orepasses, and the drifts used for hauling the ore from the face to one of the orepass locations. These production areas were chosen as together they will represent a substantial share of the total mine production in the future. In each of the production areas studied, there are four orepasses. The orepasses are around 300 m long, have a diameter of around 3 m, and dip around 60 degrees. The drifts are approximately 5 m high and 6.5 m wide.
The current loading practice in Malmberget mine is based on the use of manually operated diesel LHDs with a 21 t bucket capacity. In the smaller orebodies, there is usually one LHD in operation. In larger production areas, two LHDs may be used simultaneously. The number of orepasses in each orebody varies from one to four, depending on the size of the production area. The sequencing of drifts to be extracted is mainly based on factors related to rock stress, the ancillary activities in the production drifts, distances to the orepasses (depending on the production rate requirement), and the amount of ore left in each of the production drifts. The ore is transported from the drawpoints to the orepasses. From the orepasses, the ore is collected on the main haulage level by trucks and then hauled to the crusher, where the rock is fragmented and further transported.
Problem definition
One concern related to the use of orepass structures is their ability to convey or store material without unnecessary stoppages (Beus et al., 2001) that could result in unwanted disturbances in production. These stoppages are associated
with hang-ups, piping, blockages, orepass degradation, and wall stability (Beus et al., 2001; Hadjigeorgiou and Lessard, 2010). Disturbances are often the result of caving, poor fragmentation (boulder arching or cohesive arching), poor design of the orepass (wall stability or piping), or ingress of water (mud rushes or piping) (Beus et al., 2001). Even though loss of orepasses is a recognized problem and often leads to a long-term reduction in operational capacity, there is still no efficient strategy that will quickly bring the orepasses back to an operational state and maintain the operational capacity of the area. Several simulation studies that dealt with transportation systems of rock in underground mines have been performed for different mining operations (Hoare and Willis, 1992; Hunt, 1994; Turner, 1999; Salama, Greberg, and Schunnesson, 2014; Salama et al., 2016; Usmani, Szymanski, and Apel, 2014). However, the effects of orepass loss on LHD operations have not been extensively studied and published. As the rehabilitation cost is high and the time required is usually long, in some cases extending to years, a new orepass is often developed instead. If unpredicted orepass failure occurs, alternative strategies should be applied in order to compensate for the loss. One of the possible strategies is to increase the fleet size in the areas where an orepass is available or use an alternative transportation system such as trucking. However, this might not be a feasible solution due to, for example, possible traffic congestion.
Simulation
The study presented in this paper was conducted using discrete event simulation (DES). When using DES, the goal is not to model an exact representation of the real system but to answer or solve specific problems using a simplified model of the system. In other words, the goal is to capture the important features that are of interest without losing focus on quality aspects such as building of the model, analysis, and event runs (Thesen and Travis, 1998). In this study, the simulation tool AutoMod was used to model the studied production areas. AutoMod was chosen as it has the necessary capabilities and flexibility in developing various custom-made transportation systems, together with inbuilt debugging and tracing features (Greberg and Sundqvist, 2011) that make the verification and validation process easier.
Scenarios
In this study, 15 production scenarios were simulated (Table I) for each of the three production areas. In Table I 'FL' stands for the orepass located in the far-left side of the studied production areas, 'CL' stands for the orepasses located in the centre-left position, while 'CR' and 'FR' stand for centre-right and far-right, respectively. The number of operational orepasses varies between one and four while the number of LHDs ranges between one and six in each scenario. The number of vehicles was varied for each scenario in order to check whether the current infrastructure and system can accommodate additional machines in case of orepass loss. The maximum number of six LHDs was used in this study, since larger numbers of LHDs would result in excessive waiting times for the machines, and would be highly impractical. The simulated production scenarios are not meant to predict exact numbers but are constructed for the purpose of analysing and visualizing how the loss of an orepass affects the productivity of LHDs. This means that the focus was not on optimizing the number of LHDs but to study and analyse the effects of orepass loss on loading, hauling, and dumping operations and production rates for the specified scenarios. The modelled scenarios can be summarized as follows:
► In scenario 1, four orepasses were operational
► In scenarios 2 to 5, three orepasses were operational and one was not operational
► In scenarios 6 to 11, two orepasses were operational and two were not operational
► In scenarios 12 to 15, one orepass was operational and three were not operational.
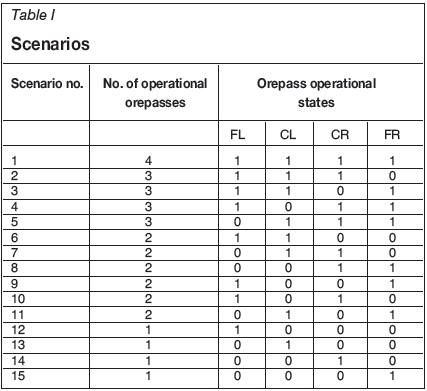
All simulations resulted in the following outputs: time to mine out the production area, the LHD waiting times caused by an orepass loss, the production rate, and the LHD travelling distances. Production rate is defined as total tons loaded into the orepasses located in one of the production areas divided by the total number of days required to complete production. Waiting time is defined as the percentage of the time that LHD operators had to wait in the production drifts for an orepass to become available.
Simulation model verification and validation
A number of tests were performed in order to ensure the correctness of the model (verification) and to ensure that the model reflects the real system (validation). Verification and validation tests of the model are necessary to increase the level of confidence, the credibility, and the probability of the model correctness (Kleijnen, 1995; Sargent, 2011). Thus, verification and validation tests reduce the risk of making errors and generating misleading results. When verifying, the consistency of the simulation model with the conceptual model was ensured by testing the model behaviour with the specialists and experts involved in the study. Moreover, by testing the logic with the use of an interactive run controller (debugging feature), an examination of the animation and systematic scanning of the logic was performed. When validating the model, a comparison of scenarios with the real system was made with the assistance of specialists. This was ensured by comparing the production data from the operating mine with the results from the simulation. In addition, extreme condition tests, degenerate tests, traces, and internal validity were used to test the credibility of the model. An extreme condition test was performed on the LHDs by setting their bucket capacity to zero and, after the simulation was run, observing the final production results. The degenerate test was used to see how the average number of cycles, production rates, and queuing change when different input parameters are used in the simulation model. Traces were used to trace the behaviour of the specific entities during the run of the model (possible via debugging feature). Tracing of an entity was used to ascertain any abnormal symptoms that the specific entity displayed, and further to determine the exactness of, and if necessary correct, the model logic. Internal validity was tested (five additional replications were performed for each set of different scenarios in each production area) by ensuring that, after changing the stream random numbers in the model, the model results did not differ significantly from each other. In most of the cases, the results of running the model with different stream random numbers deviated from each other by no more than 5%. However, higher output variations were detected in production area C after running scenarios 12-15, with more than two LHDs in operation. This deviation is related to the way in which the vehicles claim the orepass locations. The orepass locations are claimed by vehicles after the bucket has been filled and before the vehicle has started to travel to the location. This could create a condition, especially for larger production areas, with fewer accessible orepass locations, in which the vehicle further away from the accessible orepass claims the orepass before the vehicle closer to that orepass. Since the simulated production scenarios were not meant to predict exact numbers but were constructed for the purpose of analysing and visualizing how the loss of an orepass affects the productivity of LHDs, this was considered acceptable and no further action was required.
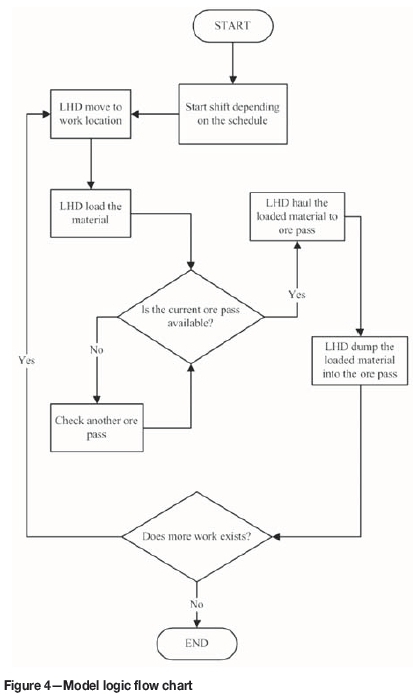
Model settings and logic
The simplified model logic is described in the flow chart shown in Figure 4. In all cases, machines were ordered to travel to one of the production drifts and then assigned to one of the orepasses. The machine operators chose their destination by selecting the closest orepass. If the closest orepass was unavailable, the machines travelled to another orepass close by. If all orepasses were unavailable, the machine operators waited until an orepass was available. This means that the LHD cycle time is affected by the time that the LHD has to wait in the production drift for the orepass to become available. Each simulation ended when there was no longer any material left to be loaded, indicating that the production level was mined out. It was assumed that there was enough blasted material for loading at the faces at all times. The condition of the lighting in the drifts, floor, roof, and walls was not considered as an obstacle to the loading processes, hence collisions with walls or spillage of the muck would not influence the vehicles. To simplify the operation, one type of machine, a 21 t diesel LHD, was in operation for 15 hours per day per simulated production area. However, during this time the LHD encountered delays in operation whenever production disturbances or breakdown of the vehicle took place, thus reducing the operating time to almost 10.3 hours per day. Work was performed seven days a week. During the breaks, the machine was sent to the closest parking space. Whenever breakdown of a vehicle took place, the vehicle stopped at its current location.
Input data
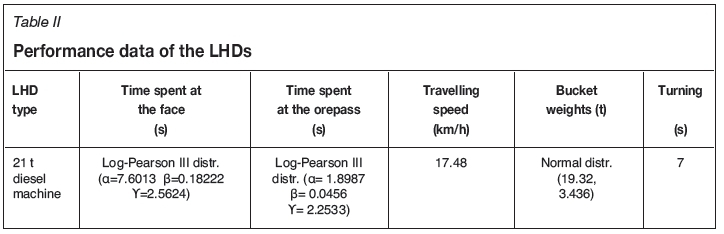
The model input data consists of the mine layout (Figures 13) with the distances from the loading location to the orepasses, availability of the vehicles, availability of the production areas, and performance data of the vehicles (Table II). The theoretical tonnage available in each production area was estimated by adding 10 000 t of ore for every 3 m blast. These resulted in totals of 15.06 Mt of ore in production area A, 14.37 Mt in production area B, and 17.43 Mt in production area C. It was assumed that LHDs will be available for operation 90% of the total time and the production disturbances were estimated to be 20% of the total time. Availability of the vehicles and production disturbances are values obtained from the studied mine. The LHD performance data (Table II) was collected from the mine on several different occasions through video recordings, documentation, and time studies. Data collected from video recordings and from time studies was used to identify the probability distributions and Kolmogorov-Smirnov, Anderson Darling, and chi-square goodness-of-fit tests were performed to evaluate the chosen distribution and make sure that the formal conditions are satisfied. Kolmogorov-Smirnov and chi-square are standard goodness-of-fit tests (Banks et al., 2013). The Anderson Darling test is similar to Kolmogorov-Smirnov but is based on a more comprehensive measure of difference (Banks et al., 2013). In Table II:
► Time spent at the face refers to the time that the LHD operator spent at the face preparing the material for loading and loading the bucket. The time is measured from when the vehicle enters the production face area to when it leaves. Time was recorded only if the machine was leaving the face area with a loaded bucket, otherwise the time spent at the face was considered as a disturbance and assumed to be included in the production disturbances. The input data was collected in a production area located in the same orebody as production area B and with similar production area layout as production area B. Time spent at the face varied from 13 to 429 seconds, with an average of 59.8 seconds.
► Time spent at the orepass refers to the time that the LHD operator spent at the orepass location dumping the material. The time is measured from when the vehicle enters the orepass area to when it leaves. The input data was collected from a production area located in the same orebody as production area A and having a similar production area layout. Time spent at the orepass varied from 10 seconds to 12 seconds, with an average of 10.4 seconds. This saved time when dumping and thus the machine stopped at the orepass for no longer than 2 to 3 seconds.
► Travelling speed refers to the average speed used for vehicle movement in the simulation model. An average travelling speed was calculated from the wireless online loader information system (WOLIS) (Adlerborn and Selberg, 2008) of one of the mined production areas from years 2009-2014. The input data was collected from a production area located in the same orebody as production area B and having a similar production area layout. The average speed was based on the distances and travelling cycle times. In the real system, the travelling speed of the LHD would be different depending on whether the bucket is empty or loaded, the skills of the operators, infrastructure, or machine reliability. However, with regard to the purpose of the simulation, there is a need for some degree of simplification to avoid unnecessary complexity of the model. Therefore, the simulation model travelling speed was calculated based on average cycle times. This simplification does not affect the study and the simulation since the aim is not to simulate the exact behaviour of the LHD movement but rather to ascertain the effects of orepass loss on loading, hauling, and dumping operations.
► Bucket weights represent the tons drawn from the production face. The bucket weights are based on the WOLIS data gathered from the operating mine. Bucket weight data shown in Table II is from one year of production (Gustafson et al., 2013). A normal distribution was selected to represent this data as it is usually used to model the events with limited variability (Banks, 2004).
► Turning represents the time that the LHD operator spent turning the vehicle before and after entering the orepass location. The time is measured from when the LHD operator starts to make a turn to when the vehicle starts to make its way to or away from the orepass location. The data was collected from a production area located in the same orebody as production area A and having a similar layout. Time spent turning the vehicle varied from 6 seconds to 8 seconds, with an average of 7 seconds.
Results and discussion
The simulation was conducted for 15 scenarios for each of the three production areas in three different orebodies: A, B, and C respectively. Each scenario consists of six runs where the number of LHDs ranged from one to six, and the number of operational orepasses ranged from one to four. Having many vehicles in only one production area creates a higher risk of production disturbances, especially when an orepass fails. Furthermore, the ventilation of the drifts to remove the exhaust gases would have to increase, increasing both the cost for ventilation and the traffic congestion. Therefore having more than six LHDs in operation would not be a feasible solution and thus was not simulated in this study. The time to mine out the production area varied depending on the number of LHDs and orepasses in operation (Figure 5-7).
Time to mine out the production area
In Figures 5-7, the horizontal axis shows the scenario number clustered with the maximum number of operational orepasses for a given range of scenarios. The vertical axis shows the time that the LHDs required to finish mining the whole production area. The time to finish mining the production area in orebodies A, B, and C (Figure 5-7) ranges from 733 days to 5 902 days, 628 days to 4 098 days, and 856 days to 7 644 days respectively, depending on the scenario and number of LHDs used. The highest variation in the time to finish a mining production area is observed for orebody C, whereas the lowest variation is observed in orebody B.
Variation in number of operational orepasses with the same number ofLHDs in operation
When there are four or three operational orepasses (Figure 5-7), the time to mine out the production area is similar, with a difference of less than 653 days. When three or two orepasses are operational, the time to finish a mining production area varies little compared to when all four orepasses are operational. This suggests that in the case of scheduled maintenance or operational or structural failure of an orepass, there are enough orepasses available to take up the extra capacity. Hence, there is a possibility of increasing the number of LHDs operating, as long as the orepasses are not over-utilized and as long as the LHD waiting time for the orepass to become available is not excessive. When only two orepasses are operational, the differences become larger, and vary up to 1 131 days. If only one orepass is operational, the production rate drops considerably, extending the time to mine out the production area by up to 3 804 days.
Variation in number of LHDs in operation
In all scenarios, the addition of one LHD is sufficient to maintain or even improve production. However, the waiting time for the orepass to become available slowly starts to take effect, reducing the vehicle working time, since when the number of LHDs increases from one to four, the difference in the time to finish mining the production area is greater than when increasing the number from four to five or to six. In scenarios 12-15, with more than two LHDs in operation and only one operational orepass, the difference in time to finish mining the production area is much lower. As a consequence, this leads to longer waiting times for the LHDs since an extra LHD increases the waiting time for the vehicles operating in that area.
Effect ofan orepass loss on LHD waiting times
The LHD waiting times are related to waiting for an orepass to become available for dumping the ore, and are presented in Figures 8-10. Waiting time can comprise up to 70% of the total time that the vehicle was scheduled to work. The total sum of waiting times for each scenario confirms that the lower the number of operational orepasses, the higher the total waiting time, ranging between 0% and 70% of the total time. The locations of the orepasses in the production area are not as critical as the orepass loss in each set of scenarios (2-5, 6-11, 12-15). For example, in orebody A, when six LHDs are used, the differences in waiting times in scenarios 6-11 are not higher than 3.3%, whereas the difference in waiting time between scenarios 5 and 6 is 17.4%.
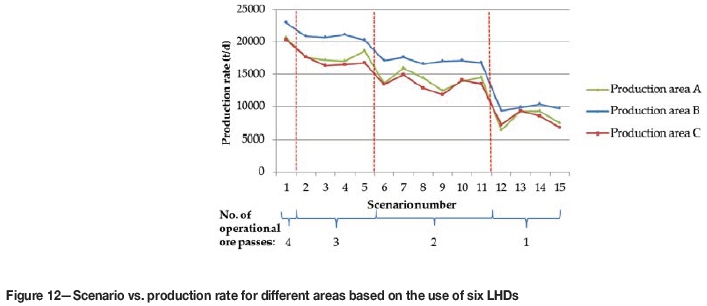
Production rates
Figure 11 and Figure 12 show comparisons of production rates between the production areas. Depending on the scenario number and production area, the production rates vary, but tend to decrease with decreasing number of available orepasses, especially when six LHDs are in operation. Only the results from scenarios with three and six LHDs are shown since the results from scenarios with one, two, four, and five LHDs follow a similar pattern. In production area B the production rate is higher than in production areas A and C as there are shorter distances to cover. Differences between the production areas depend mainly on the average distance that the LHD needs to travel to the orepasses. The longest average distance that the LHD must travel to the orepasses is in production area C. The highest variation in the production rate, when using six LHDs (Figure 12) was 14 235 t/d in orebody A, whereas the highest variation when using three LHDs (Figure 11) was 6 920 t/d in orebody C. Thus, the higher the number of the LHDs operating in the production area affected by an orepass loss, the higher the production rate variation.
Figure 13 shows the relationship between the production rate and distance travelled in production area C. The results are based on the use of one LHD. A similar pattern followed in production areas A and B. From Figure 13 it can be seen that the lower the number of operational orepasses, the higher the average LHDs travelling distance and the lower the production rate. In scenarios number 12 and 15 the machines had to travel further than in scenarios number 13 and 14, resulting in lower production rates. This is because the location of the operational orepass in scenario 12 and scenario 15 is to the far left and far right side of the studied production area. The most severe scenarios are those in which the orepasses closer to the centre of the studied production areas are lost. Similarly, in scenarios number 6, 8, and 9, the LHDs had to travel further than in scenarios number 7, 10, and 11.
Likewise, in Figure 14, the relationship between the production rate and total distance travelled in production area C is shown. These results are based on having six LHDs in operation. In scenarios with more operational orepasses (scenarios number 6, 8, 9, 10, and 11) the travelling distances were further than in the scenarios with one operational orepass (scenarios number 13 and 14). This suggests that the location of the orepasses and sequencing of the vehicles affects the LHD distance travelled, but not necessarily the production rate.
Additionally, the different locations of the orepasses affect the production. This can be shown when three LHDs are working on the right-hand side of the production area. The distance to the far right orepass is much shorter than to the other orepasses, but only one LHD can be accommodated at a time in the FR orepass, meaning that the other two LHDs would have to travel to another orepass or wait for the first LHD to finish. Therefore, an appropriate strategy for fleet management is necessary in order to maintain the production rate. One possible solution is to decrease time losses by managing the movement of the LHDs. For example, whenever one LHD is dumping, the second is loading, and the third is travelling to or from the orepass. Another option is to not allow the use of more than one LHD in each production area, by redirecting part of the fleet into another production area.
Conclusions
Several scenarios were studied with the purpose of analysing the effects of the loss of one or more orepasses on the LHD operations and the production rate. The main objectives were to study how the current LHD operations are affected when one or several of the orepasses cannot be used, and how many of the orepasses can be lost while still maintaining production rates. The following conclusions can be drawn.
► If one or two of the four orepasses are lost, production can be maintained, or even improved, by the addition of one LHD.
► In the scenario when only one orepass remains in operation, the production rate of the vehicles drops due to increased waiting times, especially when extra LHDs are being used.
► Operating with a high number LHDs in the production area affected by an orepass loss results in greater variations in production rate than when operating with a low number of LHDs. Thus, instead of using more LHDs in the area where an orepass failed, transferring the LHDs to another production area (if possible) to achieve higher production rates could be a short-term option.
► When two adjacent drifts are used for loading, the LHDs may end up having to travel to the orepass located further away from the production drift as the closer one may be occupied by another LHD. Consequently, this would lead to a decrease in production rate and should be avoided.
► When two orepasses are operational, increasing the number of LHDs from five to six would result in a higher production rate, whereas if only one orepass remains in operation, using six LHDs would result in almost the same production rate as using five LHDs. The remaining orepass in operation will be at maximum utilization, with the LHDs continuously claiming that orepass. This restricts the increased number of LHDs from dumping more material into the
orepass and highlights the need for analysis of the system in order to avoid increasing waiting times and traffic problems by using too many machines in the area.
► In the studied production areas, the most severe scenarios involve losing the orepasses that are located closer to the centre of the production area.
► Mine management should have a strategy for orepass loss situations in order to be able to mitigate the possible production disturbances and try to avoid high variations in the production rates. Otherwise, loss of an orepass would likely result in additional fleet requirements or in production disturbances while the orepass is being restored.
► In order to avoid increased waiting times and traffic congestion due to using too many machines in the working areas, an evaluation of whether the system can accommodate an extra machine in the production area could be conducted. Alternatively, the machine should be redirected into another production area, or additional orepass inlets could be constructed to allow entry for the incoming fleet.
The simulation created a baseline for further studies of possible alternatives and improvements that can be made for future underground transportation systems. As most underground mines operate with small economic margins, strategies should be developed to mitigate the production disturbances related to the loss of one or more orepasses. The results of this investigation show clearly the effect of the number of additional LHDs in operation on production rate, stressing the importance of a well-developed strategy.
References
Adlerborn, B. and Selberg, M. 2008. GIRON and WOLIS - Two mine applications. Proceedings of the 5th International Conference & Exhibition on Mass Mining, Luleá, Sweden, 9-11 June 2008. Schunnesson, H. and Nordlund, E. (eds). Luleá University of Technology. pp. 637-642. [ Links ]
Banks, J. 2004. Getting started with AutoMod. Brooks Automation, Chelmsford, MA. [ Links ]
Banks, J., Carson, J.S., Nelson, B.L., and Nicol, D.M. 2013. Discrete-event System Simulation. 5th edn. Pearson New International. [ Links ]
Beus, B.J., Pariseau, W.G., Steward, B.M., and Iverson, S.R. 2001. Design of ore passes, in underground mining methods. Mining Underground Methods. Hustrulid, W.A. and Bullock, R.L. (eds.). SME, New York. pp. 627-634. [ Links ]
Brummer, R. 1998. Design of orepasses methods for determining the useful life of ore-passes based on previous experience and case studies. Technical Report, CAMIRO Mining Division Limited. Sudbury, ON, Canada. [ Links ]
EasyFit. http://www.mathwave.com/easyfit-distribution-fitting.html [accessed 24 September 2016]. [ Links ]
Greberg, J., Salama, Α., Gustafson Α., and Skawina, B. 2016. Alternative process flow for underground mining operations: Analysis of conceptual transport methods using discrete event simulation. Minerals, vol. 6, no. 3. pp. 65-79. [ Links ]
Greberg, J. and Sundqvist, F. 2011. Simulation as a tool for mine planning. Proceedings of the 2nd International Future Mining Conference, Sydney, 22-23 November 2011. Australasian Institute of Mining and Metallurgy, Melbourne. pp. 273-278. [ Links ]
Gustafson, Α., Schunnesson, H., Galar, D., and Kumar, U. 2013. Production and maintenance performance analysis: manual versus semi-automatic LHDs. Journal of Quality in Maintenance Engineering, vol. 19, no. 1. pp. 74-88. [ Links ]
Hadjigeorgiou, J. and Lessard, J.F. 2010. Strategies for restoring material flow in ore and waste pass systems. International Journal of Mining, Reclamation and Environment, vol. 24. pp. 267-282. [ Links ]
Hambley, D.F. 1987. Design of ore pass systems for underground mines. CIM Bulletin, vol. 897. pp. 25-30. [ Links ]
Hoare, R.T. and Willis, R.J. 1992. Α case study of animated computer simulation in the Australian mining industry. Journal of Operational Research Society, vol. 43. pp. 1113-1120. [ Links ]
Hunt, C. 1994. Simulation model of ore transport at the Henderson mine. Computational Geosciences, vol. 20. pp. 75-84. [ Links ]
Kleijnen, J. 1995. Verification and validation of simulation models. European Journal of Operational Research, vol. 82. pp. 145-162. [ Links ]
Quinteiro, M. and Hedström, O. 2001. Underground iron ore mining at LKAB, Sweden. Mining Underground Methods. Hustrulid, W.A. and Bullock, R.L. (eds.). SME, New York. pp. 361-368. [ Links ]
Salama, Α., Greberg, J., and Schunnesson, H. 2014. The use of discrete event simulation for underground haulage mining equipment selection. International Journal of Mining andMineral Engineering, vol. 5, no. 3. pp. 256-271. [ Links ]
Sargent, R.G. 2011. Verification and validation of simulation models. Proceedings of the 2011 Winter Simulation Conference, Phoenix, AZ. IEEE, New York. pp. 183-198. [ Links ]
Thesen, Α. and Travis, L.E. 1998. Handbook of Simulation: Principles, Methodology, Advances, Applications, and Practice. Wiley, New York, USA. [ Links ]
Turner, R.J. 1999. Simulation in the mining industry of South Africa. International Journal of Surface Mining, Reclamation and Environment, vol. 13. pp. 47-56. [ Links ]
Usmani, T., Szymanski, J., and Apel, D. 2014. Optimisation of LHDs operation at the extraction level in a block cave project. International Journal of Mining and Mineral Engineering, vol. 5, no. 2. pp. 138-151. [ Links ] ♦
Paper received Aug. 2017
revised paper received Nov. 2017

