


Services on Demand
Article
 English (pdf)
 Article in xml format
 Article references
Indicators

Related links
-
 Cited by Google
 -
 Similars in Google
Share

 Permalink
Journal of the Southern African Institute of Mining and Metallurgy
On-line version ISSN 2411-9717
Print version ISSN 2225-6253
J. S. Afr. Inst. Min. Metall. vol.118 n.4 Johannesburg Apr. 2018
http://dx.doi.org/10.17159/2411-9717/2018/v118n4a3
PLATINUM CONFERENCE 2017
Furnace integrity monitoring using principal component analysis: an industrial case study
J.W.D. GroenewaldI; L.R. NelsonI; R.J. HundermarkII; K. PhageI; R.L. SakaranI; Q. van RooyenI; A. CizekI
IAnglo American Platinum Ltd., South Africa
IIAnglo American plc., South Africa
SYNOPSIS
Furnace temperature monitoring, the cornerstone of furnace integrity monitoring, has traditionally been accomplished using alarm and trip limits set on individual temperature measurements of the copper coolers and refractory, with limits typically defined based on design criteria. Due to the changes in furnace operating conditions and the sheer number of temperature measurements available on a furnace, this often proves to be very ineffective. Principal component analysis (PCA) was applied to construct two models for furnace integrity monitoring: a short-term spike detection model and a long-term trend detection model. The Hotelling's T2 statistic and the lack of model fit statistic SPE were used to monitor the furnace integrity in real time, alerting plant personnel of potential abnormal process conditions. Application of the system to provide more sensitive furnace integrity monitoring and its recent use in support of a decision to safely delay the timing of a furnace endwall rebuild are demonstrated.
Keywords: furnace temperature monitoring, modelling, fault detection, principal component analysis.
Introduction
Electric smelting furnaces typically consist of a refractory shell incorporating strategically placed water-cooled copper components for maintaining furnace integrity. Over time, both the refractory lining and water-cooled copper components can undergo deterioration and wear, resulting in potential failure in the form of a furnace run-out, where furnace matte and/or slag leaves the furnace in an uncontrolled manner. With smelting occurring at extreme temperatures, large amounts of conventional thermocouples and new fibre optic technology (for copper) and resistance temperature detectors (for cooling water) are used to continuously measure the temperature of the furnace crucible lining with the aim of ensuring safe operation of the furnace. Measurements from these numerous sensors are typically recorded at high frequency, with data overload of operators and metallurgical staff alike commonly occurring.
Monitoring of the furnace temperature measurements, which is pivotal to furnace integrity monitoring, has traditionally been accomplished through the use of alarm and trip limits set on individual temperature measurements of the copper coolers, their cooling water and refractory, with limits typically defined based on design criteria and not on current operating conditions. Due to the changes in furnace operating conditions and the sheer number of temperature measurements available on a furnace this often proves to be very ineffective, except when large upset conditions occur; and the warning is then often too late.
When Mortimer Smelter, a platinum group metal (PGM) concentrate smelting operation located on the western limb of the Bushveld Complex, changed its cooler design to novel graphite-protected shallow-cooled composite copper coolers with graphite-protected deep-cooled copper lintel coolers, the furnace was at some risk due to the new design. In order to confirm that maintenance could take place as planned, an alternative temperature monitoring strategy was required. Multivariate statistical data-based techniques, proven to be effective in circumventing the previously mentioned monitoring inadequacies through data compression, dimensionality reduction, and the handling of noise and correlation (Venkatasubramanian et al., 2003), were considered as the foundation of such a strategy. In this paper we discuss the development of and operating experience from a multivariate statistical data-based system for monitoring furnace temperature measurements. Further application of the system so developed, informing a decision to delay a matte endwall rebuild on the Polokwane Smelter, is also described.
Multivariate furnace temperature monitoring
Various statistical methods, both univariate and multivariate, are available for the monitoring of process conditions. Univariate monitoring commonly permits investigation into the magnitude of deviation of only one variable, independently of all other variables, at a given time. Statistically, many univariate monitoring charts each set with a 1 - α confidence limit will result in many more false alarms than a single multivariate monitoring chart set with a 1 - α confidence limit. This often results in inaccurate, delayed conclusions being drawn (Kourti and MacGregor, 1995). Essential process information may not lie within any individual process variable (univariate), but in how the variables change with respect to one another (multivariate). Univariate monitoring cannot account for correlation between variables. Given the large number of temperature measurements that are spatially and temporally correlated, it is important to incorporate possible correlations in a monitoring chart. Multivariate statistical data-based fault detection and change point detection techniques overcome many of these shortfalls.
Statistical data-based fault detection techniques make use of a mathematical representation of the process based on historical process data to verify whether a process is within a 'state of statistical control', while still allowing 'common-cause' variation (variation that affects the process all the time and is essentially unavoidable within the current process) (Kourti and MacGregor, 1995). Typically, a statistical model is built using historical process data from when the process was in a state of normal operating condition (NOC), with new process data being compared to this NOC model in order to detect a change in the system. In the pyrometallurgical industry, this is often colloquially described as a 'test for unnaturalness' or 'special cause variation'. Complementing statistical data-based fault detection techniques, change point detection techniques aim to determine whether a process in its current state is exhibiting a change in behaviour compared to the behaviour immediately preceding its current state, irrespective of whether it was in a state of normal process behaviour or not.
Making use of statistical data-based fault detection techniques for general furnace temperature monitoring, Thwaites et al. (2013) implemented a principal component analysis (PCA)-based system at Xstrata Copper's Kidd Metallurgical Division copper smelter, monitoring many different temperature signals simultaneously (Nelson et al., 2007; King, 2007). The system monitors the bathline thermocouples on the smelting and converting furnaces, and alarms only when departures from normal behaviour in the relationships between the signals occur. This allows for much more sensitive and selective alarms, and even automatically shuts the converting furnace down at a critical alarm level. The benefits of the system include not only improved visibility and follow-up of furnace events, but also improved maintenance, use, and availability of the bathline thermocouples.
For real-time monitoring and assessment of the performance and integrity of water-cooled tap-blocks in a smelting furnace, Gunnewiek et al. (2008) developed a tap-block diagnostic system (TDS) using a combination of computational fluid dynamics (CFD) and PCA to model and identify modes of acceptable and unacceptable tapping operation. The system considers tap-block thermocouple measurements, cooling water temperatures, and flow rates to evaluate the residual integrity of the tap-block. Claimed benefits of the system include improved safety and maintenance planning due to early warnings of refractory wear.
Due to its robust nature and ease of implementation, PCA as a statistical data-based fault detection approach also forms the core of this work. Comparisons are subsequently made to Bayesian and singular spectrum analysis (SSA) change point detection approaches.
Principal component analysis
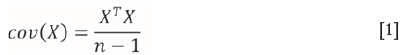
Conventional PCA finds linear combinations of the variables in a data-set X, consisting of n rows (observations) and p columns (variables), through eigenvector decomposition of the correlation matrix of the variables (Wise and Gallagher, 1996). Prior to PCA, all the variables in X must first be auto-scaled (resulting in scaled variables with zero mean and a standard deviation of unity), avoiding important variables of small magnitude being overshadowed by less important variables of larger magnitude. After auto-scaling, the covariance matrix of X, cov(X), can be defined as:
where the superscript T denotes the matrix transpose operation. Xis consequently decomposed as the sum of the outer product of vectors ti and liplus a residual matrix E:

where a is less than or equal to the smallest dimension of X. The ti vectors (scores) contain information on how the observations relate to one another, and the li vectors (loadings) contain information on how the variables relate to one another. Various statistics exist with which to monitor/validate the PCA model. The most common of these is the Hotelling T2statistic, giving an indication as to the variation within the model, and the lack of model fit statistic, SPE.
The T2-chart is a multivariate chart based on Hotelling's T2 statistic (Hotelling, 1947). This chart is plotted based on the first a principal components (PCs) (Kourti and MacGregor, 1995), where:
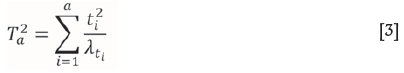
and λti( is the estimated variance of ti according to the PCA model based on historical data. Using historical data, the upper confidence limit (UCL) for the T2-chart is given by (Kourti and MacGregor, 1995):
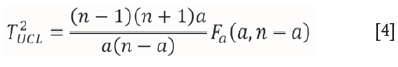
where n is the number of observations in the data-set, a is the number of PCs retained in the PCA model, and Fa(a, n -a) is the upper 100a% critical point of the F-distribution with a and n - a degrees of freedom. The T2-chart provides a test for deviations in the variables that are of greatest importance to the variance of the data-set X. It will, however, only detect whether the variation in the variables in the plane of the first a PCs are greater than what can be explained by 'common cause', as weighted by the estimated variance per score. If the variables stay within the same min-max limits as the reference data-set used to develop the PCA model, and the (internal) relationships between the variables change (i.e. cov(X) changes), the new observations will move away from the hyperplane defined by the reference PCA model. This change can be detected using a squared prediction error (SPE) chart.
The SPE chart is a multivariate chart that measures the amount of variation in each observation not captured by the a PCs retained in the PCA model. This is accomplished by calculating the SPE of the residuals of new observations (Kourti and MacGregor, 1995):
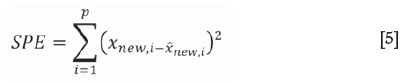
where xnewiis a PCA input, and Xnew,iis the prediction of Xnew, i from the PCA model. Using historical data, the UCL for the SPE chart is given by (Nomikos and MacGregor, 1995):
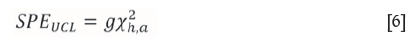
where g = υ/2μ, the weight of the weighted chi-squared distribution, and h = 2μ2/vthe degrees of freedom of the weighted chi-squared distribution, with μ the mean and ν the variance of the historical data-set, at significance level a. SPE confidence limits can be established for the residuals of the data-set X or for the residuals of the individual variables. The SPE chart indicates abnormalities resulting from when the relationship among variables or their dynamic patterns change, indicating a breakdown of the correlation among the variables due to the potential existence of an event.
Bayesian change point detection
Probability is typically used to describe the certainty that some event will occur and is expressed as a number between 0 and 1. The higher the probability of an event, the more certainty there is that the event will occur. Bayesian probability is probably the most popular version of subjective probability, using both expert knowledge and experimental data to produce probabilities. Whereas expert knowledge is represented by some prior probability distribution, expressing one's uncertainty about a quantity before the data is taken into account, the data is incorporated in a likelihood function, Bayes' theorem, a manipulation of conditional probabilities, multiplies the prior with the likelihood function, followed by normalization, to produce the posterior probability distribution, the conditional distribution of the uncertain quantity given the data.
Building on this foundation, Bayesian methods can easily be applied to detect changes in the generative parameters of time-series data. Generative models provide a way of modelling how a set of observed/evidence data could have arisen from a set of underlying causes. The most basic of these is probably a memoryless Bayesian generative change-point model containing a built-in representation of change (Anderson, 2008). For this model, over time, the state variable form a Markov chain, taking on either the value of the previous state at each iteration, if there is no change, or taking on some new value if there is a change. What makes this model memoryless is the fact that the probability of a change occurring at any time is independent of all previous changes.
For online change-point detection, Adams and MacKay (2006) cast the product partition model (Barry and Hartigan, 1992) into a Bayesian graphical model, focusing on causal predictive filtering to generate an accurate distribution of the next unseen data in the sequence, given only data already observed. The product partition model assumes that timeseries data can be separated, based on changes in the data's generative parameters, into partitions that are independent and identically distributed (IID). It is shown that, if prior to making observations the probability distribution of random partitions is in a certain product form, given the observations it is also in product form. The model therefore provides a practical way for allowing the data to weight the partitions likely to hold, this being especially relevant to change point problems where the partitions divide the sequence of observations into components within which different regimes hold. By first conditioning on a partition and then averaging over all partitions, an inference about particular future observations may subsequently be made. Finally, with suitable selection of prior product models, observations can ultimately approximate the true partition (Barry and Hartigan, 1992).
The Bayesian online change-point detection algorithm with prediction (Adams and MacKay, 2006) estimates the posterior distribution over the current run length, or time since the last change point, given the data so far observed and ensuring the algorithm gradually forgets the effect of past data (Yamanishi and Takeuchi, 2002). The run length can be interpreted as the length of time (or equivalently, the number of observations) since the last change point was observed, where the length of the current run at time j is denoted by rj and the data up to time j is denoted by x1;j. A low posterior P(rj |x1;j ) is therefore indicative of a change in the data characteristics at time j, and consequently a change in the process on which the data is measured.
Singular spectrum analysis change-point detection
Singular spectrum analysis (SSA), an extension of classical PCA, is another method than can be applied to analyse and detect a change in time series. SSA can be viewed as a linear root-mean-square fitting method where all available samples in a time window, r, of length N are processed with singular value decomposition (SVD), resulting in the final transformation being linear combinations of the samples: separating the time series into signal and noise components (Kugiumtzis and Christophersen, 1997).
In general, SSA is the application of singular value decomposition of the trajectory matrix obtained from the original time series with a subsequent reconstruction of the time series. The main concept in studying the properties of SSA is 'separability', which characterizes how well different components can be separated from each other. The SSA method makes no prior statistical assumptions about the data; it decomposes a data-set into its component parts and reconstructs the data-set by omitting the random (noise) component (Moskvina and Zhigljavsky, 2003).
For change point detection it is expected that if at a certain moment in time N + ז the mechanism generating Xj (j ≥ N + ז) has changed, the distance between the a-dimensional subspace and lagged vectors Xj for j ≥ K +ז, where K is the embedding dimension, would have increased. This assumption translates into detection of conditions resulting from increased variance of the system and, depending on the nature of the system, changes in dynamic topology may also be detected. Rather than applying SVD to the standard SSA algorithm trajectory matrix, the trajectory matrix is computed in a time interval [n = 1, n + N], not only making the algorithm sequential, but also adapting it to slow change, multiple changes, and outliers (Moskvina and Zhigljavsky, 2003). Significant structural changes in a time series will be detected for any reasonable choice of parameters. Tuning of the parameters may be required to detect small changes in noisy time series.
Event detection system
Since the effectiveness of the abovementioned techniques for event detection has previously been proven in simulation (Groenewald, 2014), the focus for this study was to determine how well they perform for furnace temperature monitoring.
Technique evaluation
Numerous temperature measurement excursions were analysed using high-frequency data sampled at a rate of one sample every 10 seconds. The examples below represent typical events to be detected. The variables for each data-set were checked to see whether or not the data met the typical assumptions required by the techniques being reviewed: data being (1) independent and identically distributed (IID) and (2) having a normal distribution. Although inspection of the furnace temperature measurement data indicated the variables not to be IID, and not normally distributed, it has been shown that the proposed techniques are all exceptionally robust when analysing data that does not meet the assumptions regarding required data characteristics (Groenewald, 2014).
The first example is a significant short-term excursion (an immediate furnace run-out that occurred at the same time as the temperature measurement excursion) of one of the temperature measurements on a matte tap-block (excursion and run-out at sample index 422 as shown in Figure 1). While all of the proposed techniques managed to detect the excursion with some reliability, differences were noted in the detection-delay and false alarm rates of the techniques. The Bayesian-based technique was by far the quickest in detecting the excursion, closely followed by the PCA-based technique, with the SSA-based technique being significantly slower compared to the other techniques. With regards to false alarms, neither the PCA-based nor SSA-based techniques reported any false alarms, whereas the Bayesian-based technique reported a single false alarm prior to the excursion.
The second example is a short-term drift excursion (a delayed furnace run-out that occurred at some time after the temperature measurement excursion) of one of the temperature measurements on a copper cooler (excursion at sample index 443 and run-out at sample index 1550 as shown in Figure 2). In this instance, only the PCA-based technique was reliable in detecting the short-term drift excursion, with the Bayesian-based and SSA-based techniques detecting only the eventual run-out condition. As before, the Bayesian-based technique reported a few low-probability alarms, with the SSA-based technique being significantly slower in confirming the existence of an event compared to the other techniques.
From the analysis of these examples and numerous other temperature measurement excursions it is evident that the PCA-based fault detection approach is the most appropriate for detecting events in furnace temperature measurements, providing the optimal balance between reliability, detection-delay, and false alarm rate. Furthermore, both the Bayesian-based and SSA-based change point detection techniques are significantly more computationally intensive and memory-hungry compared to the PCA-based fault detection approach, making them less suited for online application.
Proposed system
Following the technique evaluation, a short-term spike detection system (based on current operating data using a relatively short period of historical data) and long-term trend detection system (based on normal operating condition data using a relatively long period of historical data) were developed based on the PCA-based fault detection approach. Some key considerations of the proposed event detection system include:
► Multiple, independent models based on the logical grouping of furnace temperature measurements according to spatial location improves the model accuracy and troubleshooting capability
► Monitoring of changes in furnace temperature measurements relative to inlet cooling water temperatures eliminates the identification of increases in furnace temperature measurements due merely to increases in inlet cooling water temperatures
► Sampling data at 10-second intervals allows for high-resolution monitoring
► Detuning the monitoring statistics decreases the false alarm rate of the system
► Confirming that potential events are indeed related to higher furnace temperature measurements improves buy-in from operational personnel
► Notifying of only persisting events reduces the frequency of event notifications.
System evaluation
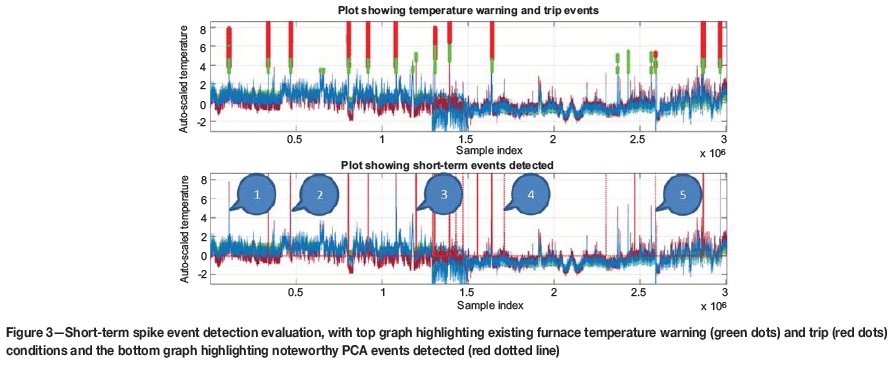
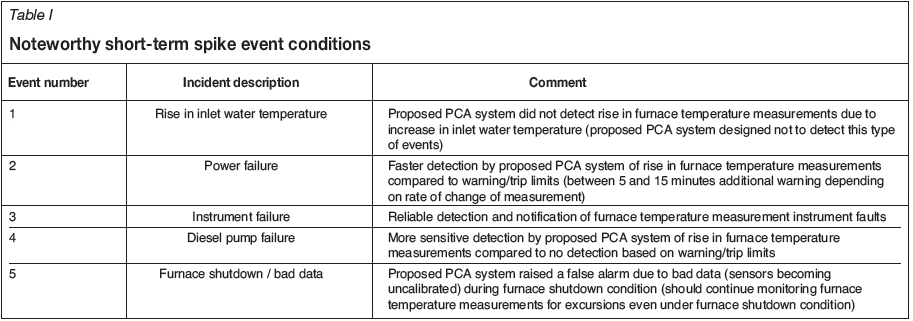
For the short-term spike event detection evaluation, furnace temperature measurement data from a matte tap-block covering a period of 12 months was considered (Figure 3). The data-set contains a variety of fault conditions, some of which were flagged by the operating warning and/or trip limits, while others were missed. As with the data-sets used for the technique evaluation, inspection of the data indicated that the variables were not IID, and not normally distributed, making them theoretically less suitable for analysis using PCA. However, evaluation of the proposed PCA-based event detection system again proved the robustness of the PCA technique through the reliable identification of various furnace temperature event conditions. Table I lists noteworthy short-term spike event conditions (numbered items correspond to highlighted events in Figure 3).
For the long-term trend event detection evaluation, furnace temperature measurement data from a few furnace temperature measurement groupings covering a period of approximately 6 months was considered (Figure 4). The data-set contains temperature measurements showing a distinct upward trend after a shutdown at approximately sample index 450 000, none of which were flagged by the standard operating warning and/or trip limits (as defined by the original equipment manufacturer), with a confirmed runout at approximately sample index 585 000. As with the data-sets used for the technique evaluation, inspection of the data indicated that the variables were not IID, and also not normally distributed. Despite this, the long-term trend event detection system was able to reliably detect the upward trend in the furnace temperature measurements for all three groupings. For the matte lower waffle coolers grouping, advance warning of rising furnace temperature measurements was given approximately 13 days prior to the run-out. The flanker L1 coolers and flanker L2 coolers groupings both gave approximately 6 days' advance warning. The PCA-based long-term trend event detection system was found to be sufficiently sensitive to reliably detect long-term upward trends in furnace temperature measurements.
From the above system evaluation it is evident that the proposed event detection system was able to reliably detect both short-term spike events and long-term trend events. It is important to note that although not all detected events resulted in run-outs, they are all associated with some specific abnormal conditions existing in, or relating to, the furnace operation at that point in time and should always be investigated as a matter of urgency on an operating site.
Online implementation
The online implementation of the event detection system was split into two stages. Stage one was the model generation stage, whereby short-term spike event models were generated daily and long-term trend event models were generated once-off using MATLAB. Stage two, executed using OSIsoft PI ACE (Advanced Computing Engine), consisted of evaluating new temperature measurement data against the event detection thresholds and sending SMS and e-mail notifications upon event conditions to the operator and selected production staff.
Configuration data for the system is maintained in an OSIsoft PI AF (Asset Framework) database, with temperature measurement data being collected from an OSIsoft PI Data Archive Server. To ensure system reliability, the system is monitored for errors related to failed calculations, outdated event detection model files, and notification failures.
Online implementation of the system resulted in more sensitive furnace integrity monitoring. Information from the system was also used to support a decision to safely delay a furnace matte endwall rebuild, as will be demonstrated below.
Case study: Polokwane Smelter endwall monitoring
The Polokwane Smelter operates a nominally-rated 68 MW six-in-line electric furnace located on the eastern limb of the Bushveld Complex. The walls of the furnace crucible are made up of water-cooled copper coolers. The northern side of the furnace is utilized for matte tapping and the southern side for slag tapping. The matte and slag tapping systems each have three tap-holes. The matte tapping holes consist of a water-cooled copper matte tap-block, a bullnose, and two faceplates in which refractories are placed, and through which matte is tapped. The tap-hole region is also surrounded by additional water-cooled copper cooling elements (Nelson and Hundermark, 2016).
Event detection was first employed in this area at the start of 2016 as, historically, this was the area where monitoring is of greatest concern (Hundermark et al., 2014). This is due to the fact that PGM matte has higher superheats (300 to 650°C) compared to most other types of matte processes such as nickel mattes (100 to 520°C) (Shaw et al., 2012; Nolet, 2014). Historical campaign life for the matte endwall was as short as 9 months, progressively extended over time. Due to the increase in campaign life, in order to safely complete this campaign, the use of advanced event detection was crucial. In the months leading up to the endwall repair, meetings were held on a fortnightly basis to evaluate and review the matte endwall integrity, guided by event detection. The absence of PCA events on the endwall leading up to and during this time indicated that the matte endwall was still in an acceptable condition, thus allowing for a record campaign life without incident.
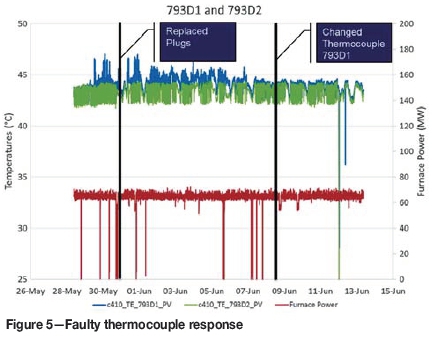
Any PCA events that were noted were thoroughly investigated. An example of this was the instantaneous detection of a faulty thermocouple through visual inspection of the data following an event notification, as shown in Figure 5. The thermocouple in question was raised as a PCA event and before the variations could result in a furnace trip, the plugs were changed. The thermocouple was replaced during the subsequent brick repair. This is indicative of preventative maintenance which allowed for the reduction of nuisance trips with an improvement in furnace stability.
During the latest endwall repair, upon inspection of the matte endwall refractories up to 80% of the refractory brick on the endwall was found remaining. This was following a campaign that was 23% longer, with 47% more concentrate smelted and 70% more matte tapped, than in the previous best campaign. Through the adoption of PCA event detection, it is anticipated that the matte endwall campaign life can be extended even further.
Following the use of PCA event detection on the matte endwall, the system was rolled out to the east, west, and south walls, as well as the hearth thermocouples. The inclusion of the hearth thermocouples in the event detection system serves to determine any major variation in the condition of the hearth refractory, since the wearing and condition of this refractory may assist in the planning of a furnace rebuild.
In terms of further technology development, event detection was also utilized with the newly-installed fibre optic technology, which would enable spatial monitoring of the tap-hole. Fibre optic technology has significantly increased the amount of sensors compared to the standard instrumentation on the tap-block (Hopf and Rossouw, 2006; Gerritsen et al., 2009; Hopf, 2014; Braun et al, 2014; MacRosty, Gerritsen, and Pula., 2014; Ying et al., 2015; Sadri et al., 2016). It was therefore beneficial to use PCA on the fibre optic temperature data. This proved fruitful in that the analysis of fibre optic temperature data in one instance gave indications of a PCA event that was not detected by the conventional thermocouples, which may indicate a variation in the freeze lining or tapping (Figure 6). However, it should be equally noted that in another instance, the conventional temperature monitoring identified an event that was not identified through PCA analysis of fibre optic temperature data. A possible reason for this could be that the fibre optic temperature data at that point reflected the temperature over a specific sensor length, rather than at a specific point as with the conventional thermocouple monitoring.
The benefits of event detection at the Polokwane Smelter are notable, thus it has become standard practice to use the event detection system to investigate and ameliorate any possible process upsets in both the short and the long-term.
Practical considerations
Following the widespread online implementation of the furnace temperature measurement PCA event detection system, various practical issues needed consideration. Listed below are some of the items that needed to be taken into account.
► The event detection system needs to remain active when a furnace is in idle mode as abnormal events can still occur
► The event detection system needs to remain active when a furnace is being started up, which is currently accomplished by updating the short-term spike event detection models more regularly. This is especially important after long shutdowns following rebuilds, when conditions are inherently more abnormal and where there is a greater than normal likelihood of temperature excursions
► When updating either the short-term spike or longterm trend event detection models, the temperature measurement data of previously identified short-term spike events needs to be removed from the model training data-set. This is done so as to ensure that the model contains only normal operating condition data
► When all temperature measurements associated with a specific event detection model are flagged as being potential events, the data related to the event is considered to be a shift in the process operating conditions and is thus not removed from the short-term spike event detection model training data. This is done
in order to counter the rule whereby short-term spike events are removed from the model training data-set when potential shifts in operating conditions occur
► All normal operating condition data must be included in the model training data-set for the short-term spike event detection models. Due to the non-continuous operating nature of some of the furnaces and/or tap-blocks being monitored, it is necessary to increase the time range used in determining the extent of the normal operating condition data for some of the shortterm spike event detection models
► A mechanism for repeat notification had to be implemented to ensure persistent events received the necessary attention
► An event persistence tuning parameter was introduced as a mechanism to manage the trade-off between speed of notification and number of nuisance notifications.
Conclusions
Compared to Bayesian-based and SSA-based change point detection techniques, PCA-based fault detection for furnace temperature monitoring was found to be the most suited for online application, providing an optimal balance between reliability, detection delay, and false alarm rate. Furthermore, developing separate short-term spike detection and long-term trend detection models allowed for the reliable detection of both temperature spike and temperature drift events without compromising the detection sensitivity of either model. The online implementation of the furnace event detection system on all of the Anglo American Platinum furnaces has resulted in more sensitive furnace integrity monitoring, allowing for the detection of smaller events, the earlier detection of larger events, and improved visibility of detected events.
Acknowledgements
Permission by Anglo American Platinum Ltd. to publish, contributions by all those who assisted in the design of this system, and Warren Armstrong for the online implementation of the system, are gratefully acknowledged.
References
Adams, R.P. and MacKay, D.J.C. 2006. Bayesian online changepoint detection. Cavendish Laboratory, University of Cambridge. https://arxiv.org/pdf/0710.3742.pdf [accessed 25 April 2017]. [ Links ]
Anderson, K.C. 2008. A novel approach to Bayesian online change point detection. Department of Computer Science, University of Colorado Boulder. http://www.cs.colorado.edu/department/publications/theses/docs/bs/ kelsey_anderson.pdf [accessed March 28, 2018]. [ Links ]
Barry, D. and Hartigan, J.A. 1992. Product partition models for change point problems. Annals of Statistics, vol. 20, no. 1. pp. 260-279. [ Links ]
Braun, W., Gebski, P., MacRosty, R., Pula, R., Sadri, A., and Ying, W.L. 2014. Tap-hole monitoring technologies. Proceedings of the Furnace Tapping Conference 2014. Southern Africa Institute of Mining and Metallurgy, Johannesburg. pp. 169-182. [ Links ]
Conover, W.J. 1980. Practical Nonparametric Statistics. Wiley, Hoboken, NJ. [ Links ]
Gerritsen, T. and Gunnewiek, A.H. 2011. Diagnostic system and method for metallurgical reactor cooling elements. US patent 7976770. [ Links ]
Gerritsen, T., Shadlyn, P., MacRosty, R., Zhang, J., and van Beek, B. 2009. Tapblock fibre-optic temperature system. Proceedings of Pyrometallurgy of Nickel and Cobalt 2009, Sudbury, oN, 23-26 August 2009. The Metallurgical Society of CIM, Montreal. pp 627-639. [ Links ]
Groenewald, J.W.D. 2014. A process performance monitoring methodology for mineral processing plants. PhD thesis, University of Stellenbosch. [ Links ]
Gunnewiek, L., Suer, J., Macrosty, R., Gerritsen, T., and Karges, A. 2008. Developing a tapblock diagnostic system. Proceedings of the Third International Platinum Conference, 'Platinum in Transformation', Sun City, South Africa, 5-9 october 2008. Southern African Institute of Mining and Metallurgy, Johannesburg. pp. 203-210. [ Links ]
Hopf, M. 2014. Monitoring the wear of water-cooled tap-hole blocks by the oPTISAVE fibre-optic method. Proceedings of the Furnace Tapping Conference 2014. Southern Africa Institute of Mining and Metallurgy, Johannesburg. pp. 33-49. [ Links ]
Hopf, M. and Rossouw, E. 2006. New opportunities - exhaustive monitored copper coolers for submerged arc furnaces. Proceedings of Southern African Pyrometallurgy 2006. Jones, R.T. (ed.). Southern African Institute of Mining and Metallurgy, Johannesburg. pp. 89-100. [ Links ]
Hotelling, H. 1947. Multivariate quality control illustrated by the testing of sample bombsights. Selected Techniques of Statistical Analysis. Eisenhart, O. (ed.). Mcgraw-Hill, New York. pp. 113-184. [ Links ]
Hundermark, R., Nelson, L., De Villiers, B., Ndlovu, J., Mokwena, D., Mukumbe, P., Pieterse, B., Seyanund, W., and van Manen, P. 2014. Redoubling platinum group metal smelting intensity - operational challenges and solutions. Celebrating the Megascale: Proceedings of the Extraction and Processing Division Symposium on Pyrometallurgy. Mackey P.J., Grimsey E.J., Jones R.T., and Brooks G.A. (eds.). The Minerals, Metals & Materials Society. pp. 189-196. [ Links ]
King, M.G. 2007. The evolution of technology for extractive metallurgy over the last 50 years - is the best yet to come? Journal of the Minerals, Metals, and Materials Society, vol. 59, no. 2. pp. 21-27. [ Links ]
Kourti, T. and MacGregor, J.F. 1995. Process analysis, monitoring and diagnosis, using multivariate projection methods. Chemometrics and Intelligent Laboratory Systems, vol. 28. pp. 3-21. [ Links ]
Kugiumtzis, D. and Christophersen, N. 1997. State space reconstruction: method of delays vs. singular spectrum approach. Department of Informatics, University of Oslo. http://ftp.project.ifi.uio.no/publications/research-reports/DKugiumtzis-1.pdf [accessed 25 April 2017]. [ Links ]
MacRosty, R., Gerritsen, T., and Pula, R. 2014. Evaluation of fibre optic temperature sensor data for the prediction of tapblock condition. COM 2014. Proceedings of the Conference of Metallurgists. Canadian Institute of Mining, Metallurgy and Petroleum, Montreal. [ Links ]
Moskvina, V. and Zhigljavsky, A. 2003. An algorithm based on singular spectrum analysis for change-point detection. Communication in Statistics, vol. 32, no. 2. pp. 319-352. [ Links ]
Nelson, P., Hyde, A., McEwan, M., and Sandoz, D. 2007. Integrity monitoring of Xstrata Copper's Kidd Metallurgical Division Mitsubishi 3-line furnaces using multivariate methods. Proceedings of the 6th Copper Conference -Cu2007: Vol. VII Process Control, Optimization, & Six Sigma. The Metallurgy and Materials Society, Toronto. pp. 229-239. [ Links ]
Nelson, L.R and Hundermark, R.J. 2016. The tap-hole - key to furnace performance. Journal of the Southern African Institute of Mining and Metallurgy, vol. 116. pp. 465-490. [ Links ]
Nolet, I. 2014. Tapping of PGM-Ni mattes: and industry survey. Proceedings of the Furnace Tapping Conference 2014. Southern Africa Institute of Mining and Metallurgy, Johannesburg. pp. 223-232. [ Links ]
Plikas, T., Gunnewiek, L., Gerritsen, T., Brothers, M., and Karges, A. 2005. The predictive control of furnace tapblock operation using CFD and PCA modeling. Journal of the Minerals, Metals, and Materials Society, vol. 57, no. 10. pp. 37-43. [ Links ]
Sadri, A., Ying, W.L., Erskine, J., and MacRosty, R. 2016. Smelting furnace non-destructive testing (NDT) and monitoring. Proceedings of the 19th World Conference on Nondestructive Testing2016, Munich, 13-17 June. NDT.net/Curran Associates. pp. 1-12. [ Links ]
Shaw, A., de Villiers, L.P.vS., Hundermark, R.J., Ndlovu, J., Nelson, L.R., Pieterse, B., Sullivan, R., Voermann, N., Walker, C., Stober, F., and McKenzie, A. 2012. Challenge and solutions in PGM furnace operation: high matte temperature and copper cooler corrosion. Proceedings of the Fifth International Platinum Conference, 'A Catalystfor Change', Sun City, South Africa, 17-21 September 2012. Southern African Institute of Mining and Metallurgy, Johannesburg. pp. 193-216. [ Links ]
Thwaites, P.E., Sandoz, D.J., Nelson, P.R.C., McEwan, M., Norberg, P., Kak, D., and Gillis, J.D. 2013. System and method for furnace monitoring and control. Canadian patent 2469975. [ Links ]
Venkatasubramanian, V., Rengaswamy, R., Kavuri, S.N., and Yin, K. 2003. A review of process fault detection and diagnosis: Part III: Process history based methods. Computers and Chemical Engineering, vo. 27. pp. 327-346. [ Links ]
Wise, B.M. and Gallagher, N.B. 1996. The process chemometrics approach to process monitoring and fault detection. Journal of Process Control, vol. 6, no. 6. pp. 329-348. [ Links ]
Yamanishi, K. and Takeuchi, J. 2002. A unifying framework for detecting outliers and change points from non-stationary time series data. Proceedings of the 8th ACM SIGKDD International Conference on Knowledge Discovery and Data Mining, Canada, 23-26 July 2002. Association for Computing Machinery, New York. pp. 676-681. [ Links ]
Ying, W.L, MacRosty, R., Gebski, P., Pula, R., Sadri, A., and Gerritsen, T. 2015. Managing furnace integrity by utilizing non-destructive testing (NDT) and monitoring techniques. Proceedings of the Conference of Metallurgists 2015, Toronto. Canadian Institute of Mining, Metallurgy and Petroleum, Montreal. pp. 1-13. [ Links ] ♦
This paper was first presented at the 7th International Platinum Conference 2017 'Platinum-A Changing Industry' In Association with AMI Precious Metals 2017, 18-19 October 2017, Protea Hotel Ranch Resort, Polokwane, South Africa.

