


Services on Demand
Article
 English (pdf)
 Article in xml format
 Article references
Indicators

Related links
-
 Cited by Google
 -
 Similars in Google
Share

 Permalink
Journal of the Southern African Institute of Mining and Metallurgy
On-line version ISSN 2411-9717
Print version ISSN 2225-6253
J. S. Afr. Inst. Min. Metall. vol.118 n.4 Johannesburg Apr. 2018
http://dx.doi.org/10.17159/2411-9717/2018/v118n4a2
PLATINUM CONFERENCE 2017
Analysis and interpretation of fibre optic temperature data at the Polokwane Smelter
R.L. Sakaran; Q. van Rooyen; P.K. van Manen; P.P. Mukumbe
Anglo American Platinum Ltd, Johannesburg, South Africa
SYNOPSIS
To help improve the monitoring of the matte tap-holes on the matte endwall to prevent failures, fibre optic temperature systems were installed on the six-in-line electric furnace at the Polokwane Smelter. This was done with the intent to provide more detailed and timely detection regarding the change in condition of the copper coolers, refractory materials, and associated freeze-lining components at the hot face of the matte endwall and copper coolers. Fibre optics were selected to provide a significantly higher number of sensors and greater spatial coverage across the tap-block compared to conventional temperature measuring systems. Two types of fibre optic technology were installed; type A utilizing Bragg gratings and type B utilizing Raman spectroscopy. Each of these technologies were installed in different tap-holes and compared to the conventional thermocouples and resistance temperature detectors (RTDs) already installed. The characterization of the temperature responses was generated from tapping in terms of magnitude, rates of change, and action of specific events such as drilling, lancing, and tap-hole clay closing. The benefits and limitations of the various systems in place, the analyses done, and the way forward are described.
Keywords: tap-hole, temperature monitoring, fibre optics, Bragg grating, Raman spectroscopy.
Introduction
The Polokwane Smelter operates a single six-in-line electric furnace, nominally rated at 68 MW. The smelter treats mainly Platreef, and UG2 concentrates from the eastern and northern limbs of the Bushveld Complex and smelts them to form slag, matte, and gas phases. The furnace operates with three matte tap-holes on the northern wall of the furnace and matte is tapped periodically from the furnace, with each tap being 25 to 35 minutes in duration. Two tap-holes are utilized per day, with one resting. A tap-hole is not utilized for more than two days in succession to ensure that it is not over-utilized and also to allow for any tapping channel refractory preventative maintenance.
The matte tap-holes consist of copper cooling elements within which are refractories that contain the tapping channel. The hot face of the water-cooled copper tap-block is separated from the molten material by refractories. It is within, or on the surface of, the copper tap-blocks that the fibre optic technology was embedded. Due to the higher superheats of PGM matte compared to most other types of matte (Shaw et al., 2012; Nolet, 2014), the matte tap-holes are subjected to extreme process conditions which may render the furnace prone to failures. The wearing of these refractories introduces the risk of explosions should any matte come into contact with the copper block and then the cooling water channel.
Fibre optic technology was installed strategically at the hot face and within the water-cooled copper tap-blocks and key water-cooled copper coolers, with the intent to provide a more detailed and timely detection of temperature rises in the copper, refractory, and associated freeze-lining components on the hot face of the matte endwall, copper coolers, and the tap-block. Prior to the introduction of fibre optic technology, the methods of endwall condition monitoring were limited to the measurement of copper temperatures of the tap-block and cooper coolers by thermocouples installed at specific points, and the use of resistance temperature detectors (RTDs) that measure the change in cooling water temperature. The selection of fibre optics was made to provide a significantly higher density of sensors with an enhanced spatial resolution in comparison to the single conventional temperature measurements.
Two types of fibre optic technology were installed in different copper tap-blocks and coolers, namely type A technology utilizing Bragg gratings and type B utilizing the Raman effect. The Bragg gratings reflect a wavelength of light that shifts in response to variations in temperature or strain, thus allowing for any change in temperature of a furnace tap-block to be characterized. The Raman effect refers to the backscattering of photons. The intensity of the scattering is related to temperature, therefore a change in intensity would indicate a change of temperature.
Analysis of this data allowed temperature responses related to tapping events to be characterized. The focus of this paper will be the analysis of the different temperature responses obtained from the different fibre optic technologies. These responses were compared to that of the conventional thermocouples and RTDs already installed, as well as to the tapping temperature response from other sites as described in the literature.
Theory of fibre optic technology
Major industrial uses of fibre optic technology were first developed in the late 1980s. This technology utilizes light and the different properties associated with its wavelength when scattered or reflected. The two types of fibre optic systems that were used at Polokwane Smelter were Bragg gratings (type A) and the Raman effect (type B) (Hopf, 2014; MacRosty, Gerritsen, and Pula, 2014; Othonos et al., 2006)
Fibre Bragg gratings are patterns impressed on cables during manufacturing and reflect a specific wavelength which varies as the temperature changes. Temperature resolutions are approximately 0.05 K, with an absolute accuracy of 0.2 K (Hopf, 2014). The Raman effect relies on the wavelength of backscattered light not being identical to that of the input light. The wavelength of the scattered light is related to temperature and this relationship determines locality. Temperature resolutions are approximately 0.1 K, with an absolute accuracy of 0.5 K (Hopf, 2014). A key difference in the fibre optic technologies is that the Bragg grating spacings can be inscribed at a higher density. The conventional method of temperature measurement of the tap-block is by type K thermocouples in thermowell holes in the copper coolers. Temperature resolutions are approximately 1.1 K, with an absolute accuracy of 2.2 K (REOTEMP Instrument Corporation, 2011).
Previous studies were completed on the use of fibre optic technology at the Lonmin Platinum smelter, Sudbury Integrated Nickels Operations, and Portovesme smelter (Gerritsen et al., 2009; MacRosty, Gerritsen, and Pula, 2014; Cameron, Sriram, R., and Ham, 1995). The temperature responses obtained from these sites will be compared to those obtained from this study.
Fibre optic temperature data analyses
Methodology
Initial installations of fibre optic technology at the Polokwane Smelter were based on systems that were mounted onto the surface of the hot face of the respective tap-block. Although it provided a temperature response during a tapping event, over time the system was subject to severe corrosion, resulting in erratic readings. Cast-in fibre optic technology was then selected to provide a temperature response. This had the effect of minimizing the impact of corrosion on the temperature responses; however, it would also result in a loss of sensitivity compared to the surface-mounted fibre optics (Hopf, 2014).
Raw temperature data from the fibre optic sensors was sourced from the points shown in Figure 1.
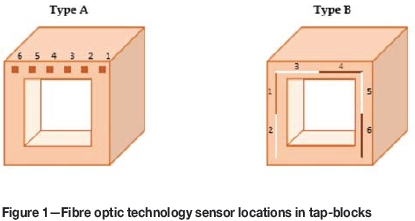
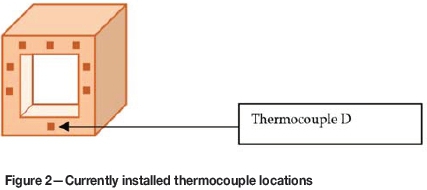
All sensors were characterized, and the choice of sensors that were used for the study was based on which sensors gave the greatest (most sensitive) response. By comparing the different temperature responses from the different sensors, comparisons could be drawn with regard to the magnitude of the response. Point 3 in the Type A technology and point 4 in Type B technology (see Figure 1) were chosen. Both of these sensors are located in similar areas of their respective tap-blocks. Upon the removal of the tap-blocks during the latest endwall repair, this area of response was indicative of the direction of greater wear within the tapping channel. The tap-block was approximately 1 m χ 1 m in width and length, with a depth of approximately 0.5 m. The 'D' thermocouple in the already installed conventional system was chosen to serve as a comparison to the fibre optic technology, as this was found to be the most responsive thermocouple. The locations of the thermocouples relative to the hot face of the tap-block are shown in Figure 2.
The data from all the systems was analysed with an interval of 10 seconds and the data-sets were corrected for any effects of the variation in supplied cooling water temperature using Equation [1]:

In order to effectively understand a tapping response, the start and end of a tap are required to be determined accurately (Nelson, 2016). This was achieved through inference with the use of pyrometers directed at the matte tap-holes to measure matte temperature. The initial rise in the matte temperature is indicative of the start of a tapping event and the subsequent drop represents the tap-hole closure.
Fibre optic temperature responses
The thermal responses of the two types of fibre optic technology are described and compared to the current monitoring methods in terms of:
► Delays in the response from the tapping start time
► Rise rates/shape
► Time interval
► Decay rates/shape
► Any other anomalies.
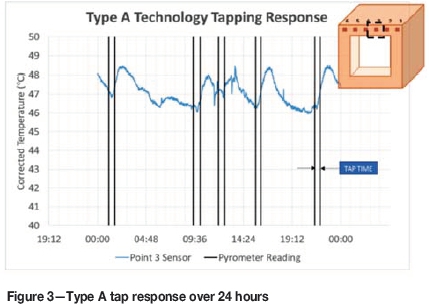
In order to achieve a matte tap, a sequence of events must be followed (Nelson, 2014). Prior to each tapping event the tapping channel is drilled to a predetermined depth, after which an oxygen lance is utilized to open the tap-hole. Upon tap completion, the tap-hole is closed by a mudgun utilizing a resin-pitch bonded clay. The vertical black lines in Figure 3 are used to depict the start and end of a tap through the inference of matte temperatures. Typically, at the Polokwane Smelter, after a hole has been tapped, it is rested for a period before being tapped on again due to the alternating arrangement of tapping whereby one tap-hole is not tapped consecutively. The data was analysed statistically by calculating the coefficient of variation of the data across the period of the campaign to determine if the sensitivities of the fibre optic technologies differed. The sampling rate for all the data was at 1 minute intervals.
Type A responses - fibre Bragg gratings
The type A technology was installed in the west matte tap-hole of the northern wall. Figure 3 represents the temperature response, over a 24-hour period, of sensor 3 on the hot face of the tap-block equipped with Type A technology. Similar types of responses are experienced over the time period, with similar profiles and temperature rises with a 2°C range.
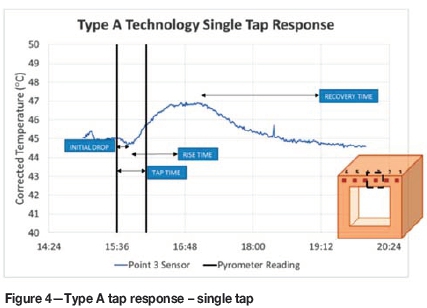
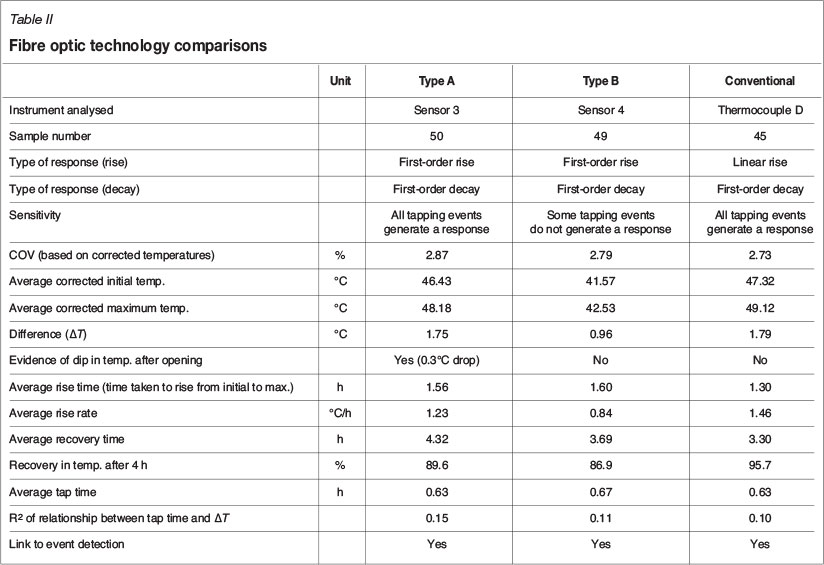
Figure 4 shows a temperature response for a single tap for the type A technology. The response is fairly smooth. At the start of the tap, the temperature decreases. This initial drop is seen as characteristic throughout the tapping events of the campaign. Thereafter the temperature begins to rise during the tap and continues to do so after the tap-hole has been closed, with a first-order response in the temperature with respect to time. MacRosty, Gerritsen, and Pula (2014) postulate that this occurs as a result of thermal inertia due to the thermal conductivity and the heat capacity of the refractory at the hot face of the tap-block. The temperature reaches a peak after an average of 1.56 hours and begins to level off (plateau), after which it begins to drop, typically in a first-order decay. This continues until the temperature essentially reaches the pre-tapping temperature approximately 4.32 hours after the peak temperature was reached. Averages are based on 50 taps.
Type Β Responses - Raman Effect
The type B technology was installed in the east matte tap-hole of the northern wall. Figure 5 represents the temperature response, over a 24-hour period, of sensor 4 on the hot face of the tap-block with type B technology. There does not appear to be a similarity between the responses due to the noise present in the data. This is in a range of approximately 2°C with the noise.
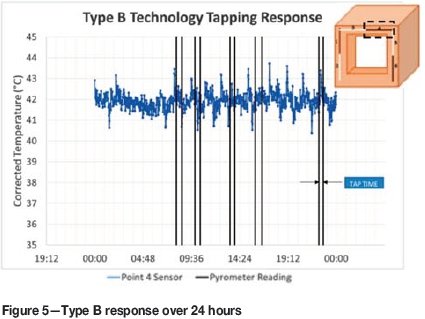
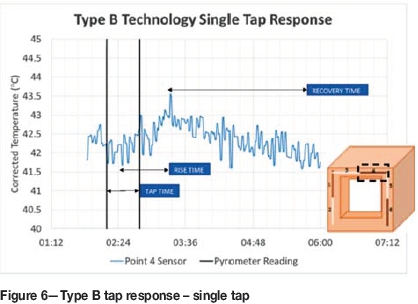
Figure 6 shows a temperature response to a single tap for the type B technology. The response is fairly noisy. At the start of the tap, the temperature does not appear to be decreasing as clearly as for type A. This also may be difficult to visualize if it does occur, due to the noise. Thereafter the temperature begins to rise during the tap and continues to do so after the tap-hole has been closed, in what appears to be first-order with respect to time, but is difficult to quantify due to the noise. The temperature then reaches a peak after a similar average of 1.6 hours. There is no evidence of a plateau-type behaviour after the peak temperature is reached, after which the temperature begins to drop in a roughly first-order decay. This continues until the temperature again reaches the initial temperature of tapping, on average, 3.69 hours after the peak temperature was reached. Averages are based on 49 taps.
Conventional thermocouple responses
The conventional system was installed in all matte tap-holes of the northern wall. Figure 7 represents the temperature response of sensor 4 on the hot face of the tap-block. In this case, the response of the east matte tap-block was used. A similar type of response was noted for each tap; however, the range of the data was limited to approximately 1°C for a tap upon normal tapping conditions.
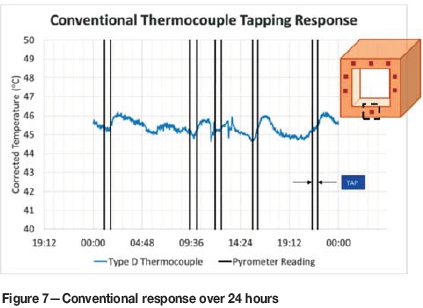
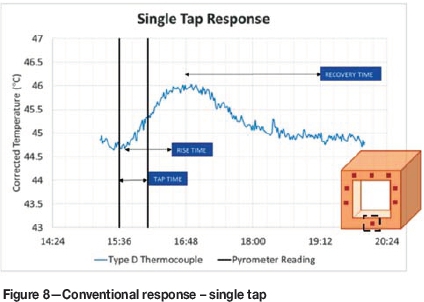
Figure 8 shows a temperature response to a single tap for the conventional thermocouples. The response is fairly smooth and the shape is more similar to that of the type A technology than that of type B. At the start of the tap, however, the temperature does not appear to be decreasing as obviously as that measured by type A. Furthermore, instead of rising during the tap only, the temperature may start rising from the beginning of the tap (as seen in Figure 8), indicating that this thermocouple may not be detecting the postulated effect of thermal inertia. The temperature rises in a fairly linear fashion and reaches a peak after an average of 1.3 hours (significantly, almost 20% shorter than the times measured by both of the fibre optic technologies). The temperature thereafter drops in an essentially first-order decay. This continues until the initial temperature of tapping is reached, on average, 3.30 hours after the peak temperature (also shorter than for both the fibre optic systems). Averages quoted are based on 45 taps.
Successive tapping responses
Successive taps in this paper are defined as those taps that are initiated before the temperature of the tap-block recovers from the preceding tap. At Polokwane Smelter, these scenarios are rare due to the alternate tapping regime.
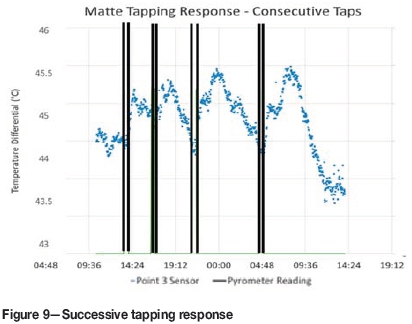
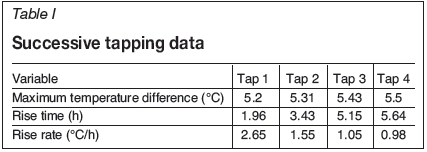
For the successive taps, a typical response from the type A technology is shown in Figure 9. There are a few points to note from this tapping pattern. The difference between the initial and final temperatures begins to increase (depicted in Table I) as the number of taps increases. Based on the measured temperatures, there does not appear to be evidence of thermal equilibrium being reached within the tapping channel. It is postulated that should more taps occur in succession, there may be a point at which the temperature will begin to plateau.
Statistical analyses of fibre optic data
The fibre optic data was analysed statistically to determine the sensitivity of the temperature responses through the use of the coefficient of variation (COV):
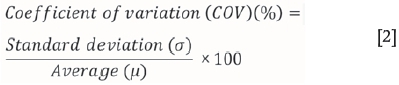
This was applied to the data from all the sensors for each of the fibre optic technologies (Figures 10 and 11).
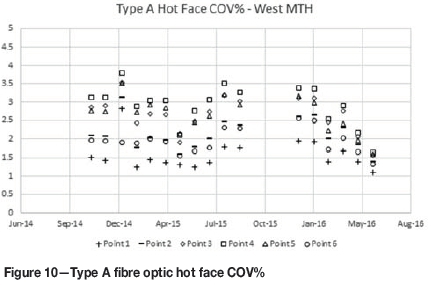
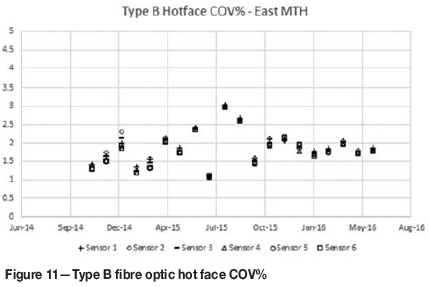
The two data-sets presented indicate different responses with regard to the spread of the data. The COV for the different type A technology sensors at the hot face is more spread, indicating different spreads for different locations in the tap-block. This spread is not noted, however, with the
type B technology, where all the sensors give almost identical spreads. A comparison of all of the technologies with all the various factors taken into account is given in Table II. The implications of this are two-fold:
► Initially, it appears that the type A sensor was potentially more sensitive than the type B sensor
► The decrease in the COV% in the type A technology may indicate a loss in sensitivity with time.
Comparison with other tapping systems
The thermal response for a single tap from the Lonmin Platinum smelter is described in Figure 12 (Gerritsen et al., 2009). The response is similar to that of the Polokwane systems (both conventional and fibre optic) in terms of shape. Furthermore, this system is similar to the type A fibre optic technology, where there is a dip in temperature after the opening of the tap-hole. The 'bump' increase in temperature reported after the closing of the tap-hole is not evident in the temperature trends for any of the Polokwane technologies, while the temperature rise at Polokwane occurs during tapping as opposed to at Lonmin, where the temperature rises after the closure of the tap-hole.
The successive tapping at the Lonmin operation represents a similar trend to that of Polokwane in the continuous increase in peak temperature for the subsequent successive taps. The maximum 'steady-state' temperature as seen in some operations (to follow) was not noticeably visible. A difference is noted in the range of temperatures.
The range of temperatures, as depicted in Figure 12, can reach 5°C, in comparison to Polokwane (shown in Figure 3) where the maximum range in the fibre optics is approximately 2°C.
Falconbridge smelter (now Sudbury INO)
The Falconbridge smelter in Sudbury sought to characterize the heat loads applied to a tap-block and the attached faceplate during tapping (Cameron, Sriram, and Ham, 1995). Due to the temperature and superheat of the matte flowing through the tap-block being the driving force of the heat load, the heat load reported is somewhat analogous to the temperature reported from the current Polokwane monitoring systems. The patterns noted are similar to the Polokwane operation, with a sensitive response to tapping. Further indications of increasing heat load (and therefore temperature) upon successive tapping are also noted.
Sudbury Integrated Nickel Operations
The temperature responses from the Polokwane fibre optic systems are very similar to that of a single tap at the Sudbury Integrated Nickel Operations (INO) in Canada, as shown in Figure 13 and described by MacRosty, Gerritsen, and Pula (2014). This is despite the fact that the tapping time at Polokwane (approximately 30 minutes) is much longer than that at Sudbury (approximately 5 minutes). The main difference between the fibre optic responses at Polokwane and Sudbury INO is that the initial temperature rise at Polokwane occurred during the tap, whereas at Sudbury this rise is noted as soon as the tap has begun. Although the time for tapping is shorter at Sudbury INO, a similar recovery time is required for the system to return to its initial temperature. Various factors may play a role in this, such as the specific matte superheat, thermal diffusivity properties, tapping mass and volume, as well as the tap-hole design.
It is worth noting that a single, isolated tap is not standard practice at Sudbury INO, with furnace tapping occurring successively in a series of 8 to 12 taps. In contrast, successive tapping at Polokwane is not standard practice, due to the adoption of alternate tap-hole practices. A 'steady-state' temperature plateau appears to be reached after a number of successive taps and is attributed to the point of thermal equilibrium where the energy supplied by the molten material is equal to the energy removed by the cooling water flow. This is different from the instances of successive tapping investigated at Polokwane, where a plateau was not reached and thus a 'steady-state' temperature could not be quantified. Sudbury INO experiences the greatest range of temperatures of all other operations, with a temperature range of 14°C for a single tap as depicted in Figure 13.
Portovesme smelter
The thermal response for a single tap in the Portovesme smelter in Italy is depicted in Figure 14, as described in MacRosty, Gerritsen, and Pula (2014). The tapping time for this site is comparable to that at Polokwane and the tapping response occurs with a first-order rise upon the opening of a tap-hole. A steady-state temperature plateau thereafter develops during the tap and a first-order decay develops directly after tap-hole closure. The method of measurement at this smelter is conventional thermocouples in the tap-block, and the amount of refractories in the tapping system is less than at Polokwane.
The type of responses from the Portovesme smelter allowed for tap-block diagnostic systems to be developed as described by Plikas et al. (2005) utilizing computational fluid dynamics (CFD) and principal component analysis (PCA). This would allow for the detection of statistical variation in the tapping response. Further work will be required to develop a diagnostic system in the more complex tap-hole arrangements. Similar PCA-based matte endwall event
detection analysis was recently reported for Polokwane (Groenewald et al., 2017). The range of temperature response from the Portovesme smelter is higher than that for comparable conventional technology at Polokwane, with a range of 5°C as opposed to a 1°C range for the thermocouples at Polokwane (shown in Figure 7).
Discussion
The types of responses exhibited by the fibre optic technologies and the conventional thermocouples are comparable to those that appear in the literature in terms of shapes and the type of response experienced, albeit with a few differences. Each of these systems detects a rise in temperature at any given point during or after the tapping event, and the temperature reaches a peak before decaying in a broadly first-order response. In terms of the fibre optic technology at the Polokwane Smelter, the type A technology appears to have the smoothest response and the most sensitivity to changes in process conditions. More noise is experienced with type B technology. This could be due to the other technologies utilizing discrete temperature measurement points, whereas type B measures temperature with a spatial variance and is more susceptible to fluctuations in the measured temperature.
In terms of the statistical measures of the COV, the differences in COV for the different sensor locations show that the type A technology appears to be more sensitive to spatial location than type B. The apparent decrease in sensitivity with type A with time was, however, a concern as it may indicate a deteriorating performance with operating lifetime; which would be critical in the context of long-term campaign tracking.
In comparison with conventional thermocouples, the real benefit of the fibre optic installations lies in the increased density of measuring points and the generally better proximity of the measurement to the hot face and tapping channel. The fibre optic technologies appear to give a better indication of the thermal inertia exhibited by the tap-block and associated refractories. The thermal resistance is attributed to the tapping channel modules' surround brickwork, which is encapsulated by a water-cooled tap-block. Further within the furnace is the matte endwall separating the tap-block from the molten material and providing the thermal resistance. This is indicated by the increased recovery and rise times experienced by the fibre optic technologies compared to the thermocouples. This gives credence to the thought that the thermocouples are somewhat less sensitive to change in copper cooler and refractory condition than are fibre optics.
As seen in the Portovesme smelter, the less the amount of refractories (lower thermal inertia), the more the tapping response moves to a first-order rise and a plateau, and thereafter at Polokwane a first-order decay. As the refractory wears, the response may become more similar to that at Portovesme. During the matte endwall rebuild in 2016, the refractory brick on the endwall was found to be still in excellent condition, with 80% of the brickwork remaining. Statistical analyses and modelling may be beneficial in quantifying the possible change in tapping profile due to refractory wear should the model (response shape) transform to a set shape/limit. However, the presence of thin air gaps, sulphur corrosion layers of indeterminate thermal conductivity and dimensions, and the influence of matte and slag penetration on refractory and freeze lining properties make accurate prediction of refractory wear profiles exceedingly complex and difficult.
In order to perform specific modelling on a tap to assist in determination of wear profiles of the refractories through the use of PCA, the type A fibre optic technology would appear to be better suited than conventional tap-hole monitoring due to its lower noise and higher resolution in the characterization of a tap. The fibre optic temperature systems do present a challenge in terms of maintenance as they are subjected to the extreme conditions, especially in a PGM matte tapping system (including the matte endwall). The conditions include corrosive gases emitted during tapping, which may damage the external cables and thus render the system nonfunctional until the next deep repair.
Conclusions
The fibre optic system in place at the Polokwane Smelter has allowed for greater understanding of the tapping response, especially when compared to conventional thermocouple and RTD monitoring. Current operation of the conventional thermocouples can allow for the monitoring of wear at the tap-block hot face. Fibre optic technology can pinpoint where wear may occur, owing to the spatial measurements as opposed to the point measurements of conventional thermocouples. This may help the understanding of tap-block wear and influence future designs to extend the tap-block life and prevent failures. The fibre optic technologies each have their merits in application, and can usefully complement and supplement conventional temperature measurements.
The maintenance of each of the fibre optic technologies is something of a challenge in industrial adoption of this technology. Due to its location in the tap-block, access to the fibre optic system for maintenance is usually possible only during a deep brick repair. This may be partially circumvented by strategically placing external data communication units away from the matte tap-holes to avoid premature damage.
The potential benefits of the fibre optic technologies are numerous. If utilized correctly, they allow for better monitoring of the tap-hole and further understanding of this critical part of the furnace, especially with regard to safety. The ability to safely shut down a furnace for a rebuild or repair is of prime importance, and the use of this technology may allow this to be done without any instances of operational failures.
Acknowledgements
Permission by Anglo American Platinum to publish the findings is acknowledged. Contributions from Alpheus Moshokwa, David Sneddon, Klaas Mahlangu, Lloyd Nelson, and Rodney Hundermark are recognized with thanks.
References
Cameron, I., Sriram, R., and Ham, F. 1995. Electric furnace matte tap-hole developments at Falconbridge Limited. CIM Bulletin, vol. 88. pp. 102-108. [ Links ]
Gerritsen, T., Shadlyn, P., MacRosty, R., Zhang, J., and van Beek, B. 2009. Tap-block fibre optic temperature system. Proceedings of Pyrometallugy of Nickel and Cobalt, Sudbury, Ontario. CIM, Montreal. pp. 627-637. [ Links ]
Groenewald, J.W.D., Nelson, L.R.N., Hundermark, R.J., Phage, K., Sakaran, R.L., van Rooyen, Q., and Cizek, A. 2017. Furnace integrity monitoring using principal component analysis: An industrial case study. Proceedings of the Seventh International Platinum Conference 2017, 'Platinum- A Changing Industry', Polokwane, South Africa, 18-19 October 2017. Southern African Institute of Mining and Metallurgy, Johannesburg [ Links ]
Hopf, M. 2014. Monitoring the wear of water-cooled tap-hole blocks by the OPTISAVE fibre optic method. Proceedings of the Furnace Tapping Conference. Southern African Institute of Mining and Metallurgy, Johannesburg. pp. 33-50. [ Links ]
Hopf, M. and Rossouw, E. 2006. New opportunities - exhaustive monitored copper coolers for submerged arc furnaces. Proceedings of Southern African Pyrometallurgy. Jones, R.T. (ed.). Southern African Institute of Mining and Metallurgy, Johannesburg. pp. 89-100. [ Links ]
MacRosty, R., Gerritsen, T., and Pula, R. 2014. Evaluation of fibre optic temperature sensor data for the prediction of tap-block condition. COM. Canada. [ Links ]
Nelson, L.R., and Hundermark R.J. 2016. The tap-hole - key to furnace performance. Journal of the Southern African Institute of Mining and Metallurgy, vol. 116. pp. 465-490. [ Links ]
Nolet, I. 2014. Tapping of PGM-Ni mattes: an industry survey. Proceedings of Furnace Tapping 2014. Southern African Institute of Mining and Metallurgy, Johannesburg. pp. 223-232. [ Links ]
Othonos, A., Kalli, K., Pureur, D., and Mugnier, A. 2006. Fibre Bragg Gratings. Springer Series in Optical Science, vol. 123. pp. 189-269. [ Links ]
Plikas, T., Gunnewiek, L., Gerritsen, T., Brothers, M., and Karges, A. 2005. The predictive control of furnace tap-block operation using CFD and PCA modeling. JoM, vol. 57, no. 10. pp. 37-43. [ Links ]
REOTEMP Instrument Corporation. (2011). Type K thermocouple. http://www.thermocoupleinfo.com/type-k-thermocouple.htm [accessed 17 May 2017]. [ Links ]
Shaw, A., de Villiers, L.P.vS., Hundermark, R.J., Ndlovu, J., Nelson, L.R., Pieterse, B., Sullivan, R., Voermann, N., Walker, C., Stober, F., and McKenzie, A. 2012. Challenge and solutions in PGM furnace operation: high matte temperature and copper cooler corrosion. Proceedings of the Fifth International Platinum Conference, 'A Catalystfor Change'. Southern African Institute of Mining and Metallurgy, Johannesburg. pp. 193-216. [ Links ] ♦
This paper was first presented at the 7th International Platinum Conference 2017 'Platinum-A Changing Industry' In Association with AMI Precious Metals 2017, 18-19 October2017, Protea Hotel Ranch Resort, Polokwane, South Africa.

