


Services on Demand
Article
 English (pdf)
 Article in xml format
 Article references
Indicators

Related links
-
 Cited by Google
 -
 Similars in Google
Share

 Permalink
Journal of the Southern African Institute of Mining and Metallurgy
On-line version ISSN 2411-9717
Print version ISSN 2225-6253
J. S. Afr. Inst. Min. Metall. vol.118 n.3 Johannesburg Mar. 2018
http://dx.doi.org/10.17159/2411-9717/2018/v118n3a10
PAPERS OF GENERAL INTEREST
A structured key cost analysis methodology to identify value-contributing activities in mining projects: a case study of the Chuquicamata Underground Project
E. CórdovaI; V. MobarecI; E. PizarroII; A.R. VidelaI
IMining Engineering Department, Pontificia Universidad Católica de Chile, Chile
IIChuquicamata Underground Mining Project, CODELCO
SYNOPSIS
Traditional project evaluation methods for estimating operating costs of mining projects mostly produce static and over-conservative evaluations. In this study, a systematic model for managing the economic risk of the operating costs for an ongoing 'supercave' project, the Chuquicamata Underground Project, is presented. Key cost generators are identified, and their inherent variability is characterized based on a similar underground operation and expert judgment. Using Monte Carlo simulations, variability is factored into the evaluation, and the economic risk associated with each variable is quantified, after which the simulated data is used to identify the underlying risk, as well as mitigating actions and opportunities. The methodology can serve to identify how variability may impact the value of the project and how mitigation actions could decrease the present value of the estimated operating cost of the project by more than 10%. As a result of the analysis, the project managers became aware that labour and energy costs are the major contributors from a risk-value perspective, and mitigating actions such as construction of a power plant and implementation of a well-designed labour productivity incentive plan could be justified with a reduction of the overall risk value of the project.
Keywords: risk quantification, risk management, underground mining operating cost, Monte Carlo simulation, quantitative risk analysis.
Introduction
The development of a large-scale underground mining operation, from initial discovery of the orebody to first production, takes several years and moves through different stages. These are generally defined as scoping, prefeasibility, feasibility, engineering design, and site construction and mine development (SME, 2011). Each stage deals with more detail than the preceding one, therefore reducing the levels of uncertainty (Tulcanaza, 2014). Based on this information, the key variables of the project are estimated, which allows for a global economic evaluation to be developed for the future mining operation.
Any economic decision during the development of a mining project must take into account its projected financial impact. Assuming the project has been correctly designed and achieves the expected production levels and recoveries, income may be considered an exogenous variable depending on metal prices. In such a scenario, most of the effort is focused on correct cost projections associated with mining design, which will determine the final cash flow of the project. The overall cost of a mining operation is usually divided into capital and operating costs. Capital costs refer to the investment required for the design and implementation of the operation, and are incurred primarily during the early years of the project. In contrast, operating costs relate to expenses associated with all the unit processes that enable mineral production, from orebody characterization to extraction of the ore and subsequent processing throughout the life of the mine (LoM). These operating costs will depend on both internal and external project variables. The former relate to the particular circumstances and requirements of the operation and the latter to market conditions and commodity prices.
One major problem that any mining project confronts is that economic evaluations, especially in their early stages, do not identify the major risk factors associated with cost drivers. A detailed feasibility study may contain thousands of cost items and activities, making it quite difficult to extract key cost drivers from the data-set. This usually leads to projects underperforming due to higher operating costs and lower performance indicators than expected (Mackenzie, 2007). Indeed, almost 70% of mining megaprojects fail to meet at least one of their estimated key success criteria (Merrow, 2011).
In recent years, operating costs in the mining industry have become a critical issue due to their substantial rise in relation to total spending (Perez-Oportus, 2008). Consequently, uncertainty and possible risks related to varying operating costs during the LoM should be considered as relevant factors. Risk analysis techniques based on Monte Carlo simulation, such as Quantitative Risk Analysis (QRA), offer a more appropriate path than traditional evaluation methods for understanding the responses and robustness of a project. This is especially the case given the time-frame and the intrinsic uncertainty related to the estimation variables (Merrow, 2014; Heuberger, 1995; Chinbat and Takakuwa, 2009; Brown, 2012). Unlike traditional methods that incorporate uncertainty as a percentage of total expenditure, using factors such as 'contingency' or 'overall expenses', QRA relies on stochastic modelling and simulation of the key project variables to calculate the combined impact of the model's various uncertainties in order to create a probability distribution of the possible model outcomes.
The need to understand the causes and sources of risk in the mining industry drives the combination of expert judgment analysis with quantitative methods. This will allow the company to quantify increasing levels of uncertainty and help it to understand potential project responses to the range of possible variations and future conditions (Summers, 2000).
The method applied in this paper includes a systematic risk management approach, combining quantitative and qualitative analysis, to identify the main sources of risk and propose risk mitigation alternatives. The method has been applied only to the Chuquicamata Underground Mine Project, an ongoing operation in the north of Chile and state-owned through Codelco. To preserve confidentiality of the data, all cost values have been anonymized by multiplying them by a factor.
The results show that the operating economic risk of the project relates to just a few of its cost generators. Risk can be managed by introducing specific risk mitigation alternatives that target these generators, thus reducing uncertainty and even improving the expected economic value of the project.
Objective
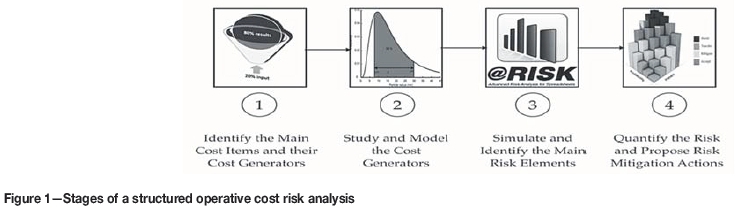
The objective of the study was to develop a method to estimate the associated economic risk of operational costs for the Chuquicamata Underground Mine Project (CUMP). To that end, the main cost drivers are identified, their variability is characterized, and the impact on the project in several scenarios is simulated to estimate the value that they provide. The proposed methodology is summarized in Figure 1.
Chuquicamata Underground Mine Project cost description
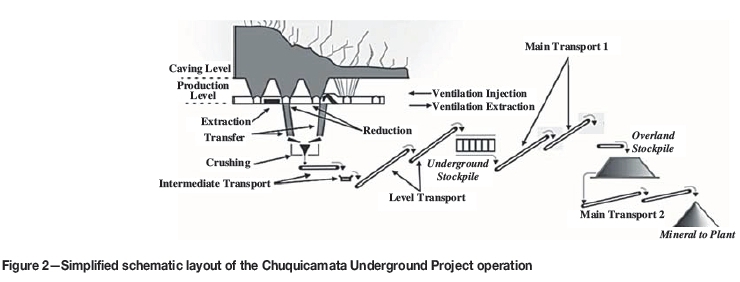
Chuquicamata has been operating as an open pit since 1915, and is being transitioned to an underground project, starting as a four-panel macro-block caving operation. The project is designed to operate at a production rate of 140 kt/d over a life of 40 years, with a 7-year ramp-up, 28 years of steady-state production, and a 5-year ramp-down, with an initial 10 years of development. This will turn it into a so-called 'supercave' and one of the largest underground operations in the world (Chitombo, 2010). The project is now entering the detailed engineering stage, with production expected to start in 2019. Figure 2 shows a basic schematic diagram of the mine operation.
The data used for the analysis is based on initial cost estimations for the feasibility study, including development and production schedules, and all technical and economic parameters considered for the economic evaluation throughout the LoM (2019-2058). Present values of all operating costs of the project add up to US$2.582 billion (2014 US$, 8% discount rate), and are divided into two main activities: mine development and production costs. Each activity contains multiple sub-activities, which are further divided into elements of expenditure.
Mine development costs include all expenses related to the construction of the mining facility and supporting infrastructure. The current estimate for the present value of the cost of this activity reaches US$844 million, representing 30% of the total operating cost of the project. Development costs consist of 10 sub-activities and seven elements of expenditure, with a total of 67 cost items.
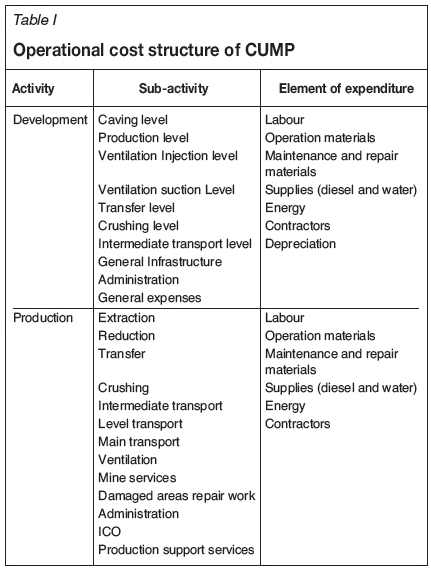
Production costs, on the other hand, include the expenses of all unit operations involved in the actual extraction of the orebody, including additional activities or services required to fulfil the mine production schedule. The current estimate for the present value of the cost of this activity is $1.738 billion, which represents the remaining 70% of total operating costs. Production costs consist of 13 sub-activities and six elements of expenditure, with a total of 84 cost items. Table I summarizes the structure of the CUMP operating costs.
Systematic cost analysis
Identification ofmain elements ofcosts
As above, there are 151 cost items (67 from development, 84 from production) categorized as activity-sub-activity-element of expenditure. The evaluation compared the different cost items according to their net present value of costs (NPVC). Considering the horizon of the project (40+ years), this alternative outweighs other available options, for example comparing the items according to their added nominal value. Using a discount rate accounts for the effect of time as part of the expenditure evaluation, resulting in a more realistic comparison. The NPVC of a cost item is calculated by summing all the discounted expenses of that item throughout the LoM:
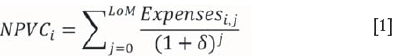
where
NPVCi Net present value of cost (i)
LoM Life of mine
Expensesij| Expense of cost i at time j
δ Anual discount rate
The study uses 2014 as the initial year for the evaluation and an annual discount rate δ of 8%. The total net present value of the operating costs of the project is calculated by summing the NPVCs of all cost items.
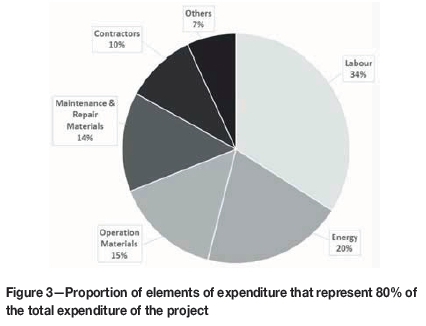
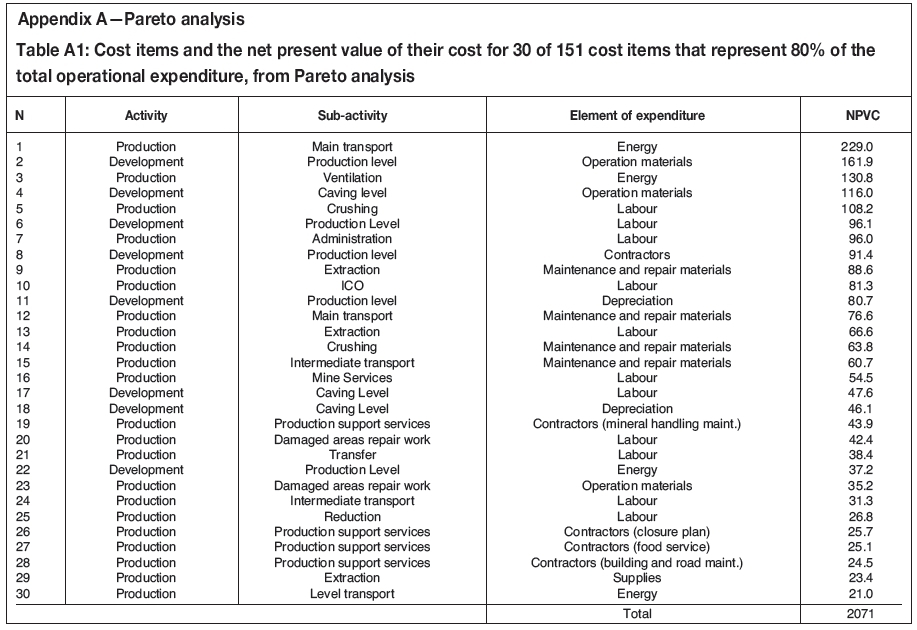
The most relevant cost items were determined with the Pareto principle, ranking and segregating the items that represent 80% of the total operating cost NPV. From the analysis, it followed that 30 out of 151 cost items (i.e., 19.86%) accounted for 80.2% of total expenditure. Out of the 30 cost items identified, eight relate to development activities, with an NPVC of US$678 million, and the remaining 22 to production activities, with an NPVC of US$1.394 billion. Figure 3 illustrates the global proportion represented by each element of expenditure within these 30 cost items, and detailed information about them appears in Appendix A.
Identification and categorization of cost drivers
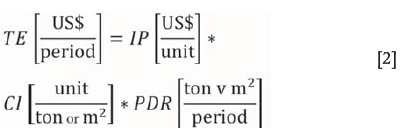
The relevant cost items identified in the previous section are analysed to isolate their specific cost generators. These cost generators are divided into three categories: input prices (IP), consumptions intensities (CI), and production and development requirements (PDR). The total expense (TE) of each cost item identified in the previous section, during any period of the evaluation, can thus be written as a combination of these variables:
Cost variability modelling
Once the main operating cost generators have been identified, their variability needs to be understood and characterized. The methodology applied to estimate such variability for elements of each cost category is explained below for each cost item.
Unit market prices
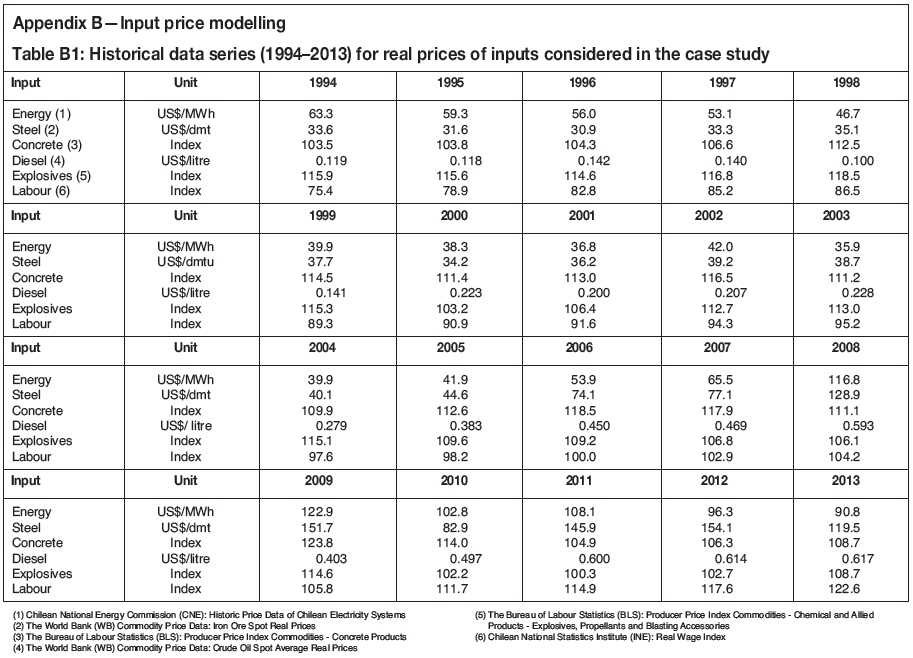
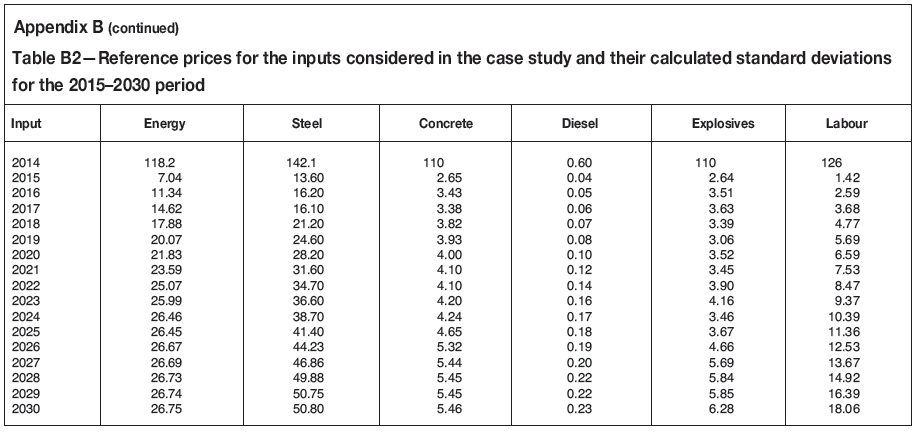
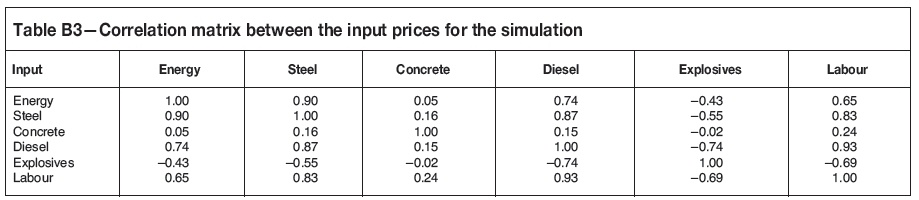
Market prices represent the price per unit of consumption of the inputs of each cost item. The inputs included as part of the CUMP case study (and which represent the main inputs of almost any underground mining project) are energy, steel, concrete, diesel, explosives, and labour. The unit prices were modelled using a time-spatial variogram correlation to incorporate the increment in value uncertainness as time projection increases. By incorporating initial prices used in the feasibility stage of the project plus market projections and their historical variability, different scenarios can be projected. Appendix B presents the methodology used to model the input prices.
Consumption intensities
This category considers consumption rate of supplies per square metre developed or ton produced, depending on the activity in question. Consumption intensities will be related to the elements of expenditure of each activity, in this case labour, materials, supplies, energy, and contractors. We modelled the intensities by combining the initial estimations used in the feasibility stage of the project with the variability observed in a real operation in a similar block caving underground mine, Codelco's El Teniente, the only underground operation in Chile comparable in size to CUMP. Appendix C shows the methodology used to model the consumption intensities.
Production and development requirements These requirements represent the number of square metres that will be developed and the tons that will be produced in each period of mine life. Production is considered as fixed input; therefore any value risk assessment ignores variations in production at this stage.
Cost variation along the LoM using Monte Carlo simulations
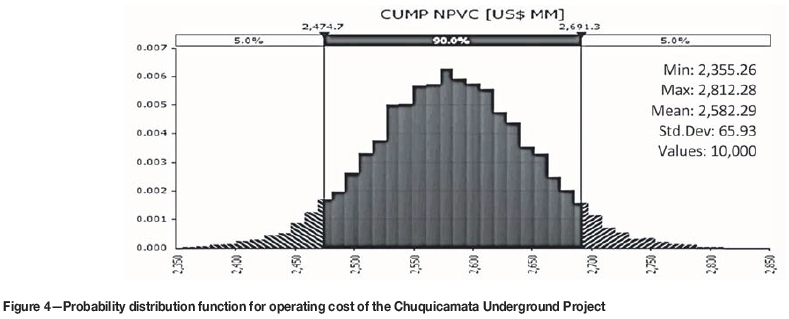
The total information is combined in an application that allows estimation of the economic performance of the project under different scenarios. Simulations are conducted using the @Risk software by Palisade with N=10 000 iterations. The operational cost structure proposed in the feasibility stage is used as a basis for the analyses, as well as the models and correlation matrices defined in the cost generators modelling section. A detailed simulation input table appears in Appendix D. The main output of the simulation is a distribution function of the present value of the operating costs of the project during the LoM. Figure 4 shows the obtained probability distribution function.
Model results
The simulated NPV of the operational costs ranges from US$2.351 billion to US$2.829 billion, with a mean value of US$2.582 billion and a standard deviation of US$65.9 million. The estimated mean value of US$2.582 billion matches the value estimated for the base case scenario, since the base estimations were used as the mean values for the input variables. Figure 4 shows that the operational cost variability can impact the NPV of the operational costs of the project by up to 10%, or US$250 million.
Risk assessment and quantification
To identify the major cost/risk sources of the project, 'unacceptable' scenarios are defined and economic risk is calculated as the difference between their mean value and the base estimation. Subsequently, the elements of expenditure are ranked according to their contribution to total economic risk. For the CUMP case study, the top 5% of simulated scenarios, i.e., scenarios in which the present value of the operational cost exceeds US$2.692 billion, are dismissed as unacceptable. The mean present value of these scenarios is US$2.72 billion, resulting in a total economic risk of US$138 million. Figure 5 shows the average contribution of each element of expenditure to the calculated economic risk.
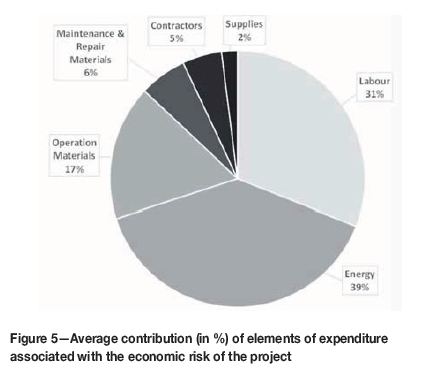
As appears in Figure 5, the most relevant risk sources are energy and labour, which together account for 70% of the total risk value. Any risk mitigation efforts should thus focus on these elements of expenditure. Also, contrasting these results with Figure 3 suggests that economic risk is not always proportional to total expenditure. Indeed, energy and labour represent 55% of total expenditure, but make up 70% of the total risk value. Operational materials and maintenance and repair materials represent 29% of total expenditure, but their contribution to total risk value is 23%. This illustrates the necessity for each of the elements of expenditure to be analysed independently.
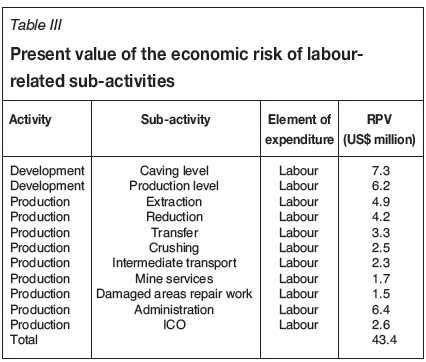
To suggest any mitigation effort in the CUMP, it was necessary to understand how risk is distributed among the labour- and energy-related cost items. Using the same set of 'unacceptable' scenarios, the economic risk of the cost items was quantified as the difference between their mean present value under these scenarios and the base case estimation. The resulting economic risk for the energy and labour cost items appears in Tables II and III, respectively.
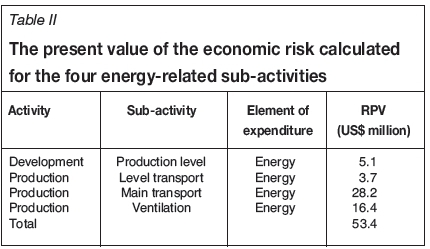
In Table II it can be seen that energy-related economic risk is heavily skewed toward two production sub-activities: main transport and ventilation. Together, these two factors account for more than 80% of the total energy-related risk.
In contrast, Table III shows that labour cost risk value is related to 11 sub-activities, and is more evenly distributed among them than is the case with energy.
Risk management analysis
Having identified labour and energy as main risk sources and calculated their economic risk value, we proceed to evaluate risk control alternatives. It is essential to fully understand the cost structure of the items related to these elements of expenditure, so that risk mitigation alternatives that target these specific cost generators can be proposed.
Energy cost items
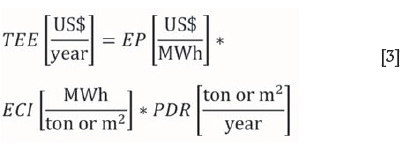
The total energy expenditure (TEE) per year for the cost items in Table IV emerges from energy price (EP), energy consumption intensity (ECI), and the requirements of the production and development plan for that year as shown in Equation [3].
Energy price
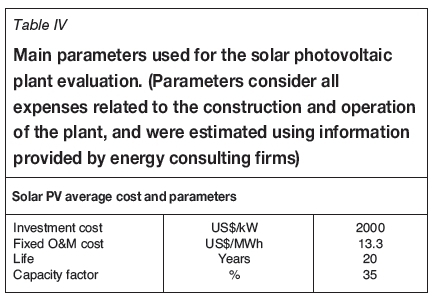
In the CUMP feasibility study evaluation, the energy price (EP) has a fixed value throughout the entire LoM. In reality, the EP is not static since it depends on electricity market conditions (which are external to the project and vary over time). However, there are various alternatives that will allow us to manage the uncertainty related to this cost generator. The first alternative would be to establish electricity supply contracts (so-called 'power purchase agreements', or PPAs) with one or more energy companies. This would fix a price for the power purchased throughout the LoM and allow the mine to eliminate uncertainty relating to energy price variability. However, the real economic impact of this alternative remains unclear, since it will depend on the difference between the price set by the contract and the future spot prices traded on the electricity market, which is usually addressed by market options valorization and is beyond the objective of the present study. A more suitable approach is to value the incorporation of a power plant, which could supply the project with at least some of its energy requirements. Developing a power plant for a mining operation is not a new concept in the mining industry. Some Chilean operations, like the Pelambres and Escondida mines, are already opting for this alternative. Considering the location of CUMP (the Atacama Desert) and the energy projects currently being developed in that region, the logical choice would be a power plant based on photovoltaic (PV) solar energy. The parameters used for the analysis of this alternative have been estimated using information provided by energy consulting firms for similar solar PV projects, and are outlined in Table IV.
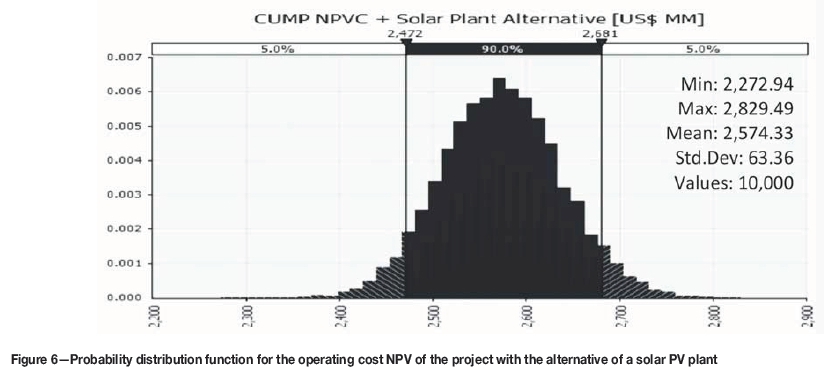
For the purposes of evaluation, it is assumed the processing plant is commissioned in 2017 and begins operating in 2019, together with CUMP. The capacity of the plant will depend on the initial investment, which we assume will match the value of risk determined in the previous section for this element of expenditure (US$67.2 million in 2017). This will result in an installed capacity of 33.66 MW, capable of generating approximately 103 GWh per year. The impact on the project value is assumed as a consequent reduction in energy cost variability. By including this alternative within a new simulation model, we obtain a new probability distribution function for the operating cost NPV, shown in Figure 6.
According to the results, the proposed plant significantly impacts the energy-related economic risk, reducing it by 20.9%. Additionally, the mean present value of the operating cost of the project decreases by US$16 million. Given these positive results, we consider the proposed solar PV plant a good alternative for managing the energy-related economic risk.
Energy consumption intensity
The second factor contributing to the TEE is energy consumption intensity, which represents the energy consumed by each sub-activity per square metre developed or ton processed. This value will depend on variables such as equipment installed, operational conditions, characteristics of the mineral being processed, specific requirements of the processes involved in each sub-activity, and more, meaning its inherent variability is complicated to manage. An alternative for controlling the economic impact of this cost generator is to improve the efficiency of the required equipment, which will result in reduced overall energy consumption and, therefore, less uncertainty. To achieve this, we need to focus on the most relevant energy-related sub-activities for this case study: main transport and ventilation.
The CUMP main transport system consists of several conveyor belts carrying the mined material from extraction points to the processing plant located at surface level. The idea of conveyor energy efficiency has been adopted in the mining industry and successfully applied in practice. Conveyor efficiency can be improved at four levels: performance, operation, equipment, and technology (Zang and Xia, 2011). Since the CUMP transport system has not been constructed yet, any of these levels could potentially be optimized for decreasing its energy consumption. This is particularly noteworthy given that a 10% reduction in the energy consumption of the CUMP conveyors would decrease the present value of the project operating costs by US$25 million, and the energy risk would fall by 6%.
The CUMP ventilation system provides fresh air to underground operations through multiple main and auxiliary fans that run on electricity. Many recent studies have shown that mine ventilation energy efficiency can be improved by optimizing the traditional technical and operational conditions of fan systems (Pritchard, 2009). New technologies such as variable speed drives, composite materials, and 'hermit crab' techniques have proved feasible and cost-effective alternatives for this purpose (Belle, 2008). These technologies will be evaluated in the next stage of the project. A 10% reduction in the ventilation energy consumption would decrease the present value of project operating costs by US$13 million and reduce the energy economic risk by 3.2%.
Labour cost items
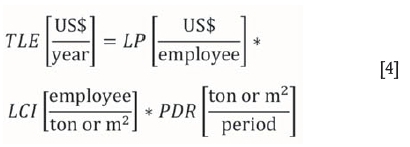
The total labour expenditure (TLE) per year for each labour activity in Table V is the product of labour price (LP), labour consumption intensity (LCI), and the production and development requirements for that year.
Labour price
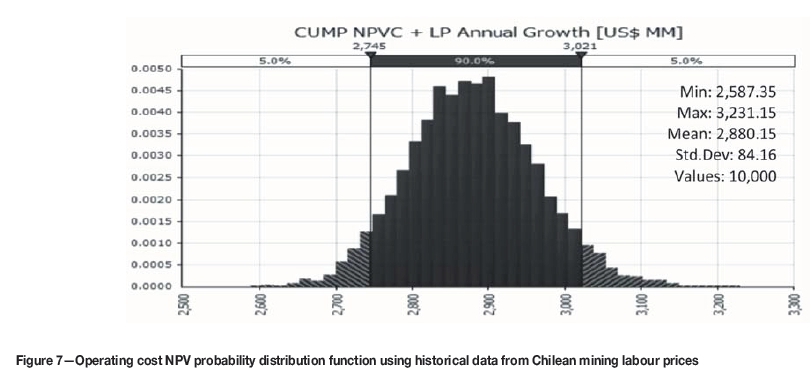
Labour price, or salary, represents the remuneration paid to employees in return for their work. In this case, the LP estimations are closely related to the market rates for people performing similar work in similar industries in the same region, so LP should be considered non-negotiable. Importantly, research into the evolution of LP in the mining industry over the last 20 years suggests that a real annual growth factor exists that is ignored in the CUMP base estimations (Consejo Minero, 2013). Using historical data derived from the Chilean mining labour price, it is possible to model this factor as an independent variable that fits a lognormal distribution with a mean of 2.61% and a standard deviation of 1.41%. The variable is included in the model and new simulations are created, obtaining a new probability distribution function for the operating cost net present value, shown in Figure 7.
With the LP real annual growth factor included in the case study, a mean NPV for the operational costs of the project of US$2.88 billion - US$298 million above the initial estimation - is obtained. The standard deviation of the distribution increases by 27.7% and the labour-related economic risk value doubles. These results suggest that annual growth of labour price represents a critical variable for the project, so it should be considered a major risk source and included in future evaluations.
Labour consumption intensity
Labour consumption intensity represents the number of employees needed to develop a square metre or to produce a ton during the LoM. In the mining industry, this cost generator is known as productivity, and it can potentially be managed. Studies show that the Chilean copper mining productivity index has decreased by more than 30% over the last 10 years (Keller, 2013). As a result, it is becoming a crucial topic of discussion, especially if we consider the relevance of labour costs for the total costs of any mining project. In the CUMP case study, the LCI for a sub-activity i can be expressed as:
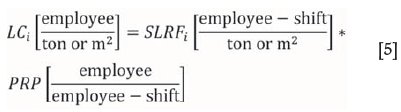
The sub-activity labour requirement factor (SLRF) represents the specific number of employees per shift that is needed for each of the sub-activities to operate. The personnel rotation parameter (PRP) is a fixed value representing the total number of employees needed for every employee per shift counted, taking into account the shift system and an estimated level of leave of absence. Attracting more highly skilled workers to the project and introducing new sub-activity-focused technologies can improve the SLRF. Optimizing shift systems and adopting specific measures to reduce absenteeism can improve PRP. Recent studies addressing the matter suggest that the shortage of skilled labour, at both managerial and operational levels, as well as the lack of process analysis, are the key factors affecting mining productivity, suggesting that a perceptible and significant correlation exists between human resources management and labour productivity (Huselid, 1995; Koch and Gunther, 1996; Perez-Oportus, 2008; Thorpe, O'Callaghan, and Guthridge, 2012). They also prove that sophisticated human resources planning and investments in hiring and employee development have an economically and statistically significant impact on labour productivity, especially in capital-intensive organizations like mining companies. Based on these findings, the CUMP is evaluating new investments to improve productivity. Some relevant measures include the introduction of workshops targeting the specific industry skill requirements, the development of results-oriented incentives for workers, the optimization of current processes regarding projects and operations, and boosting human resources planning and hiring budgets. Implementing such measures is critical and will be evaluated in subsequent project stages, especially considering that a 10% improvement in labour productivity at CUMP would decrease the presently valued operating costs by US$70 million and further reduce the project's economic risk value.
Conclusions
A quantitative risk analysis methodology was successfully developed and executed to characterize and manage the risk associated with the variability of the key cost generators in an underground mining project. In the case analysed, the Chuquicamata Underground Project, the methodology identifies the main sources of risk related to cost drivers, helping to focus mitigation plans. Indeed, the results show that variability can potentially increase the present value of the estimated operating cost of the project by more than 10%, with labour and energy being the most relevant risk sources, comprising almost 70% of the total cost-driven economic risk.
After further data analysis, it was possible to discern that energy cost uncertainty arises from only two main activities, ventilation and main transport. In contrast, labour cost risk value is more homogenously distributed, and focusing on a few activities is difficult. Risk mitigation in the case of energy can be addressed by incorporation of a power plant to meet the energy demands of the project, and optimization of the conveyor and ventilation systems to increase energy efficiency. In the case of the labour cost item, mitigation requires a general focus on productivity, organizational structure, and appropriate incentives.
The method enables the most relevant cost items with the highest impact on risk value to be recognized during the early stages of a project. As result, management can focus time and effort on controlling the variables that matter.
The proposed risk analysis approach can be effectively applied to the operating cost structure of any underground mining project in order to identify its risk sources and assist in the decision-making process during the early stages of project evaluation.
References
Belle, B. 2008. Energy savings on mine ventilation fans using "quick-win" Hermit Crab Technology. Proceedings of the 12th US/North American Mine Ventilation Symposium, Reno, NV. Wallace, K.G. (ed.). University of Nevada. pp. 427-433. [ Links ]
Botín, J.A., Guzman, R., and Smith, M. 2011. A methodological model to assist the optimization and risk management of mining investment decisions. Dyna. Journal of the Faculty of Mines. National University of Colombia, vol. 78, no. 170. pp. 221-226. [ Links ]
Brown, J. 2012. Managing large-scale capital projects. 2012. Americas School of Mine, May 15-17, Scottsdale, AZ. PriceWaterhouseCoopers LLP. https://wiww.pwc.com/gx/en/mining/school-of-mines/2012/pwc-managing-large-scale-capital-projects.pdf [ Links ]
Chinbat, U. and Takakuwa, S. 2009. Using simulation analysis for mining project risk management. Proceedings of the 2009 Winter Simulation Conference, Austin, TX. Rossetti, M.D., Hill, R.R., Johansson, B., Dunkin, A., and Ingalls, R.G. (eds.). IEEE, New York. pp. 2612--2623. [ Links ]
Chitombo, G.P. 2010. Cave mining - 16 years after Laubscher's 1994 paper "Cave mining - state of the art". Caving 2010. Proceedings of the Second International Seminar on Block and Sublevel Caving, Perth, Australia, 20-22 April 2010. Australian Centre for Geomechanics. Nedlands, Australia. pp. 45-61. [ Links ]
Consejo Minero. 2013. Gran minería de Chile: Desafíos de productividad. Working paper, Consejo de Competencias Mineras, Santiago, Chile. http://dev.consejominero.cl/wp-content/uploads/2016/03/Consejo-Minero-Competitividad-y-Productividad-JV-Agosto-2013-F.pdf [ Links ]
Heuberger, R. 2005. Risk analysis in the mining industry. Journal of the South African Institute of Mining and Metallurgy, vol. 105. pp. 75-80. [ Links ]
Huselid, M. 1995. The impact of human resource management practices on turnover, productivity and corporate financial performance. Academy of Management Journal, vol. 38. pp. 635-672. [ Links ]
Isaaks, E. and Srivastava, R. 1989. An Introduction to Applied Geostatistics. Oxford University Press, New York. pp. 55-65. [ Links ]
Keller, T. 2013. Competitividad de la Industria Minera Chilena. Proceedings of Exposición Internacional de la Industria Minera - EXPONOR 2013, Antofagasta, Chile, 17-21 June 2013., https://www.codelco.com/prontus_codelco/site/artic/20130117/asocfile/20 130117172641/ presentacion_pe_exponor_17jun2013.pdf [ Links ]
Koch, M. and Gunther, R. 1996. Improving labor productivity: Human resource management policies do matter. Strategic Management Journal, vol. 17. pp. 335-354. [ Links ]
Mackenzie, W. and Cusworth, N. 2007. The use and abuse of feasibility studies. Proceedings of the 2007Project Evaluation Conference, Melbourne, Victoria, 19-20 June 2007. Australasian Institute of Mining and Metallurgy, Melbourne. pp. 1-12. [ Links ]
Marx W.M. et al. 2008. Development of energy efficient mine ventilation and cooling systems, Mine Ventilation of South Africa Society Journal, vol. 16, April/June. pp. 5-9. [ Links ]
Merrow, E. 2011/ Industrial Megaprojects: Concepts, Strategies, and Practices for Success. Wiley, Hoboken, NJ. [ Links ]
Mccarthy, P. 2013. Why feasibility studies fail. Working paper, Australasian Institute of Mining and Metallurgy, Melbourne. [ Links ]
Pérez-Oportus, P. 2008. Costos de la minería: iCuánto impactan los insumos en la industria del cobre? Working paper, Comisión Chilena del Cobre, Santiago, Chile. [ Links ]
Pritchard, C. 2009. Methods to improve mine ventilation system efficiency. Working paper, National Institute for occupational Safety and Health, Spokane, WA. [ Links ]
Thorpe, J., O'Callaghan, J., and Guthridge, M. 2012. Productivity scorecard. Working paper, PriceWaterhouseCoopers, Sydney, Australia. [ Links ]
Tulcanaza, E. 2014. Certificación y valorización de recursos y reservas mineras. Committee for Mineral Reserves International Reporting Standards. http://comisionminera.cl/docs/folleto-curso-octubre.pdf [ Links ]
Society for Mining, Metallurgy, and Exploration, Inc. 2011. Mining Engineering Handbook, 3rd edn. Littleton, CO. pp. 227-231. [ Links ]
Summers, J. 2000. Analysis and management of mining risk. Proceedings of Massmin 2000, Brisbane, Queensland, 29 October-2 November 2000. Australasian Institute of Mining and Metallurgy, Melbourne. pp. 63-79. [ Links ]
Xia, X. and Zhang, J. 2010. Energy efficiency and control systems from a POET perspective. Proceedings of the IFAC Conference on Control Methodologies and Technology for Energy Efficiency, Vilamoura, Portugal, 29-31 March 2010. Ferrera, P.M. (ed.). Elsevier. pp. 255-260. [ Links ]
Zhang, S. AND Xia, X. 2011. Modeling and energy efficiency optimization of belt conveyors. Applied Energy, vol. 88. pp. 3061-3071. [ Links ] ♦
Paper received Mar. 2017
Revised paper received Jun. 2017

