


Services on Demand
Article
 English (pdf)
 Article in xml format
 Article references
Indicators

Related links
-
 Cited by Google
 -
 Similars in Google
Share

 Permalink
Journal of the Southern African Institute of Mining and Metallurgy
On-line version ISSN 2411-9717
Print version ISSN 2225-6253
J. S. Afr. Inst. Min. Metall. vol.118 n.3 Johannesburg Mar. 2018
http://dx.doi.org/10.17159/2411-9717/2018/v118n3a7
AFRIROCK 2017 INTERNATIONAL SYMPOSIUM
Keyblock stability analysis of longhole stopes
D. SewnunI; W. JoughinI; R. ArmstrongI; A. CooperII
ISRK Consulting (Pty) Ltd, South Africa
IIIvanplats (Pty) Ltd, South Africa
SYNOPSIS
The orientations of discontinuity sets and major geological structures greatly influence the stability of an excavation. Excavations should therefore, where possible, be orientated such that major discontinuity sets and structures are considered, allowing the likelihood of rockfalls in a longhole stope to be kept to a minimum. The longhole stopes are non-entry excavations, which are remote cleaned to avoid exposure of personnel. However, excessive rockfalls can significantly influence productivity and cause damage to mining machinery. This paper presents a risk-based approach to design, where the failure potential of mining stopes for the Platreef mine was determined considering the influence of major structures. The probabilistic keyblock analysis software JBlock was used in this capacity. In this study, the failure potential of keyblocks was determined in JBlock for the longhole stopes of various proposed orientations, considering structural domains and a major geological fault which was identified across the project area. Results of the analysis indicated that stopes orientated sub-parallel to Platreefs major fault (Tshukudu Fault) resulted in the largest rockfalls. Overall, JBlock was used successfully as a design tool to assess the stability of the longhole stopes. Outcomes of the study have provided Platreef mine with valuable information that will assist in the decision-making process when finalizing stope orientations. This study therefore attempts to serve as a reference point for solutions to similar situations, with the objective that risk-based designs are called upon more frequently in the future.
Keywords: longhole stope, stope stability, keyblock, probabilistic analysis, JBlock.
Introduction
Ivanplats (Pty) Ltd, a subsidiary of Ivanhoe Mines Ltd, has undertaken an investigation to assess the feasibility of developing a new 4 Mt/a underground platinum mine (the Platreef mine) accessed via a vertical shaft system. Platreef mine is located on the northern limb of the Bushveld Complex in South Africa, near the town of Mokopane, approximately 280 km northeast of Johannesburg.
It is planned to extract the wide, shallow-dipping orebody using longhole stopes (15 m wide, 25 m high, and between 40 m and 200 m long), which are post-filled. The stopes will be mined in a primary-secondary sequence using mining machinery and will be non-entry once blasted. In areas which are flat dipping (<10°), the stopes can be orientated in any direction, but where the dip is greater than 10°, they can either be oriented longitudinally (parallel to strike) or transversely.
The orientation of the proposed stopes must be optimized to minimize rockfalls and the consequences of production disruptions and damage to machinery. A risk assessment of the failure potential of geological discontinuities in the stope back and walls was therefore carried out. A structural analysis was conducted utilizing logged and wireline discontinuity data from across the project area. Structural domains were then defined based on identified discontinuity sets and major geological structures interpreted in the area. The discontinuity sets for each structural domain were then evaluated for the proposed transverse and longitudinal mining stopes using the keyblock analysis software JBlock (Esterhuizen, 2003). This approach has been applied by several authors for the analysis of stability of tunnels and subhorizontal, narrow tabular stopes (Esterhuizen and Streuders, 1998; Dunn and Stacey, 2008; Dunn, Earl, and Watson, 2008; Dunn, 2010; Joughin et al., 2012).
Major structural geology
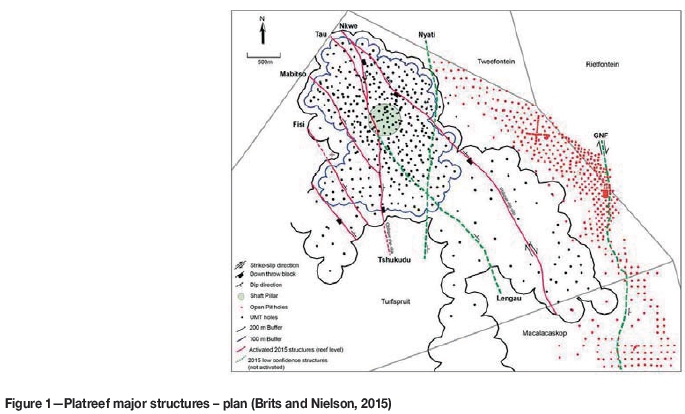
Through the collection and analysis of drillhole data, the Tshukudu major fault was identified by Ivanplats geologists (Ivanhoe Mines, 2015). The Tshukudu Fault strikes approximately from north to south and traverses the entire project area (Figure 1). The true thickness of the fault varies from 5 m to 57 m, typically ranging from 10 m to 25 m (Ivanhoe Mines, 2016). This fault represents a significant geotechnical hazard and comprises a wide fracture zone of influence with intensely altered and brecciated fault gouge (Ivanhoe Mines, 2016). The fault is generally steeply inclined (50° to 70° dip) with an east-northeast dip direction and oblique normal sense of movement (Ivanhoe Mines, 2015). The combination of weak infill, a high degree of fracturing, the width, the zone of disturbance, and the steep dip results in a high likelihood of uncontrolled unravelling (running).
Other major structures have been identified across the project area (Figure 1). These were not considered to pose significant geotechnical risk, but were used in the compilation of the geotechnical model.
Local structural geology
Rock mass instabilities adjacent to excavations can often be attributed to naturally occurring discontinuities or induced fractures (Windsor and Thompson, 1992). It is thus essential to have an insight on the orientation and the nature of discontinuity sets present across the mining area.
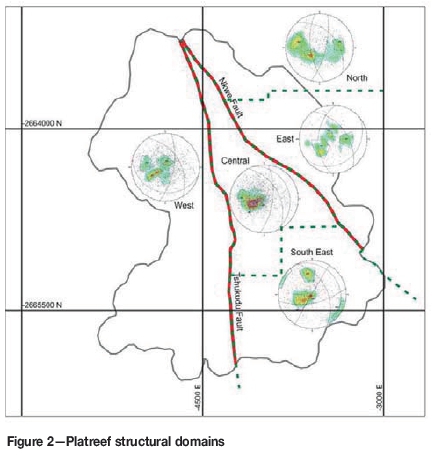
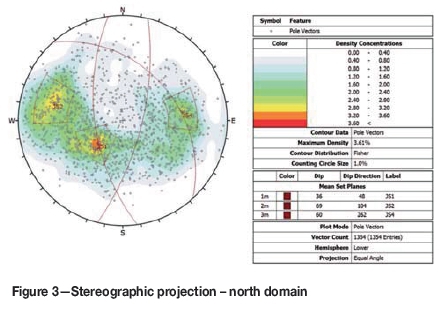
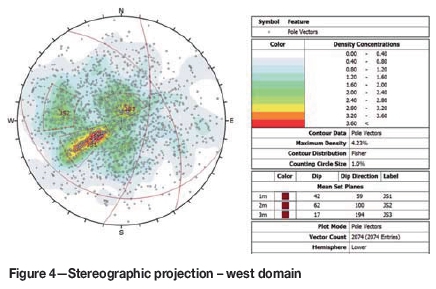
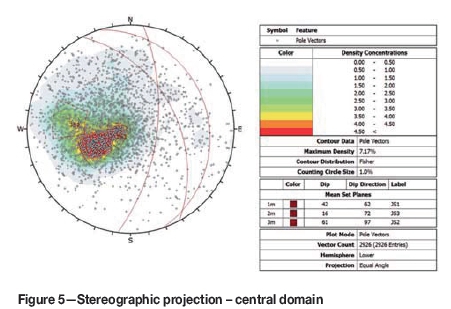
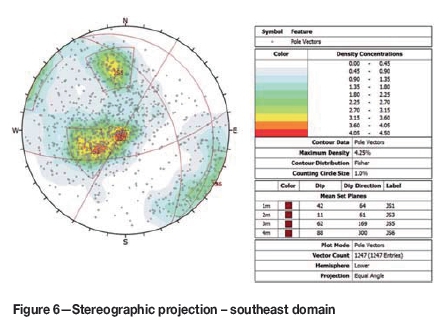
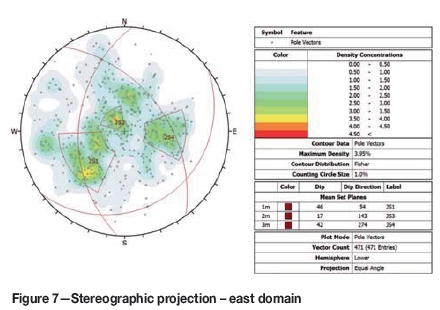
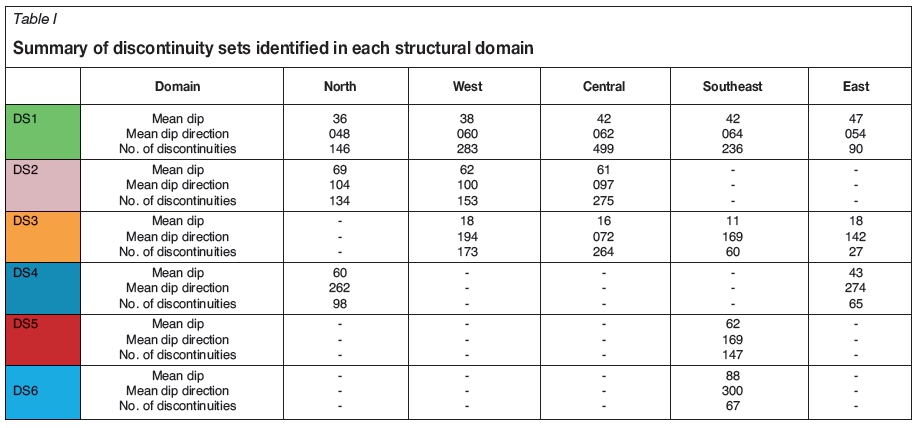
Based on discontinuity sets that were identified in the context of the large-scale structural model, structural domains were delineated for the proposed mining area. Wireline and structural logs from 34 drill-holes were used to identify five structural domains (north, west, central, south east, and east) and six discontinuity sets (Figure 2 to Figure 7 and Table I).
The local structural geology may be summarized as follows:
► Discontinuity set 1 (DS1) is a dominant set present across the project area and strikes parallel to the Nkwe Fault system (approximately 55°, dipping to the northeast), however is generally flatter dipping (Figure 2 and Table I.).
► Discontinuity set 2 (DS2) is a dominant easterly to southeasterly dipping set present in the north, west, and central domains. This set is parallel to the Kibaran-age structures, which form part of a system of closely spaced extensional faults that are developed across the central and western part of the project area. The Tshukudu and Nyati faults are included in this group.
► Discontinuity set 3 (DS3) consists of flat-dipping discontinuities, which are present across the majority of the project area.
► Discontinuity set 4 (DS4) is a westerly moderately dipping set present in the north and the east domains.
► Discontinuity set 5 (DS5) is a south-southeast dipping set present in the southeast domain.
► Discontinuity set 6 (DS6) is a minor discontinuity set based on data from two drill-holes and consists of steep dipping discontinuities present in the southeast domain, which may lead to slabbing in the sidewalls, depending on the direction of mining.
► The majority of discontinuities (69%) are roughly planar across the project area. Where discontinuities have infill, the infill is generally soft with fine sheared material.
► The majority of the boreholes used in the analysis have been drilled at a dip of approximately 85°, at various dip directions. This was ideal for the identification of DS1 and DS3, which are shallow dipping and are thus orientated almost normal to the borehole orientations (Table I).
► As DS2, DS4, DS5, and DS6 are more steeply dipping and are therefore orientated sub-parallel to the boreholes, note that these sets may be more prominent than is indicated (currently affected by directional bias).
Discontinuity set characteristics
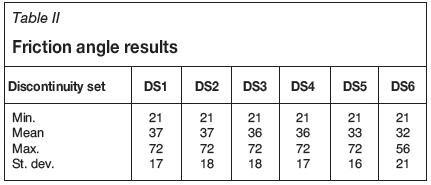
Discontinuity shear strength parameters were selected using Barton's (2002) equation, where the friction angle is based on the joint surface roughness and infill and discontinuities are considered to be cohesionless, as presented in Equation [1]:

where: Φ is the friction angle, Jr is the joint roughness and Ja is the joint alteration, according to Barton's 1974 Norwegian Q system (Barton, Lien, and Lunde, 1974). Friction angles determined for each discontinuity set are presented in Table II.
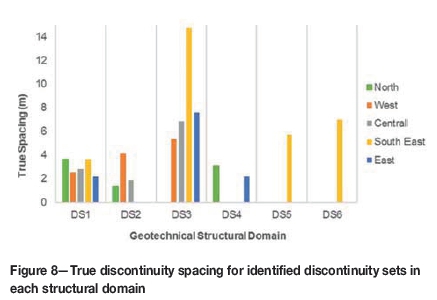
Discontinuity spacing was determined by calculating the apparent spacing between consecutive discontinuities for each set in their respective drill-holes. True discontinuity spacing was then calculated for each discontinuity set by adjusting the apparent spacing according to the orientation of the drill-holes. As data could only be collected from boreholes, note that a directional bias exists. This can be reduced by undertaking scanline mapping in various directions once mining commences.
The mean true discontinuity spacing determined for discontinuity sets across the project area is presented in Figure 8.
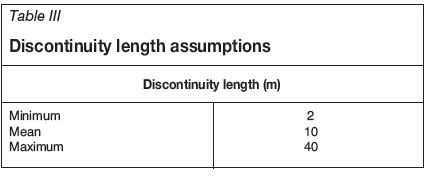
Structural data was obtained solely from drill-holes and therefore joint length data was not available. Joint lengths were assumed based on observations from adjacent projects in the area and are presented in Table III.
Keyblock stability analysis
A probabilistic keyblock stability analysis was conducted using JBlock (Esterhuizen, 2003) to assess the likelihood of rockfalls occurring considering proposed stope orientations and the defined structural domains. JBlock was developed to evaluate the potential for gravity-driven rockfalls using probabilistic methods to determine the dimensions of potential unstable blocks (known as keyblocks) and their interaction with support. JBlock creates and analyses a large number of keyblocks based on joint set characteristics, from which it derives a statistical failure distribution. The influence of various support types and patterns on the failure distribution can also be simulated. This approach thus allows for the relative hazard associated with various support designs or excavation orientations to be obtained (Esterhuizen and Streuders, 1998).
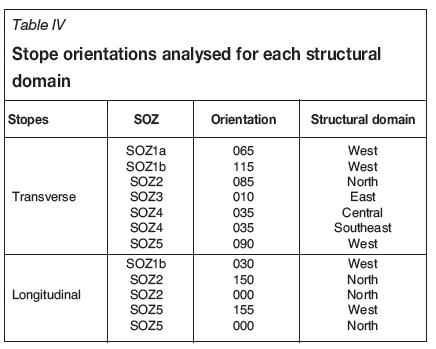
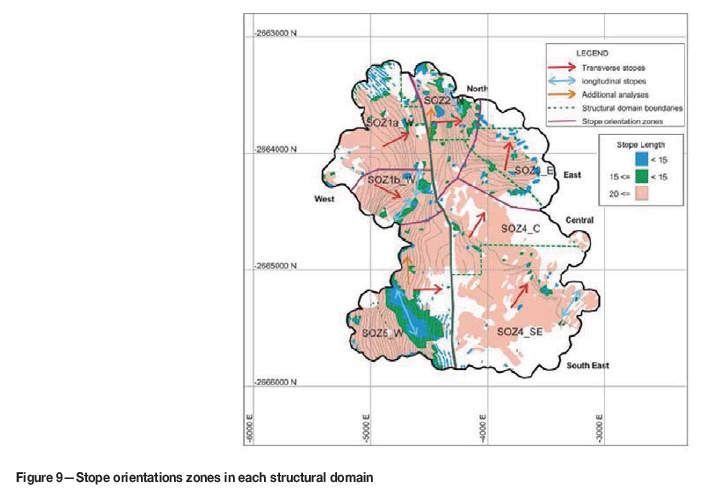
A keyblock analysis was conducted on proposed transverse and longitudinal stope orientation zones (SOZs) provided by the mine planning team. Transverse stopes are generally orientated at a high angle relative to the strike of the Tshukudu Fault, while longitudinal stope orientations are sub-parallel to the fault. Additional analyses were carried out on stopes orientated in a northerly direction.
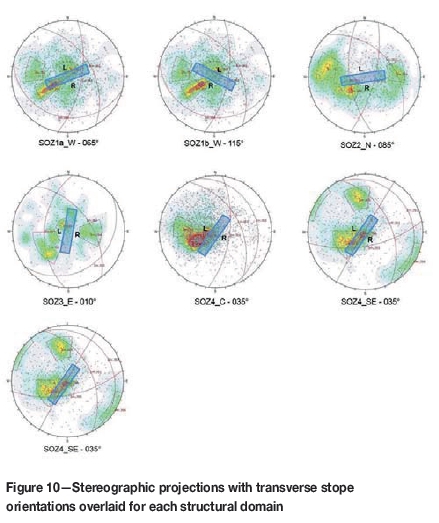
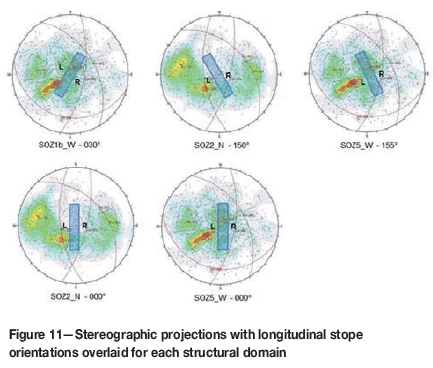
Stope orientations and structural domains that were analysed are indicated in Figure 9. Stopes orientations are schematically represented within the appropriate stereographic projections in Figures 10 and 11. A summary of the stope orientations analysed is presented in Table IV.
Keyblock generation
The first step in the analysis is the generation of keyblocks, based on the following information for each structural domain:
► Dip and dip direction of each discontinuity set (Table I.)
► Friction angles for each discontinuity set (Table II). Note that JBlock uses a truncated normal distribution to represent the discontinuities' friction angles. A minimum and maximum cut off of 15° and 75° were thus chosen based on the results from the friction angle calculations
► Discontinuity spacing for each set (Figure 8)
► Discontinuity trace lengths (Table III)
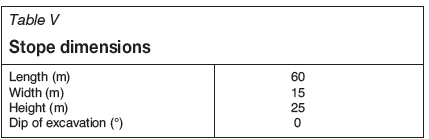
► Stope dimensions (Table V).
JBlock is limited in that it can analyse only one surface at a time (Dunn, Earl, and Watson, 2008). Keyblocks were therefore generated and analysed for three excavation surfaces independently and the results combined. While this provides a useful analysis, it should be noted that the blocks in corners of the stope are not taken into account. The excavation surfaces analysed are as follows:
► Left stope wall (without support)
► Right stope wall (without support)
► Back (with mesh and resin rebar support).
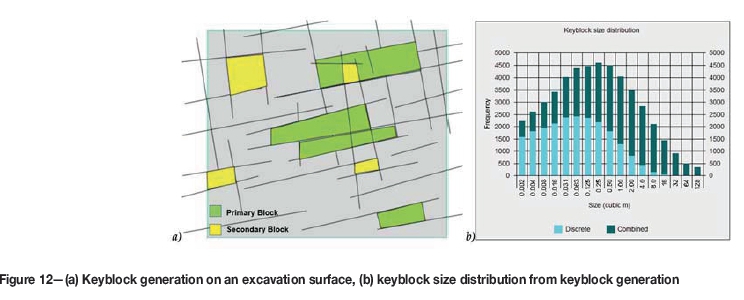
An example of the creation of keyblocks is illustrated in Figure 12a. A typical keyblock size distribution based on keyblock generation is presented in Figure 12b.
Rockfall simulation
Support patterns were applied to the backs with generated keyblocks in each SOZ. The support consisted of 3 m long, 150 kN bolts spaced at 1.5 x 1.8 m, with 750 kN/m grout and 15 kN/m2 mesh (support represents a 6 m wide arched profile drift above a 15 m wide stope). Jblock uses a very simple method to account for mesh and the mesh strength was set to ensure that the bulk of the smaller blocks are held in place.
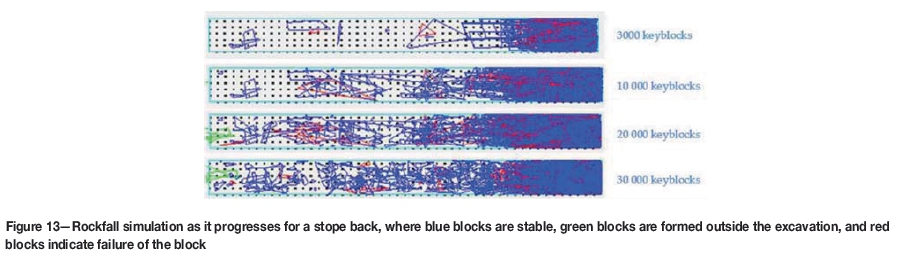
Rockfalls from the keyblocks, and the support pattern in the case of the stope back, were simulated for each SOZ. During a rockfall simulation a limit equilibrium analysis is performed on each of the keyblocks, which are placed in random positions within the walls or back of the stope to determine whether failure occurs or not. It then tests for support failure, failure between support, and rotational failure (Esterhuizen, 2003). Should failure occur, the exposed surface area from the rockfall is recorded, which allows the number of simulated rockfalls to be normalized.
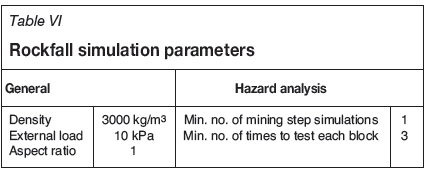
Additional input parameters required for the rockfall simulations are presented in Table VI. A rockfall simulation in progress is presented in Figure 13.
Results
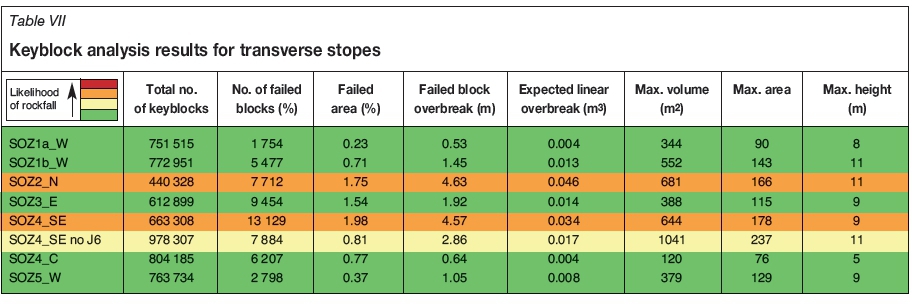
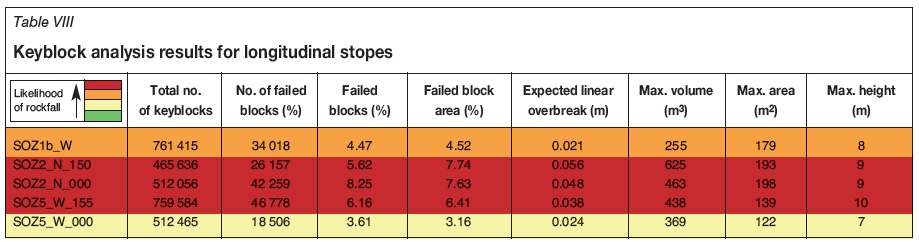
The results of the keyblock analyses are summarized in Tables VII and VIII, which indicate the combined results for the stope back and stope walls. Using these results, expected linear overbreak was calculated by dividing the fallout volume by the total area exposed for each SOZ. This is based on the ELOS (equivalent linear overbreak/slough) approach (Clark and Pakalnis, 1997).
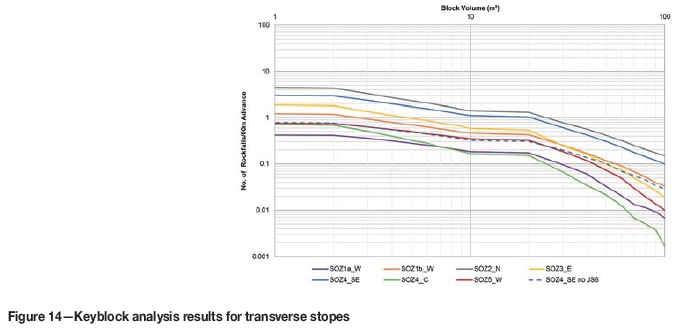
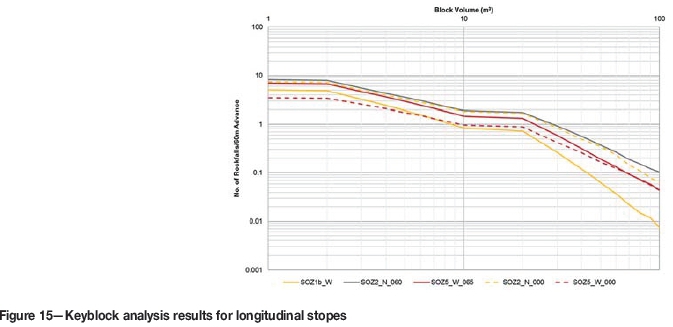
The resultant rockfalls normalized to a 60 m advance for a range of block sizes are presented in Figures 14 and 15 for the transverse and the longitudinal stopes. Note that these results combine the sidewalls and the back of the excavation. The simulated number of rockfalls was determined for block sizes from 0.1 m3 to 1 000 m3. Note that the results were normalized to rockfalls per 60 m advance using the fallout volume and the relevant stope dimensions.
Discussion
The following should be noted from the analysis.
Transverse stopes
► Large rockfalls are more likely to occur in SOZ2_N and SOZ4_SE compared with the rest of the stope orientation zones (more than one 10 m3 rockfall per 60 m advance).
► This is due to the discontinuity set orientations in the north and southeast domains which are ideally suited to form wedges with the orientation of the stope walls (Figure 10).
► Note that the southeast structural domain was also simulated with and without discontinuity set 6. This set was identified from data from two drill-holes, and is likely to be localized and consequently may have had too much of an influence on the overall result for SOZ4_SE.
► When simulated without DS6, the failed block area for SOZ4_SE reduced from 5% to 3%.
►Overall, the expected linear overbreak from geological structures for these stopes is low and unplanned dilution will not be a major concern.
► The risk of damaging incidents due to large rockfalls is more significant, especially in the walls, for SOZ2_N and SOZ4_SE, but this is considered manageable.
Longitudinal stopes
► Generally, one or more large (> 10 m3) rockfalls are expected per 60 m advance.
► Overall SOZ2_N poses the highest risk of all longitudinal orientations analysed.
► The expected linear overbreak is higher in the longitudinal stopes compared with the transverse stopes. This is expected due to the increased hazard associated with mining parallel to sub-parallel to the orientation of the Tshukudu Fault and associated discontinuity sets.
► The longitudinal stopes are less stable than the transverse stopes.
Conclusions
Based on the study the following may be concluded:
► There will be less hazard in excavating the transverse stopes in the orientations proposed compared with the longitudinal stopes.
► It would be unfavourable to mine in the longitudinal orientations due to the increased hazard associated with mining parallel to sub-parallel to the orientation of the Tshukudu Fault and associated discontinuity sets.
► Where stope orientations cannot be designed taking into consideration the orientation of major structures, keyblock analyses will also allow the testing of various support scenarios, which will assist in hazard reduction and allow for optimal support design.
► Once the mine is in operation, these analyses should be re-run with mapped data and calibrated with observations from mined stopes in each of the orientations. This will allow for a reduction in the uncertainties related to drill-hole data, such as discontinuity length and directional bias. This will also allow for the identification of localized joint sets and potential wedges/instabilities that may be present.
Keyblock analysis was used successfully as a design tool to assess the stability of the mining stopes at Platreef mine considering the dominant discontinuity sets and the structural domains identified across the project area. Outcomes of the study have provided Platreef mine with valuable information that will assist in the decision-making process when finalizing stope orientations and support requirements.
The risk of production delays and damage to machinery can be mitigated by optimizing the mining direction. This study also brings to light the importance of undertaking thorough structural analyses, which in this case greatly assisted in determining the results produced.
Acknowledgements
The management of Ivanhoe Mines and Ivanplats are thanked for funding the work and for permission to publish the results.
References
Barton, N., Lien, R., and Lunde, J. 1974. Engineering classification of rock masses for the design of tunnel support. Rock Mechanics, vol. 6. pp. 189-236. [ Links ]
Barton, N. 2002. Some new Q-value correlations to assist in site characterisation and tunnel design. International Journal of Rock Mechanics and Mining Sciences, vol. 39. pp. 185-216. [ Links ]
Brits, J.A.N. and Nielsen, S.A. 2015. Report on the structural interpretation of the farms Turfspruit and Macalacaskop. Ivanplats. 97 pp. [ Links ]
Clark, L. and Pakalnis, R. 1997. An empirical design approach for estimating unplanned dilution from open stope hangingingwalls and footwalls. Proceedings of the 99th Annual AGM-CIM conference, Vancouver, BC. CIM, Montreal. pp. 1-34. [ Links ]
Dunn, M.J., Earl, P., and Watson, J. 2008. Support design using probabilistic keyblock methods. Proceedings of the 6th International Symposium on Ground Support in Mining and Civil Engineering Applications, Cape Town. Stacey, T.R. and Malan, D.F. (eds.). Southern African Institute of Mining and Metallurgy. Johannesburg. pp. 623-636. [ Links ]
Dunn, M.J. and Stacey, T.R. 2008. Design of stable spans at Tau Lekoa Mine. Proceedings of the 1st Southern Hemisphere International Rock Mechanics Symposium. Potvin, Y., Carter, J., Dyskin, A.D., and Jeffrey, R. (eds.). Australian Centre for Geomechanics, Perth. pp. 179-192. [ Links ]
Dunn, M.J. 2010. The application of probabilistic keyblock methods for support design in blocky rock masses. Proceedings of the 2nd Australasian Ground Control in Mining Conference 2010, Sydney. Australia. Hagan, P. and Saydam, S. (eds.). Australasian Institute of Mining and Metallurgy, Melbourne. pp. 106-112. [ Links ]
Esterhuizen, G.S. 2003. JBlock User's Manual. Department of Mining Engineering, university of Pretoria. [ Links ]
Esterhuizen, G.S. and Streuders, S.B. 1998. Rockfall hazard evaluation using probabilistic keyblock analysis. Journal of the South African Institute of Mining and Metallurgy, vol. 98, no. 2. pp. 59-63. [ Links ]
Hattingh, E. and Hudson, T. 2016. Characterisation and description of the Tshukudu Fault influence zone. Ivanhoe Mines, Mokapane, South Africa. 17 pp. [ Links ]
Ivanhoe Mines. 2015. Report on the structural interpretation of the farms Turfspuit and Macalacaskop - zone 1 and zone 3, Platreef Project. Mokapane, South Africa. 86 pp. [ Links ]
Joughin, W.C., Jager, A., Nezomba, E., and Rwodzi, L. 2012. A risk evaluation model for support design in Bushveld Complex underground mines: Part I - Description of the model. Journal of the Southern African Institute of Mining and Metallurgy, vol. 112, no. 1. pp. 1-12. [ Links ]
SRK Consulting. 2016. Platreef 4Mtpa Feasibility Study. Section 5 - Underground Mining Geotechnical Investigation and Design. DRA Report Number 1051-EV-00-29. Johannesburg, South Africa. 95 pp. [ Links ]
Windsor, CR. and Thompson, A.G. 1992. Reinforcement design for jointed rock masses. Proceedings of the 33rd US Symposium on Rock Mechanics, Sante Fe. American Rock Mechanics Association, Alexandria, VA. pp. 521-530. [ Links ] ♦
This paper was first presented at the AfriRock 2017 International Symposium, 30 September -6 October2017, Cape Town Convention Centre, Cape Town.

