


Services on Demand
Article
 English (pdf)
 Article in xml format
 Article references
Indicators

Related links
-
 Cited by Google
 -
 Similars in Google
Share

 Permalink
Journal of the Southern African Institute of Mining and Metallurgy
On-line version ISSN 2411-9717
Print version ISSN 2225-6253
J. S. Afr. Inst. Min. Metall. vol.118 n.2 Johannesburg Feb. 2018
http://dx.doi.org/10.17159/2411-9717/2018/v118n2a9
PAPERS OF GENERAL INTEREST
Modelling coal pillar stability from mine survey plans in a geographic information system
M. Mathey
Associate to the Wits Mining Institute, University of the Witwatersrand, South Africa
SYNOPSIS
A practical method for analysing the individual stability of large numbers of pillars in bord-and-pillar workings based on mine survey plans is outlined. The procedure aims at modelling pillar safety factors and failure probabilities under tributary area loading assumption in a geographic information system.
The mining dimensions and geometries, as available from mine survey plans, are processed in a quasi-3D mine model. Analytical solutions are implemented in the model so as to predict the stability of each individual pillar and its time-dependent deterioration due to scaling. Thus a dynamic analysis is achieved, which gives a good estimate of the risk associated with abandoned mine sites over time. The results can be projected back onto mine survey plans in order to provide an overview of the areal distribution of stability and instability in the underground panels. The limitations and accuracy of the model are discussed.
The proposed pillar stability model is applied to real mining situations, including a case of pillar collapse, so as to verify the validity of the technique.
Keywords: pillar stability, safety factor, GIS, modelling.
Introduction
An underground bord-and-pillar coal mine can, over a lifetime of a few decades, result in several tens of thousands of pillars being left behind in its abandoned workings. For South Africa, the total number of coal pillars in abandoned workings is estimated to be in the region of 6 million (van der Merwe and Mathey, 2013a).
Currently, there are 98 cases known in which isolated but large groups of pillars have collapsed (van der Merwe and Mathey, 2013b). Consequently, large subsidence troughs occur on surface, potentially endangering infrastructure, housing, and ultimately lives. The prediction of long-term instabilities in underground workings therefore becomes imperative for regional development planning, and is also compulsory for mining companies in order to obtain mine closure certificates.
The challenge in assessing pillar stability-related risk is to take into account the great number of pillars, their individual dimensions, geometries, and deterioration over time. One can imagine that an unfavourable combination of these factors may cause localized areas of weakness in the underground panels. Those areas can eventually trigger a collapse, which subsequently may spread towards stronger regions within the same panel. Such examples have been discussed in the literature (Mathey, 2010, 2013; Mathey and Schulte, 2011).
It is apparent that an extensive risk assessment for abandoned mine sites is required that allows fast and detailed access to spatial information. Furthermore, the longterm stability of underground panels needs to be analysed in high resolution, i.e. on an individual pillar-by-pillar basis. In this paper the use of a geographic information system to address issue is proposed.
Methodology
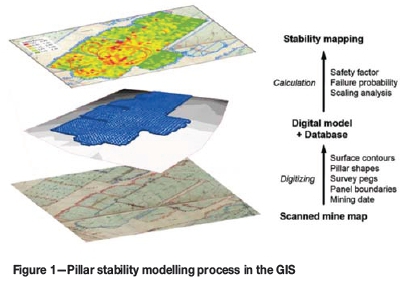
The principal methodology underlying the pillar stability analysis is to pick up mining dimensions, geometries, and dates from the original survey plans and process the data in a quasi-3D digital mine model, making use of a geographic information system (GIS). Within this model, individual safety factors are determined for each pillar in the underground workings.
Empirical equations are implemented to predict pillar scaling, giving the expected deterioration of pillar size over time. Thus a dynamic risk assessment for pillar-related stability problems is obtained. All static and dynamic, measured and inferred information related to a pillar is stored in a relational database.
Finally, the analytical results are projected back onto maps in order to facilitate the use of stability-related information by mine personnel. Surface structures can be included on these maps, so as to provide a comprehensive and detailed basis for assessing the risk involved with abandoned mine sites over time. The modelling methodology is schematically shown in Figure 1.
Pillar stability modelling
The GIS pillar stability model
The analytical procedure aims at modelling pillar safety factors under tributary area loading conditions. All relevant geometrical and time-related mining information is derived from the original underground survey plans. The work flow and data types used in the modelling exercise are diagrammatically shown in Figure 2.
A prerequisite for the modelling exercise is therefore that the relevant information is available in digital format, i.e. that elevation contours of the land surface, the outline of coal pillars, panel boundaries, survey points, and quarterly boundaries of the mining advance are digitized precisely in the GIS. Furthermore, any digitized feature needs to be attributed with relevant information (e.g. surface contour lines with elevation values, survey points with mining height and roof elevation values, etc.).
Once all data is available in digital format, a quasi-3D model of the underground workings can be created in the GIS. Geostatistical modelling techniques are adopted in order to create digital elevation models for the land surface and the coal seams. They are also used to interpolate a model for the mined height in the underground workings from available survey points.
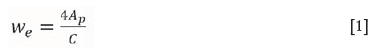
The GIS software is then programmed to assign the essential pillar design parameters, i.e. the individual mining depth below surface H, the pillar height h, and effective square width we, to each individual pillar in the database. The latter parameter may be calculated from the pillar base area Ap and circumference C according to the equation provided by Wagner (1980):
At this stage, the database only suffices for modelling the individual pillar strength from the pillar's effective square width and height and the assumption of an empirical pillar strength equation. Pillar stability, however, is commonly judged based on the concept of a safety factor, the ratio of strength versus load.
Pillar loading
It is good engineering practice to estimate the load on pillars in a bord-and-pillar coal mining based on the so-called tributary area theory (TAT). Here, each individual pillar in a panel is assumed to support the full overburden weight immediately above it, plus a share of the rock mass above its unsupported surrounding roadways. It should be noted that this loading assumption is a worst-case scenario, which makes it safe to use in risk assessment, even though it may overestimate actual pillar loads to some extent.
Nevertheless the validity of the TAT is generally accepted for mining layouts in horizontal or near-horizontal seams with a regular pattern of fairly square pillars, and where the panel span is greater than the depth of mining (Salamon and Oravecz, 1973; Abel, 1988). These conditions are usually fulfilled in South African coal mining.
Roberts et al. (2002) investigated loading conditions in bord-and-pillar coal mines by means of parametric numerical modelling. They concluded that the loading of pillars is relatively insensitive to the overburden stiffness (in ranges of 1.5-15 GPa), but that the TAT becomes increasingly inaccurate as the span-to-depth ratio drops below 1.25 and the panel extraction rate exceeds 65%. Beyond those limits, the error in pillar load estimation becomes greater than 5%. At extraction ratios exceeding 75%, the error is greater than 10% and increases rapidly (Roberts et al., 2002).
Based on the database for South African coal mining (van der Merwe and Mathey, 2013b), it is estimated that about 85% of all panels ever mined in the country fall into a range of less than 75% extraction, and therefore it can be expected that using the TAT for pillar load estimation is reasonably accurate in most cases. In cases of higher extraction, it will err on the safe side.
The tributary pillar loading can be modelled in GIS as follows. First, the pillar centre points are computed for each individual pillar shape. Then a centroidal Voronoi tessellation based on the distribution of all pillar centre points in a mining panel determines the individual tributary pillar loading areas AL. A graphic of the result of this procedure is shown in Figure 3.
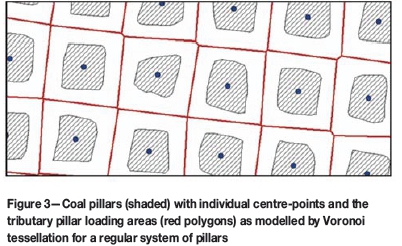
It should be noted that the TAT and the determined Voronoi polygons give the correct estimate of the tributary loading areas only when the arrays of pillars in a panel are set out in a regular, checkerboard-type pattern and the pillars are of more or less uniform size, as seen in Figure 3.
The TAT is therefore likely to be inaccurate in panels where geological weaknesses in the coal or the overburden were approached during the mining activities and the panel layout became irregular. For such situations it can also be anticipated that not only the loading, but also the strength conditions of the pillars, is disturbed and cannot be taken into appropriate consideration by the simple means employed in this analysis; or, in fact, by commonly used methods in the mining industry.
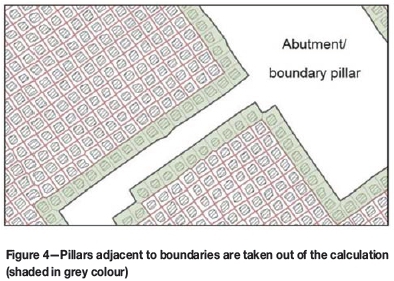
In situations where pillars are located adjacent to the abutment or large boundary pillars, the TAT is again not applicable. This is due to the circumstance that a great portion of the load is transferred away from these relatively small pillars to the overall larger abutment or boundary pillars nearby. Consequently, the TAT overestimates the load on those pillars. A more probable loading condition can be estimated only by a numerical analysis of the situation, where the relative pillar dimensions and distances, the thickness of the overburden strata, and the stiffness of the overburden and pillars are taken into account. In the GIS model, it might be justified to omit all pillars that are immediately adjacent to boundaries from the calculation to avoid a misinterpretation of the results (Figure 4).
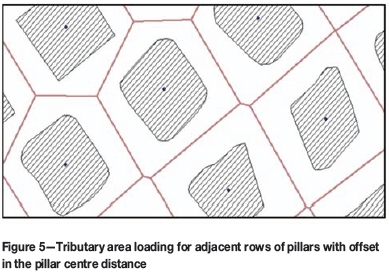
However, other minor irregularities such as small offsets between rows of pillars, which cause a localized disturbance in the regularity of pillar arrays, can be taken into account in the loading prediction made in the GIS model. The loading conditions modelled in GIS may agree with the real loading conditions satisfactorily, as shown in Figure 5.
Pillar scaling analysis
The strength of coal pillars deteriorates over time, owing mainly to scaling on the pillar sidewalls. This phenomenon is due to the formation of fractures in the pillar 'skin' that migrate progressively inwards as soon as the fractured coal fragments detach from the sidewalls. Consequently, pillars decrease in width and may fail after some time at a smaller safety factor than the original 'as-built' safety factor. For a dynamic risk assessment, it is imperative to implement different pillar scaling scenarios in the GIS model.
A method to predict the amount of scaling and the related weakening of pillars in South African coal mines was proposed by van der Merwe (2003, 2004). He derived scaling prediction formulae for different South African coalfields based on observations on the age and initial dimensions of failed pillars, and verified the formulae by on-site measurements of scaling pillars.
It is important to note from van der Merwe's (2004) work that measurements of scaling pillars did not show any preferential direction for scaling. Neither have pillar corners been observed to spall significantly more than pillar mid-areas.
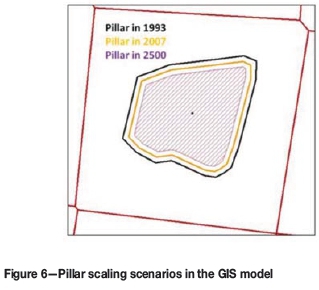
Van der Merwe's scaling equations are implemented into the GIS model to predict the individual amount of pillar scaling for a number of desired time stages after mining. The original 'as-built' pillar shape is then buffered by the calculated amount of scaling in order to reduce the pillar in size, as it is demonstrated in Figure 6. For each scaling step, a new effective pillar square width and safety factor is calculated.
Pillar strength and stability analysis
The safety factor calculation follows the conventional concept of strength-to-load ratio, SF = os/ol. For the calculation of the individual pillar strength an appropriate equation must be chosen, e.g. the formula from Salamon and Munro (1967):

or, for improved accuracy, the recently updated version by van der Merwe and Mathey (2013c):

When using any of the empirical formulae, one should remember that a correction applies for pillars that have been mined with continuous miners instead of drilling and blasting (van der Merwe and Madden, 2010).
The pillar's tributary area load ol is given by Equation


where the coefficient 0.025 is the unit weight of sedimentary strata in MN/m3.
For South African collieries, a link between the pillar safety factor and the probability of failure in practice was established (van der Merwe and Mathey, 2013). If pillar safety factors are calculated with the updated maximum likelihood strength formula as shown in Equation [3], the link with the failure probability PoF [%] is as follows:
The implementation of a failure probability model in GIS assists in quantifying the likelihood of a pillar collapse and improves the risk assessment exercise. Therefore, it should be incorporated in the GIS pillar model as well.
GIS pillar database
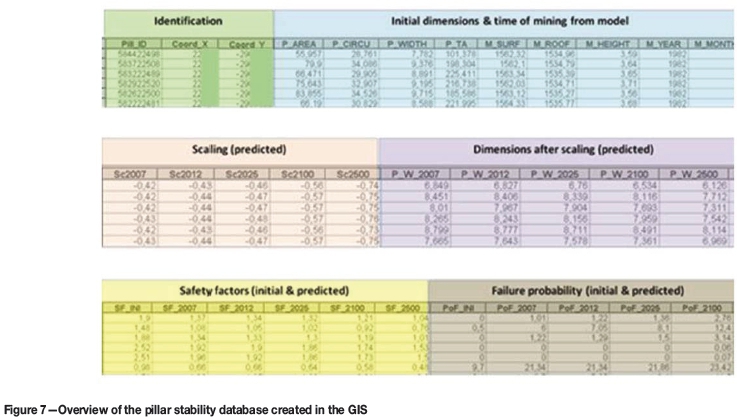
All information related to the stability of the underground pillars is stored in a relational database in the GIS. The database is structured in six blocks as follows (Figure 7).
►Pillar identification-Each pillar in the database is identified through its centre-point coordinates and a uniquely assigned pillar ID.
► Mining dimensions-The essential geometrical features of pillars, i.e. the base area, circumference, effective square width, and height are stored in the database. Linked to this information is the predicted individual tributary loading area. The pillars depth below surface is the distance between the surface and mine roof elevation at the position of the pillar. The age of the pillar is determined from the year and quarter in which the panel was mined.
►Amount of pillar scaling-The amount of pillar scaling is determined individually from the pillar age and height.
► Pillar dimensions after scaling-Pillar scaling is modelled according to the individually predicted amount of scaling, as previously shown in Figure 6. From the resulting outlines of pillars after scaling, the new effective pillar square width is calculated and stored in the database.
►Pillar safety factors-Pillar safety factors are calculated for the initial 'as-mapped' pillar dimensions and for each scaling step in time.
►Pillar failure probability-If available, the failure probability (%) of the individual pillars can be linked to the calculated safety factors for any step in time.
The pillar database is the core of the GIS model and can be subjected to a wide range of queries; for example, on the safety factors or failure probabilities of selected pillars or for the statistical distribution characteristics of the same within a mining panel. All relevant information can be mapped back onto the original survey data in order to get an impression of the distribution of regional stabilities and instabilities. In conjunction with existing or planned surface infrastructure, this provides the basis for a comprehensive risk assessment. Some practical examples of the modelling procedure are presented at the end of this paper.
Accuracy of safety factor calculations based on survey plans
Some considerations must be given to the general accuracy of safety factor predictions based on survey plans, which are the basis of the GIS model.
Possible sources of error in the safety factor prediction may arise from the underground measurements of the mining dimensions and the quality of mapping. The typical scale of survey plans for South African collieries is 1:1500, which is rather unsuitable for an accurate mapping and reading of pillar sizes. It must be borne in mind that 1 mm of inaccuracy in mapping or reading would reduce or increase the interpreted pillar size by 1.5 m. Further sources of inaccuracies may be found in the GIS model, where digitized, and therefore to some extent modified, data is used. An unavoidable source of error is introduced through the interpolation and extrapolation of point-type information such as underground mining heights and elevations from singular survey points.
The magnitude of possible inaccuracy that results in the predicted pillar safety factor calculation from all these factors can be determined only if the error in all the input data is known. This is rarely the case. For example, assume a scenario where a mining depth below surface of H = 80 m and pillars of width w = 10 m, h = 4 m, and centre distance of D = 16 m are measured from the survey plan. Further assume that each parameter is accompanied by a possible (not definite) inaccuracy of e(w) = e(D) = 1 m and e(H) = e(h) = 0.3 m. The pillar safety factor formula based on the updated maximum likelihood strength equation presented is:
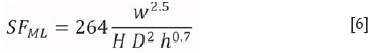
For the given scenario a value of SF = 1.54 is determined. The possible inaccuracy of the determined safety factor, e(SF), can then be estimated based on the law of error propagation:
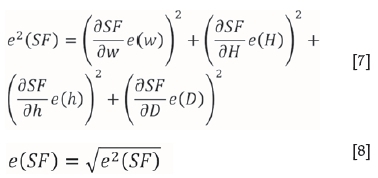
where (əSF/dw), (əSF/dH), (əSF/dh), and (əSF/əD) are the partial derivatives of the safety factor equation.
In the given scenario, the estimated possible inaccuracy is e(SF) = 0.44 or 28% of the safety factor (the same result is obtained when Equation [2] is used to calculate the safety factor). This is unfavourable for a risk assessment, although it is believed to be unavoidable for any pillar stability analysis that is based on survey plans only. The magnitude of possible error must be kept in mind when any risk-related judgements and decisions are made.
Nevertheless, the possible error should remain practically the same for all underground pillars in a panel or region with similar mining dimensions. The predicted safety factors will therefore serve well for locating groups of comparatively weak pillars in the panel. Hence, trigger areas for a possible pillar collapse can be predetermined, which in return allows for prioritizing of preventative steps in risk management.
Application to case studies
The proposed GIS-based pillar stability analysis method has been applied to mine survey data from a bord-and-pillar coal mine in South Africa. This exercise also provided the opportunity to back-analyse a case of pillar collapse in high resolution, i.e. on a pillar-by-pillar basis, and to check the validity of the stability predictions made in the model. For safety factor calculations, the updated van der Merwe and Mathey coal pillar strength formula (Equation [3]) was used.
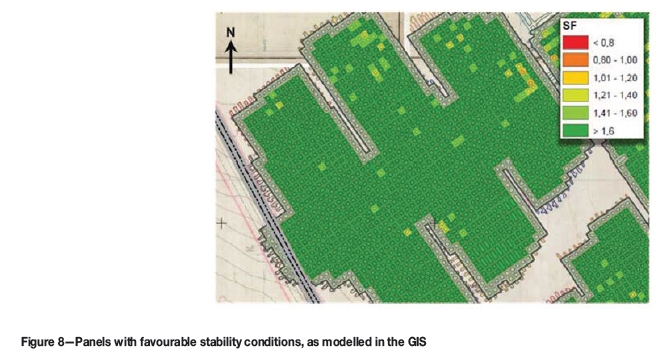
In the following sections, the results from the modelling exercise are presented in the form of maps, displaying the predicted pillar safety factors according to a traffic-light colour scheme. The assumption is made that a pillar safety factor of 1.4 or higher is desirable in a pillar stability risk assessment (green), while any safety factor less than unity indicates an increased risk for instabilities (red). Intermediate values are displayed in shades of yellow.
It should be understood that the stability of pillars is assessed on an individual basis, but that the performance of many adjacent pillars in a panel depends on its stability or instability. For instance, it is very unlikely that a single weak (yellow/red) pillar situated within an overall competent (green) pillar environment will cause the panel to collapse. This is because relatively weak pillars can shed excess load which is taken up by adjacent, stronger pillars. Experiences of surface subsidence due to bord-and-pillar mining show that it takes a relatively large number of adjacent weak pillars to trigger a pillar collapse.
One example of an overall stable panel is shown in Figure 8. One observes that the pillar safety factors are very favourable, with values well above 1.6. Only in isolated cases does the predicted pillar safety factor drop below 1.4.
The available mine survey data also provides an opportunity to back-analyse a pillar collapse event. This assisted in verifying the reliability of the predicted safety factors and gaining insight into the mechanism responsible for pillar failure in the case study.
The collapsed panel under consideration was mined in the 1980s through drilling and blasting at a shallow depth of 35-55 m below surface. Pillars were intended to be designed with a safety factor of 1.6, but the mapped pillar dimensions were found to deviate significantly from this design guideline.
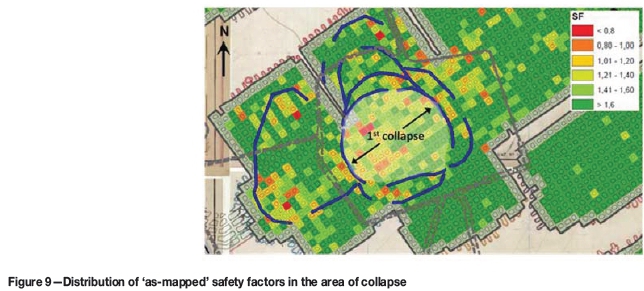
On the event of the initial collapse, about 30 years after mining the panel, a near-circular subsidence trough with a diameter of 200 m was observed on surface. The pillar collapse spread in the subsequent three years for a further 200 m into neighbouring panels. Figure 9 shows the calculated distribution of pillar safety factors at the time of mining and the outline of the subsidence trough at various development stages (blue lines).
Analysis of the as-mapped stability situation in the relevant panels on a pillar-by-pillar basis reveals a large group of distinctly weak pillars in the centre of the collapsed panel. Pillars inside the area of the initial collapse are predicted to have an average safety factor of 1.35. Some pillars are indicated with safety factors of less than 0.8. The neighbouring panels in the north- and southeast exhibit more favourable stability conditions. It can thus be concluded that the trigger area for the original collapse was already predestined at the time of mining.
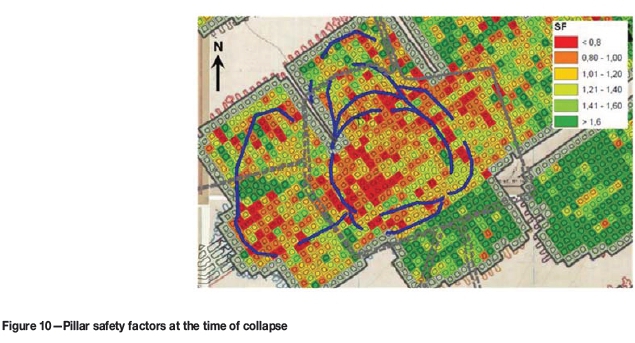
The scaling analysis was then applied to approximate the stability situation at the time of collapse (Figure 10). The average amount of scaling that acted on the pillars until the collapse occurred was predicted to be about 0.4 m along the pillar circumference.
After scaling, those pillars in the area of initial collapse exhibit a safety factor range of 0.4-1.6, with an average safety factor of 0.9. This prediction can be regarded as being remarkably accurate, considering that the nominal safety factor of pillars at failure should be just below unity. The reason why some individual pillars could maintain an extraordinary low safety factor up to the time of collapse can probably be attributed to the phenomenon of load-shedding, since enough pillars with relatively larger safety factors were existent in this area.
Figure 10 also explains why the collapse spread mainly towards the north and west, where larger groups of relatively weak pillars were situated. It can also be seen why the failure did not extend to the small panel in the southeast, as still enough pillars with safety factors of about SF 2.0 and higher can be found there.
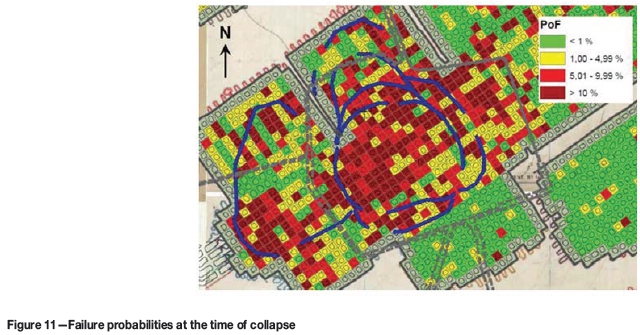
It is also useful to look at the situation from a risk point of view. The link between the pillar safety factor and the failure probability, as given in Equation [5], can be applied to quantify the risk involved. Figure 11 plots the areal distribution of predicted pillar failure probabilities (PoF) in the collapsed zone at the time of pillar failure. It is observed that the bulk of pillars in the collapsed area exhibit values of PoF >5 %, and frequently even in excess of 10%. The uncollapsed panel in the southwest, however, is predicted to be in favourable stability conditions with PoF <1 %.
Conclusions
A practical method for analysing the stability of large numbers of pillars based on mine survey data has been demonstrated. A geographic information system (GIS) was devised for processing the spatial and physical parameters of mining with the aim of calculating individual pillar safety factors and to predict the impact of pillar scaling over time.
The main advantage of the method is that each pillar in a mine is evaluated individually, quickly, and easily, as opposed to using an average number for a panel as a whole. This provides the ability to identify zones of suspect stability in a panel. This is further facilitated by visualizing the predicted stability parameters, e.g. safety factors or failure probabilities, in the GIS on the digital survey plans. In conjunction with spatial information on surface infrastructures, these plans provide the basis for a comprehensive risk assessment.
It has been shown that any pillar stability analysis based on mine survey plans is subject to some level of uncertainty. The application of the proposed modelling procedure to the back-analysis of a pillar collapse, however, established confidence that both the time-dependent weakening of pillars and their related safety factors can be determined with reasonable accuracy in the GIS model. The average factor of safety of the group of collapsed pillars was predicted as just below unity, where pillar failure would normally occur. Also, the risk maps created by the software gave a satisfying prediction of the location of pillar failure and the extent of its subsequent spread.
References
Abel, J.F. 1988. Soft rock pillars. International Journal of Mining and Geological Engineering, vol. 8. pp. 215-248. [ Links ]
Mathey, M. 2010. A contribution to risk assessment for abandoned bord and pillar mining in shallow depth. Proceedings of the 14th International Congress of the Societyfor Mine Surveying, Sun City, South Africa, 24-27 September 2010. [ Links ]
Mathey, M. 2013. Addressing the challenges involved with abandoned underground coal mines in South Africa. Proceedings of the 15th International Congress of the Societyfor Mine Surveying, Aachen, Germany. [ Links ]
Mathey, M. andSchulte, R. 2011. GIS-based risk management for abandoned bord and pillar mining in South Africa. Proceedings of the Energy & Resources Conference, Freiberg, Germany. (in German). [ Links ]
Roberts, D.P., van der Merwe, J.N., Canbulat, I., Sellers, E.J., and Coetzer, S. 2002. Development of a method to estimate coal pillar loading. SIMRAC COL 709 research report. Safety in Mines Research Advisory Committee, Johannesburg. [ Links ]
Salamon, M.D.G. and Oravecz, K.I. 1973. Rock mechanics in coal mining. Research Report no. 26/73, Collieries Research Laboratory. Chamber of Mines of South Africa, Johannesburg. [ Links ]
Salamon, M.D.G. and Munro, A.H. 1967. A study of strength of coal pillars. Journal of the South African Institute of Mining and Metallurgy, vol. 67 pp. 55-67. [ Links ]
Van der Merwe, J.N. 2003. Predicting coal pillar life in South Africa. Journal of the South African Institute of Mining and Metallurgy, vol. 103, no 5. pp. 293-301. [ Links ]
Van der Merwe, J.N. 2004. Verification of pillar life prediction method. Journal of the South African Institute of Mining and Metallurgy, vol. 104, no 11 . pp. 667-675. [ Links ]
Van der Merwe, J.N. and Madden, B.J. 2010. Rock engineering for underground coal mining. Special publication no. 8 (2nd edn). Southern African Institute of Mining and Metallurgy, Johannesburg. [ Links ]
Van der Merwe, J.N. and Mathey, M. 2013a. Probability of failure of South African coal pillars. Journal of the Southern African Institute of Mining and Metallurgy, vol. 11 3, no. 11 , pp. 825-840. [ Links ]
Van der Merwe, J. N. and Mathey, M. 2013b. Update of coal pillar database for South African coal mining. Journal of the Southern African Institute of Mining and Metallurgy, vol. 113, no. 11. pp. 825-840. [ Links ]
Van der Merwe, J.N. and Mathey, M. 2013c. Update of coal pillar strength formulae for South African coal using two methods of analysis. Journal of the Southern African Institute of Mining and Metallurgy, vol. 113, no. 11. pp. 841-847. [ Links ]
Wagner, H. 1980. Pillar design in coal mines. Journal of the South African Institute of Mining and Metallurgy, vol. 80. pp. 37-45. [ Links ] ♦
Paper received Nov. 2015
Revised paper received Apr. 2016

