


Serviços Personalizados
Artigo
 Inglês (pdf)
 Artigo em XML
 Referências do artigo
Indicadores

Links relacionados
-
 Citado por Google
 -
 Similares em Google
Compartilhar

 Permalink
Journal of the Southern African Institute of Mining and Metallurgy
versão On-line ISSN 2411-9717
versão impressa ISSN 2225-6253
J. S. Afr. Inst. Min. Metall. vol.118 no.2 Johannesburg Fev. 2018
http://dx.doi.org/10.17159/2411-9717/2018/v118n2a6
PAPERS OF GENERAL INTEREST
3D analysis of longwall face stability in thick coal seams
G. SongI; Y.P. ChughII, III
ISchool of Civil Engineering, North China University of Technology, Beijing, China
IIDepartment of Mining and Mineral Resources Engineering, Southern Illinois University Carbondale, United States
IIINational Academy of Inventors, United States
SYNOPSIS
Face falls remain the most difficult engineering problem in single-cut longwall mining. In this paper we investigated mining of two adjacent longwall faces using 3D nonlinear analysis, to obtain a better understanding of the stress distribution around excavations and development of failed zones. The gob loading behaviour was included by applying a variable force to the roof and floor behind the longwall face. The results show that:
(1) Face failures developed in the upper portion of the face extend deeper ahead of the mined face than those in the bottom portion
(2) Stress distribution and development of yielded zones ahead of the coal face vary along the panel width
(3) The maximum vertical stress concentration factor (VSCF) ahead of the longwall face occurs around the middle section of the panel width
(4) The middle section of a longwall face also experiences the most failed zones in the unmined coal
(5) The previously mined-out face increases the VSCF and volumes of failed zones in the adjacent longwall face; however, the effect extends only a short distance along the width of the panel close to the previously mined-out panel
(6) With increasing seam height, the stiffness of the coal face is reduced and therefore the longwall face carries less vertical load, but it deforms more and the yielded zones are larger
(7) With decreasing GSI of the mined seam mass, the cohesion and angle of internal friction are reduced, resulting in a lower vertical stress concentration factor and larger yielded zones spatially ahead of the face.
Keywords: thick coal seam, longwall mining, numerical modelling, face stability, gob, vertical stress concentration factor, yielded zones.
Background
Thick coal seams (seam height larger than 3.5 m) account for about 44% of the proven coal reserves and about 40% of the annual coal production in China (Wang, 2009). For economic reasons, longwall mining methods are employed for mining such seams. Singlecut longwall mining offers advantages over multiple-slice top caving methods from the points of view of mining operations, mine ventilation, coal recovery, and safety. However, this mining system may result in face falls and other ground control problems. Since the height of single-cut longwall faces has increased to 7-8 m in recent years, the risk of face falls has increased considerably, resulting in safety, production, and productivity concerns (Song, 2016). Face fall is likely to occur as illustrated in Figure 1a, but the steel plate against the face holds the coal in place and maintains the structural stability of the longwall face. In the incident shown in Figure 1b, large coal blocks fell from the longwall face and the mining operation was halted. Face falls can also result in fatalities. Therefore, face falls must be controlled scientifically to improve mine planning and safety. This paper is focused on the analysis of such falls.

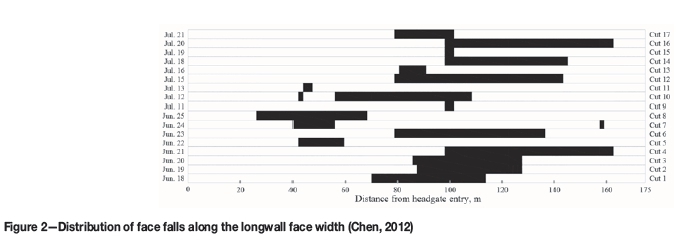
Currently, the longwall face advance rate in China is about 10-15 m (or more) per day. In some coal mines face falls occur in every single cut of the longwall face, which slows the rate of face advance. In Panyi coal mine of Anhui Province, face falls and roof falls ahead of face supports were observed during a working period of 14 days (Chen, 2012) (Figure 2). Face falls occurred every observation day, interrupting the mining operations and coal production. The middle section and tailgate side of the longwall face experienced the most face falls. Other field observations revealed that face falls typically extended less than 2 m ahead of the face, and that deeper extension of face fall was found during the periodic roof weighting and/or on longwall faces with greater mining thickness (see Figure 3).
Research hypothesis, goal, and specific objectives
Vertical stress redistribution following the excavation of a longwall panel has been discussed in depth (Whittaker, 1974; Wilson, 1983; Peng, 1984). The initial stress is redistributed around the longwall face with development of abutment loadings ahead and behind the face and development pillars on both on the headgate and tailgate sides. The vertical stress redistribution in abutment loading areas is shown in Figure 4 (Whittaker, 1974). The abutment pressures on the coal face and in the ribs of chain pillars decay to the original vertical stress level as the distance from the face line and rib edge increases. The vertical loading in the gob area is gradually reestablished to the pre-mining vertical stress level behind the face upon consolidation of gob materials and their ability to sustain more load. The loading characteristics of the gob materials can have a major influence on the front abutment pressure and face stability.

A better scientific understanding of distribution of stress in and around the longwall face and failed areas is needed to effectively solve the problem. We analysed the 3D stress distribution and failed areas numerically using nonlinear analysis with FLAC 3D software. This software is based on the finite difference approach and is extensively used globally for mining applications (Itasca, 2012). The analyses involved two adjacent longwall faces with a coal pillar left between the two panels (longwall panels 1 and 2 in Figure 5), and a consideration of gob loading behavior behind the face. Both longwall panels 1 and 2 represent half of the original panel width in the studied mine site. The positive Y-direction represents the direction of face advance in the figure. The modelled mining system is similar to that practiced in China. The influence of a mined-out area of a previous longwall face (longwall panel 1) on the adjacent current longwall face (longwall panel 2) is also included (the influence of mining sequence on face failure). This investigation has two goals: (1) to develop a realistic 3D numerical model of two adjacent longwall faces with a consideration of gob loading characteristics and nonlinear rock mass properties; and (2) to perform sensitivity studies of selected variables to understand their influence on stress distribution and the development of yielded zones in unmined coal in different areas of the longwall face.

The face failure modes may be divided into structural failure and functional failure (Song, Chugh, and Wang, 2017). Stress normally exceeds peak coal strength in abutment pressure zones around the longwall face. The coal mass in some areas around abutment zones may fail (fracture or yield), while in other areas it may not fail since it is relatively confined laterally and unable to deform. When the shearer cuts into the coal face, the confinement is lost and the face may fail. The face protection plate in the front edge of the roof supports increases confinement and is therefore utilized in field practice to improve stability of the face. Upon the failure of the coal and rock mass in the abutment pressure zones, the maximum front abutment stress would shift forward ahead of the face into the more competent rock and coal mass. The local failure of the coal mass may not, however, lead to face falls on a longwall face, and the coal may remain relatively stable and maintain its integrity for a short period of time without affecting mining operations. This is considered a 'structural failure' of the longwall face. 'Functional failure', on the other hand, refers to the state where face falls occur and production and the safety of miners is affected. The depth of structural failure ahead of the longwall face typically depends on the seam height, engineering properties of the coal and immediate roof and floor, loading characteristics of the gob, and the performance of roof supports. Structural failure may extend 0.5-2 m ahead of the longwall face and normally ceases beyond the point where abutment pressure achieves the peak value, while extension of functional failure should be less than or equal to that of the structural failure. Since structural failure increases the likelihood of functional failure, efforts to control face falls should emphasize reducing structural failure.
Previous research
3D numerical modelling of longwall face failure has been extensively pursued (Niu, Chen, and Liu, 2010; Song et al., 2011; Tian et al., 2012). In the previous models, the coal face is advanced through a certain distance and sensitivity studies are then performed to analyse the influence of seam height, depth of cover, seam inclination, and geological disturbance (such as a fault) on the stability of longwall faces. Therefore a broad-based observation on how these factors affect face stability has been discussed. However, these previous models did not include modelling of gob loading following the excavation of the coal seam and the creation of the mined-out void. Face stability modelling using 2D analyses has also been performed with incorporation of gob behaviour (Bai et al., 2014, 2016; Song, Chugh, and Wang, 2017). The section modelled in 2D analysis is, however, located too far from the gate ends to be influenced by the previously mined-out area or the neighbouring panels. The authors believe that both the gob loading characteristics and the effects of a previously mined-out gob area on the face stability of the adjacent longwall face are important variables that must be considered. Since the total load from the overburden around the excavation is transferred to the floor through the unmined coal and the gob, ignoring the load carried by the gob around the mining area/s will result in overestimation of stresses around abutments and failed zones in the face area.
Numerical modelling of longwall mining with a consideration of gob behaviour has been documented in previous studies (Yavuz, 2004; Yasitli and Unver, 2005; Esterhuizen, Mark, and Murphy, 2010a, 2010b; Shabanimashcool and Li, 2012). In these studies, a double-yield loading model in FLAC was used for gob modelling. This approach modelled the gob as a strain-hardening material, with the stress-strain response obtained through laboratory tests on compaction of loose materials (Pappas and Mark, 1993). Shabanimashcool and Li (2014) simulated longwall mining in 3D models, and investigated the gate stability and rockbolt loading process. Esterhuizen, Mark, and Murphy (2010a) used a 3D longwall mining model to assess coal pillar performance and found that span-to-depth ratio is an important factor affecting the ultimate deformation and loading of pillars. Yavuz (2004) developed a 2D longwall mining model to investigate the pressure distribution in the gob area and to estimate the cover pressure re-establishment distance. He concluded that cover pressure re-establishment distance is related to the mining height, depth of cover, the bulking factor for gob, and compressive strength of the waste rock materials. However, the numerical longwall models incorporating the gob behaviour have not been used for assessing the face stability of a high-seam longwall. Furthermore, gob models using double-yield elements involve a large amount of data calculation and therefore have a very large mesh. It should also be noted that such modelling has not been carried out for the Chinese mining system and geological conditions. An alternative gob loading model by Abbasi and Chugh (2014) has been included in this study. Abbasi and Chugh utilized the gob model to assess the stability of chain pillars and set-up rooms in longwall mining practice in Illinois. The gob loading behaviour was modelled in FLAC 3D by applying a variable vertical force to the immediate roof and floor. The applied vertical force in the mined-out area was estimated based on field observations of caving in headgate and tailgate entries. The applied gob load was varied along and across the face advance directions to approximate the load carried by the gob. This gob loading model not only captures the effects of load transfer around the longwall face, gob, entries, coal pillars, and adjacent face, but it also simplifies the process of calculation. In this approach the model size is reduced even with fine mesh in the areas of interest.
Generally, gob behaviour can be modelled explicitly or implicitly (Esterhuizen, Mark, and Murphy, 2010b). In the explicit approach, the gob formation process is simulated to study roof fracturing, caving, and gob development during the advance of the longwall face. The alternative or implicit approach is used to model the overall effects of gob area on the longwall faces, pillars, and entries around the excavation, so that the stress and displacement distributions surrounding the excavation are realistically captured. Both the double-yield model and the estimated gob-load model for gob modelling belong to the implicit approach. Since this paper focuses on the effect of stress redistribution on face stability, the gob-load model approach was adopted here.
Quantitative measurement of gob loading characteristic in longwall mining is a challenge because the mined-out areas are not accessible. It is widely accepted that the loading characteristics of gob vary both along and across the face advance direction in the mined-out area. The vertical stress in the gob increases longitudinally from about zero at the back of shield, and transversely from about zero at the edge of longwall face, becoming equal to or close to the pre-mining vertical stress, as shown in Figure 4. Unfortunately, gob load characteristics were not available for the studied mine site in China. Therefore, several estimated gob models were constructed to perform sensitivity analyses of the gob loading characteristics. A realistic gob behaviour was regarded as being achieved when the vertical stress concentration factors (or VSCF, defined as the vertical stress at a particular point after excavation divided by the pre-mining applied vertical stress) ahead of the longwall face had achieved reasonable values of 2.5 to 3.0. For the sake of simplification, the applied vertical stress in the gob area behind the shields was incrementally increased until the pre-mining vertical stress was reached. Figure 6 shows the gob loading characteristics estimates after several iterations.

Song, Chugh, and Wang (2017) conducted a 2D numerical analysis of longwall face stability that included shield supports, face support plates, and gob loading behaviour. Modelling details of the shield support and face plate were included. It was found that increasing the loading capacity of the shield supports in the face area had very little effect on stress distribution on the longwall face. However, it does improve ground control in the open area, safeguarding workers and production. Also, the currently designed face support plates can hold the yielded or failed coal mass in place and prevent it from falling. However, they have very little effect on the redistribution of stresses in the face area.
Model development
Mine description
Panel 8101 of Wangzhuang coal mine was modelled in this study. The 6.3 m thick coal seam is mined using a singlepass longwall mining method at a depth of about 350 m. Figure 7 shows part of the lithological sequence used in the numerical model. The coal seam dips at about 3-7°. The longwall face is 270 m wide, but only half of the panel width was modelled in order to reduce the model size. The longwall face is oriented N-S. The maximum horizontal pre-mining compressive stress is about 15.75 MPa in the N55°W direction, and the other horizontal pre-mining compressive stress is oriented N35°E with a magnitude of 9.62 MPa.

Model description
One-half of each of the two adjacent longwall faces (centre to centre) was modelled. Figure 8 shows the final FLAC 3D model with the longwall panel layout and the overall geometry. The plan view of the overall model was shown in Figure 5. It is 300 m long and 200 m wide, and the model has an overall height of 63 m, with roller boundaries along the sides and at the bottom. A 20 m wide coal pillar was left between two panels, with 5 m wide entries on both sides. Solid coal barriers 30 m wide were included on both ends of the model. Longwall faces were advanced 170 m from the set-up rooms to ensure that the gob achieves the pre-mining vertical stress level. Panel 1 was advanced in 10 m increments, followed by panel 2 extraction. For improved accuracy, a fine mesh (1 m χ 1 m χ 0.5 m) was used for the coal and immediate roof and floor strata around the excavation. The shield (Shield ZY15000/33/72d) used in the study mine was modelled in this paper in a similar way to the earlier study (Song, Chugh, and Wang, 2017) but the face plate was not modelled.

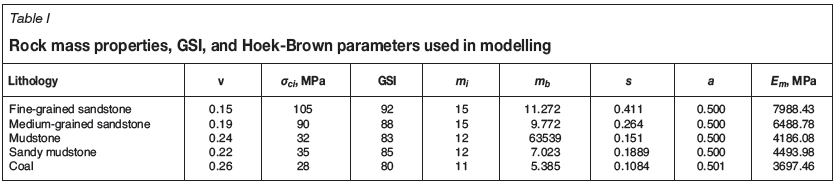
The Hoek-Brown failure criterion (Equation [1]) was used for nonlinear analysis (Hoek, Carranza-Torres, and Corkum, 2012). Table I shows the rock mass engineering properties used for different lithologies in modelling. The nonlinear rock material constants (mb, s, and a) for each lithology were calculated from estimated GSI rock mass classification values. These parameters were also used in the earlier 2D numerical modelling (Song, Chugh, and Wang, 2017).

where σ1' and σ3' are the major and minor effective principal stresses at failure, σαis the uniaxial compressive strength of the intact rock material, and m and s are material constants.
Matrix of models analysed
Five models were analysed in this paper. The original model has a seam height of 6.3 m, and the GSI of coal is 80. Models II and III, with seam thickness of 5 m and 7.5 m respectively, assess the influence of mining height on the stress distribution around excavations and failed zones development ahead of the face. The coal GSI was reduced to 75 in model IV and to 70 in model V to investigate the influence of coal mass engineering properties on face stability. For each model, the solution stages consisted of:
(1) Excavation of headgate and tailgate entries
(2) Excavation of panel 1 set-up room and installation of roof support
(3) Advance of panel 1 with shield
(4) Incorporation of gob behind the face with changing loading behaviour
(5) Excavation of panel 2 after panel 1 is mined.
Results and discussion
Division of panel regions
Since stress distribution around excavations and failure development on faces vary along the panel width, the half panel width was divided into different regions. Figure 9 shows that the peak VSCF values ahead of the face immediately above the coal seam continue to decrease from 3.1 at the centre of panel 1 to 1.5 at the panel edge where the face is close to the solid coal pillar and unmined panel 2. VSCF at the panel edge is only 50% of that at the middle section of the face. This would explain why most of the face falls observed in the field occur around the middle section of the longwall face rather than near the ends (see the face fall distribution along panel width in Figure 2). Based on this VSCF distribution along the panel width, panel 1 was subdivided into three regions: region A from x = 0 to x = 80 m, with peak VSCF values larger than 95% of the maximum VSCF; region B from x = 80 m to x = 110 m with peak VSCFs between 80 to 95% of the maximum VSCF; and region C from x = 110 m to x = 135 m with peak VSCFs less than 80% of the maximum VSCF (Figure 9(b). Similarly, panel 2 was also subdivided into regions A , B , and C for analysis. The characteristics of stress distribution and yielded zones were analysed and compared in the three regions for both panels 1 and 2. It should be noted that 'peak VSCF' refers to the largest VSCF value ahead of the face in the mining direction, while 'maximum VSCF' refers to the largest peak value of VSCF, which occurs at the panel centre.


VSCF distribution
VSCFin theY-direction
The VSCF is oriented in the Z-direction (vertical). The modelling analysis includes variation of the VSCF distribution along the X- and Y- directions (Figure 10). Since the VSCF values change along the panel width, three cross-sections in regions A, B, and C along the Y-direction were selected to represent the three regions of the longwall face, i.e. x = 40 m, 100 m, and 125 m shown as cross-sections AA , BB , and CC respectively in Figure 10. In Figure 11, the VSCF distributions ahead of the face and in the gob in different regions have been plotted. The peak VSCF values occur 2-3 m ahead of the longwall face. Region A has the largest peak VSCF, while region C has the lowest. From region A to region C, the distance of the peak VSCF ahead of the face decreases and becomes closer to the face location. At the same distance ahead of the face, region A has a larger VSCF and a larger area of coal ahead of the face is under the influence of higher VSCF. In the gob behind the face, VSCF distribution is almost identical for regions A and B. Pre-mining vertical stress in the gob is established about 67 m behind the longwall face. The VSCF in the gob in region C is lower.


Figure 12 documents the variation of VSCF along the cross-section DD . It shows that behind the face, the VSCF on the pillar first increases from unity at the face position to a maximum value of 2.49 about 50 m behind the face, and then decreases back to unity around the set-up room. This indicates the most vulnerable position of the pillar that may require additional support.

VSCFin theX-direction
VSCF distribution along the X-direction is shown in Figure 13. Figure 13a compares the VSCF distribution along cross-section EE after completion of panel 1 and panel 2. After panel 1 is mined out, the peak VSCF on the left side of the pillar is about 1.4. Unmined panel 2 is largely unaffected, with the peak side abutment VSCF only slightly larger than unity. However, after panel 2 is mined out, the VSCF on both sides of the pillar increases to about 1.58. The VSCF distribution looks symmetric about the centre line of the pillar, except that the VSCF along panel 1 is further increased. This is not a concern since panel 1 is already mined out.


The VSCF distributions along cross-sections FF and GG are plotted in Figure 13b and 13c, respectively. After completion of panel 1, the peak VSCF on the left side of the pillar is about 2.42 in Figure 13b and 2.45 in Figure 13c, and the peak side abutment VSCF values on panel 2 are only 1.22 and 1.24, respectively. After panel 2 is mined, the VSCF values on both left and right sides of the pillar are increased. The curves also become symmetric.
Vertical stress distribution
Figure 14 plots the vertical stress distribution on a horizontal plane above the coal seam at different stages of excavation. As the face advances, vertical stress in the gob area continues to change. The vertical stress is very low at the mined-out area behind the face and in the area close to the coal pillar. High vertical stress is found in the areas ahead of the face and on the pillar near entries.

Comparison of VSCF values and failure development for the two adjacent longwall faces
Peak VSCF ahead of the longwall face
Figure 15 plots the peak VSCF ahead of the face at each stage of longwall excavation as a function of face advance from the starting position. The VSCF values in different regions of the two adjacent panels are plotted. As the face advances, VSCF continues to increase until the gob assumes the full load. In regions A (A') and B (B'), the peak VSCF values at each stage are almost identical, but VSCF values in region C' of panel 2 are about 5.25% larger than those in region C of panel 1. Thus, mined-out panel 1 increases the VSCF values for the adjacent panel 2. However, this increase only extends 3540 m (X- direction) in panel 2, i.e. approximately in the area of region C of panel 2. In other words, mined-out panel 1 increases the VSCF in region C of panel 2, which would affect face stability in this region.

Yielded zones on longwall faces
Figure 16 shows the yielded zones development ahead of the longwall face after completion of panel 1. Most of the failure in the coal face occurs in shear mode, and yielded zones typically extend 3 m ahead of the face. It is observed that further development of failed zones will progress from the centre toward the top before extending downward. Figure 17 plots the yielded zones at the different depth of the longwall face. It shows that the entire 0-1 m depth of the coal mass ahead of the face has yielded since the start of the longwall face. The next 2 m depth of the coal mass is relatively stable, but the yielded zones on longwall face in regions A, B, and C are different.


The percentage of the yielded zone volume as a function of the total volume in a specific region is used to illustrate differences between failed zones in different regions. Table II lists the percentage of failed zones in the 1-2 m depth of the coal face over the total volumes of the second row of elements in each region. It shows that as the face advances, the yielded zone percentage in each region gradually increases and then stabilizes after the gob starts to assume the full loading. Table II also compares the percentage of failure in different regions and between different panels. It is found that regions A and B of panel 1 have the same percentage of yielded zones as regions A and B of panel 2, respectively. Region A (A') sees the most failure, which peaks at about 67-70 %. Yielded zone percentage in region B (B') is less, peaking at 60%. The difference in yielded zones in regions C and C , however, is very distinct. Failure in region C of panel 1 peaks at 47%, compared to 54% in region C of panel 2. It is once again confirmed that a previously mined-out longwall face will adversely affect face stability on the adjacent longwall face, especially in the region where it is close to the mined-out area.
Effect of seam height on face stability
In the original model (model I) the seam height was 6.3 m. To investigate the effect of seam height on face stability, two additional models with seam heights of 5 m (model II) and 7.5 m (model III) were constructed. Figure 18 compares the peak VSCF ahead of the face in regions A, B, and C of models I, II, and III, as a function of the face advance from the start position. In each region, model II has the maximum peak VSCF while model III has the minimum. Compared to model I, the peak VSCF values in model II are higher by 4.81% in region A, 4.85% in region B, and 3.14% in region C. The peak VSCF values in model III are, however, reduced by 2.67% in region A, 2.40% in region B, and 0.70% in region C. A negative relationship is found between seam height and the peak VSCF values ahead of the face. This is because the stiffness of the coal seam decreases with increasing seam height, and the seam deforms more both laterally and vertically. Larger deformations on the face, or even face falls in the return, further destress the solid coal and decrease the VSCF values. On the other hand, thinner seams have higher stiffness and therefore can sustain more load.

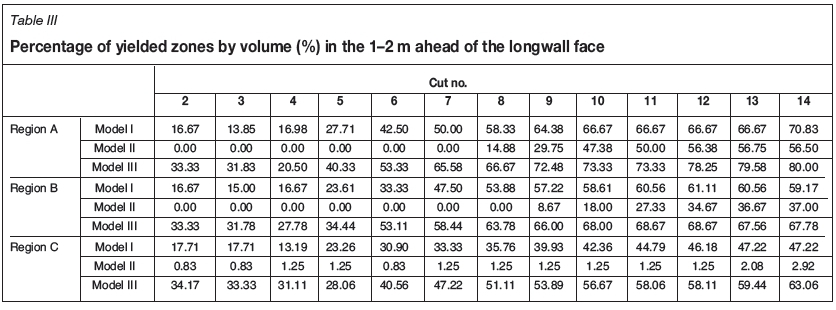
It is noted that the yielded zones in model II extend only 1 m ahead of the face before the face advances 67 m from the start position (cut 7), and 2 m after completion of panel 1. Failed zones in model III, however, extend 3 m ahead of the face after 107 m advance of the longwall face (cut 11). Table III records the failed zone percentage in the 1-2 m depth of the face in each region at different stages of longwall advance. It shows a positive relationship between the seam height and volumes of yielded zones. After the gob assumes full pre-mining load from the overburden, failed zones ahead of the face become stable. Compared to model I, model II has a significantly reduced volume of yielded zones, but in model III the failed zones ahead of the face increase substantially. In the second row of elements in the face (1-2 m depth of the face), model I shows about 67-70% of the yielded zones in region A, 59-61% in region B, and only 47% in region C, compared to 56.5%, 37%, and 2-3% for model II, and 80%, 68%, and 59--63% for model III.
Effect of coal mass engineering properties on face stability
The GSI of the coal was reduced to 75 in model IV and to 70 in model V to assess the effect of coal mass engineering properties on face stability. By decreasing the GSI, other coal engineering parameters are also decreased. The percentage reductions of these parameters are listed in Table IV. Figure 19 plots the peak VSCF ahead of the longwall face in regions A, B, and C of models I, IV, and V, as a function of face advance from the start position. With the decrease in GSI, the peak VSCF immediately ahead of the face decreases for each longwall face, and in each region of the longwall face. Compared to model I, the peak VSCF of model IV is reduced by about 2.79% in region A, 2.09% in region B ,and 7.67% in region C, while the peak VSCF of model V is decreased by 4.55% in region A, 6.10% in region B, and 9.51% in region C. The positive relationship between VSCF and GSI implies that 'weak coal' with lower engineering properties can sustain less load from roof strata, while 'hard coal' is subjected to higher load, which is in agreement with field observations.


Failed zones extend to 3 m ahead of face after 107 m of advance in model IV (cut 11) and after 77 m of advance in model V (cut 8). Table V shows the percentage of failed zones by volume in the 1-2 m ahead of the longwall face as the face advances. With the reduction in GSI, yielded zones ahead of the face are significantly increased. As the GSI decreases from 80 to 70, the percentage of failed zones in the 1-2 m depth of the face are increased by about 25% in region A, 30% in region B, and 35% in region C. Reduction in coal strength properties has a negative effect on face stability since it increases the volumes of yielded zones ahead of the face dramatically, since the peak abutment pressure is located further away from the face.
Summary and conclusions
The face stability characteristics of two adjacent longwall along and across the panel were modelled, taking into consideration the gob loading characteristics. A total of five models (models I to V) were constructed to assess the effects of a previously mined-out longwall face, the seam height, and coal mass engineering properties on face stability. The longwall face stability characteristics with the progressive advance of the working panel are discussed with reference to three different regions (regions A, B, and C) along the panel width based on VSCF distribution. The stress distribution around the excavation and development of failed zones on longwall faces are compared and analysed in different regions and in different models.
This study has developed scientific approaches for analysing face stability problems in different mining systems with variable geological conditions. The data provides a foundation for developing sound remedial measures for controlling face stability. Since no field measurements of observation data were available, quantitative validation of these analyses is not possible. However, the results obtained seem to conform to field observations. Furthermore, the results provide guidance to the approaches that could be researched to minimize face falls. However, each site-specific case must be analysed for design purposes.
Gob behaviour is critical for developing a physically realistic numerical model for assessing longwall face stability. The primary goal of this research was to develop a FLAC3D model of two adjacent longwall faces and observe the longwall face stability characteristics.
(1) Thick coal seams mined in China are likely to experience face stability problems. Most of these should occur around the central part of the face and be concentrated around the upper part of the mined face near the roof-coal interface
(2) Face falls are most likely to occur where the vertical stress is high and the horizontal confining stress is low. Therefore, yielded or failed zones on the longwall face are likely to be localized near the roof of the coal seam rather than near the bottom. This is consistent with field observations
(3) The depth of the failed coal mass ahead of the face is 2-3 m. The 3D shape of the failed coal mass should consist of several curved surfaces
(4) The peak vertical stress concentration factor (VSCF) ahead of the longwall face varies along the panel width. The maximum value occurs around the middle section of the panel and it continually decreases to only about 1.5 around the two ends of the face. Maximum VSCF values vary from 2.9-3.2 in different models
(5) The distribution of failed zones on the longwall face also varies along the panel width. In region A (middle section of the panel) more failure is found, while region C (the end of the panel) has less failed zones
(6) Regions A and B of panel 1 (first panel) have identical VSCF values and same amount of failed zones as regions A and B of panel 2 (second adjacent panel). However, peak VSCF values and failed zones in region C are 5.25% and 10% larger than those in region C. A previously mined-out panel (gob) will adversely affect the face stability of the adjacent longwall, and this influence can extend about 35-40 m toward the centre of the adjacent panel being mined
(7) Face stability is more critical around the tailgate than around the headgate, due to the effect of low load-carrying capacity of the gob in the adjacent mined-out longwall face. This is typical of what is observed in the field.
Seam height and coal mass engineering properties are important variables affecting face stability and were selected to perform sensitivity studies.
(8) Longwall faces with a greater seam height have larger volumes of yielded or failed zones in the unmined coal, but lower VSCF values ahead of the face. Lower thickness seams with larger stiffness, however, deform less and sustain more load
(9) Reduced GSI with lower cohesion and internal angle of friction will result in decreased VSCF ahead of face, but larger volumes of yielded zones on the longwall face
This paper is an extension of the 2D analyses published earlier (Song, Chugh, and Wang, 2016). Therefore, some of the conclusions here were also presented in the earlier paper.
Based on the earlier 2D study, the authors recommend that the open distance between the face and the back end of shields should be kept to a minimum to improve face stability. Therefore, all efforts must be made to ensure that the immediate roof strata behind the shields cave regularly. Furthermore, the currently designed face support plates can only hold the yielded or failed coal mass in place and control its fall so that it does not adversely affect safety and production. However, there is room for improvement in face plate design to better support the failed coal mass.
Acknowledgements
The authors are grateful for Mr S. Sinha's help in using the FLAC3D code. This research was sponsored by the Joint Funds of the National Natural Science Foundation of China (U1361209), the National Basic Research Program of China (973 Program, 2013CB227903), and the National Natural Science Foundation of General Programs (U51674264, 51574244).
References
Abbasi, B., Chugh, Y.P., and Gurley, H. 2014. An analysis of the possible fault displacements associated with a retreating longwall face in Illinois. Proceedings of the 48th US Rock Mechanics/Geomechanics Symposium, MN, USA. American Rock Mechanics Association, Alexandria, VA. [ Links ]
Bai, Q.S., TU, S.H., Chen, M., and Zhang, C. 2016. Numerical modeling of coal wall spall in a longwall face. International Journal of Rock Mechanics and Mining Sciences, vol. 88. pp. 242-253. [ Links ]
Bai, Q.S., Tu, S.H., Zhang, X.G., Zhang, C., and Yuan, Y. 2014. Numerical modeling on brittle failure of coal wall in longwall face - a case study. Arabian Journal of Geosciences, vol. 7, no. 12. pp. 5067-5080. [ Links ]
Chen, L. 2012. Study on the pressure behaviors of 'Three Soft' working face with large mining height and controlling technology. MS thesis, Anhui University of Science and Technology, Anhui, China (in Chinese). [ Links ]
Esterhuizen, E., Mark, C., and Murphy, M.M. 2010a. The ground response curve, pillar loading and pillar failure in coal mines. Proceedings of the 29th International Conference on Ground Control in Mining, Morgantown, WV. University of West Virginia. pp. 19-27. [ Links ]
Esterhuizen, E., Mark, C., and Murphy, M.M. 2010b. Numerical model calibration for simulating coal pillars, gob and overburden response. Proceedings of the 29th International Conference on Ground Control in Mining, Morgantown, WV. University of West Virginia. pp. 46-57. [ Links ]
Hoek, E., Carranza-Torres, C., and Corkum, B. 2012. Hoek-Brown failure criterion - 2002 edition. Proceedings of the NARMS-TAC Conference, Toronto, Canada. pp. 267-273. [ Links ]
Itasca Consulting Group, Inc. 2012. FLAC3D (Fast Lagrangian Analysis of Continua in 3 Dimensions), Version 5.0. Minneapolis. [ Links ]
Niu, Y.Q., Chen, S.Y., and Liu, J.F. 2010. Analysis on spalling increased mechanism of fully mechanized high cutting coal mining face and prevention measures. Coal Science and Technology, vol. 38, no. 7. pp. 38-41. [ Links ]
Pappas, D. and Mark, C. 1993. Behavior of simulated longwall gob material. RI 9458. US Bureau of Mines . [ Links ]
Peng, S.S. 1984. Longwall Mining. Wiley, New York. [ Links ]
Shabanimashcool, M. and Li, C. 2012. Numerical modelling of longwall mining and stability analysis of the gates in a coal mine. International Journal of Rock Mechanics and Mining Sciences, vol. 51. pp. 24-34. [ Links ]
Song, G.F. 2016. Prediction of longwall face height and multiple regression analysis on mining height increase. Coal Technology, vol. 35, no. 5. pp. 31-33 (in Chinese). [ Links ]
Song, G.F., Chugh, Y.P., and Wang, J.C. 2017. A numerical modeling study of longwall face stability in mining thick coal seams in China. International Journal of Mining and Mineral Engineering, vol. 8, no. 1. pp. 35-55. [ Links ]
Song, Z.Q., Liang, S.K., Tang, J.Q., and Lu, G.Z. 2011. Study on the influencing factors of coal wall rib spalling in fully mechanized working face. Journal of Hunan University of Science and Technology (NaturalScience Edition), vol. 26, no. 1. pp. 1-4 (in Chinese). [ Links ]
Tian, Q.Z., Zhang, A.R., Lu, Q.K., Liu, Y.F., and Li, P.X. 2012 The study on coal wall stability of thick coal seam with large-high mining face. Journal of Taiyuan University of Technology, vol. 43, no. 1. pp. 73-76. (in Chinese). [ Links ]
Wang, J.C. 2009. Theory and Technology of Thick Seam Mining. Metallurgical Industry Press, Beijing (in Chinese). Wilson, A.H. 1983. The stability of underground workings in the soft rocks ofthe coal measures. International Journal of Mining Engineering, vol. 1. pp. 91-187. [ Links ]
Whittaker, B.N. 1974. An appraisal of strata control practice. Mining Engineering, vol. 134. pp. 9-24. [ Links ]
Yavuz, H. 2004. An estimation method for cover pressure re-establishment distance and pressure distribution in the goaf of longwall coal mines. International Journal of Rock Mechanics and Mining Sciences, vol. 41. pp. 193-205. [ Links ]
Yasitli, N.E. and Unver, B. 2005. 3-D numerical modeling of stresses around a longwall panel with top coal caving. Journal of the South African Institute of Mining and Metallurgy, vol. 105. pp. 287-300. [ Links ] ♦
Paper received Oct. 2016
Revised paper received 2017
The Southern African Institute of Mining and Metallurgy, 2018. ISSN 2225-6253.

