


Services on Demand
Article
 English (pdf)
 Article in xml format
 Article references
Indicators

Related links
-
 Cited by Google
 -
 Similars in Google
Share

 Permalink
Journal of the Southern African Institute of Mining and Metallurgy
On-line version ISSN 2411-9717
Print version ISSN 2225-6253
J. S. Afr. Inst. Min. Metall. vol.118 n.1 Johannesburg Jan. 2018
http://dx.doi.org/10.17159/2411-9717/2018/v118n1a7
PAPERS OF GENERAL INTEREST
Particle segregation associated with sub-sampling of flotation feed at a UG2 concentrator
N. Naicker; V. Sibanda
University of the Witwatersrand, South Africa
SYNOPSIS
A concentrator treating an Upper Group 2 (UG2) reef ore has been historically under-accounting in terms of 4T (platinum, palladium, rhodium, and gold) content. The 4T content declared after sampling the flotation feed (or mill product) has always been more than that accounted for when concentrates and tailings exiting the flotation plant are analysed. This suggests that the sample head grade of the concentrator feed is possibly overstated. A plant audit indicated no reason to believe that the built-up head grades were the likely contributor to the under-accounting trend. The debate on the source of under-accounting pointed towards possible non-representative and/or biased sampling occurring in the concentrator feed vezin-vezin sampling system.
This work investigates the possibility that the bias is due to particle segregation occurring in the intermediate hopper that stores the primary increment sample before sub-sampling.
Vezin credibility and chronological sub-sampling tests were done on the current sampling arrangement. A consistent bias was observed between the reject and official samples, with the official samples having finer particles and analysing higher in 4T grade than the reject samples, confirming the hypothesis of particle segregation in the intermediate hopper. An alternative hopper discharge nozzle was then designed and replicate tests performed. The results with the new nozzle showed much improvement in the bias using particle size as the analyte, indicating that particle segregation has been significantly reduced.
Keywords: sampling, vezin sampler, metal accounting, intermediate hopper, particle segregation, bias.
Introduction
The importance of sampling in the mining industry, whether in exploration, in mining, or in mineral processing, cannot be overemphasized (Bartlett, 2005). Conventional wisdom suggests that when the rules for representative sampling are followed and the sampling equipment is in good order, and procedures used by the operators are well defined and followed, unbiased samples will be obtained. The measured parameter or analyte is considered to be biased if the mean of its distribution is not equal to the true value of the parameter. Thus the bias can be positive when the measured value is more than the true value or negative when the measured value is less than the true value. In sampling, there are two major areas where bias can arise, namely sampling and sample preparation.
Sampling bias generally occur when increments coincide with cyclic events, where only a portion of the stream is being sampled, where cutter specifications are not adhered to, and when sample containers are overfilled (Kruger and Millar, 2002). Therefore the best defense against any sampling bias is the correct sampling protocol, correct mechanical design of the sampling rig, and adequate control and maintenance during its operation (Bartlett, 2005; Kruger and van Tonder, 2014).
An Anglo American Platinum concentrator plant treating Upper Group 2 (UG2) ore in South Africa has been historically under-accounting in terms of 4T (platinum, palladium, rhodium, and gold) content. The debate on the source of under-accounting pointed towards possible non-representative sampling and/or biased sampling in the concentrator feed sampling system. The feed grades were believed to be overstated, and when compared to the built-up head grade, resulted in the under-accounting trend. A plant audit indicated no reason to believe that the built-up head grades were the likely contributor to the under-accounting trend. The current practice at this plant is that crushed run-of-mine UG2 ore is milled in a semi-autogenous (SAG) mill and the mill product is classified by screening into undersize and oversize streams. The oversize is returned to the SAG mill for further grinding. The undersize is gravity-fed to a surge tank and then pumped to the primary rougher flotation circuit. Prior to being fed to the primary rougher flotation circuit, the material is sampled by an automatic vezin-vezin sampler. The position of the sampler in the production process is shown in Figure 1.

Vezin-vezin sampler arrangement
A vezin sampler is a multipurpose device that collects samples from materials that are free-falling from pipes, chutes, or hoppers. A schematic of the vezin-vezin sampler combination used at the concentrator and in which tests were performed is shown in Figure 2. This device operates by one or more cutters, revolving on a central shaft, that pass through the sample stream and collect a fixed percentage of the total material (Trottier and Dhodapkar, 2012). This sampling system comprises a primary sampler and a secondary sampler. The bulk stream that is sampled is generally large and thus the primary increment is often too large to be further processed or prepared. A secondary sampler is thus incorporated as part of the overall sampling system to reduce the primary sample to a more manageable sized sub-sample. The secondary sampler is generally in the form of a vezin sampler or rotary splitter. Kruger and van Tonder (2014) explain in detail the mechanical design of a typical vezin sampler and its mode of operation.

It was believed that particle segregation may be playing a more significant role in the intermediate hopper/holding tank of the UG2 feed sampling system than originally assumed. Intermediate hoppers typically have a design capacity to hold a single primary sample increment for a certain retention time until the entire primary sample increment is sub-sampled by a secondary sampler. It has been hypothesized that the main reason for the consistent under-accounting may be due to over-sub-sampling of finer material into the official samples, and consequently under-sub-sampling of the coarser material present in the feed slurry streams. UG2 feed material assays by size fraction indicated that higher platinum and palladium grades are associated with the sub-75 μιη size fractions as opposed to the coarser size fractions above 75 μιη (Ntlhabane, 2014). Indications are that because of the under-sub-sampling of coarse material, the head grade of the feed to the plant is overstated, leading to an under-accountability of metal content. For metallurgical accounting, it is vital that there is unbiased sampling of input and output streams (Bartlett, 2005).
Experimental methodology
The automatic vezin-vezin feed sampler as illustrated in Figure 3 was used to perform all experimental work.

Dual primary vezin samplers as depicted in Figure 3 were available on site. Under normal operating conditions, only one primary vezin sampler is meant to operate at a time. The primary sampler has a single vezin cutter arrangement and the secondary sampler has a four-cutter vezin arrangement. The primary sampler produces a primary sample which is then discharged from the primary cutter outlet through a flexible pipe ('7' in Figure 3) into a Y-feed pipe ('4' in Figure 3) and then into the intermediate hopper ('3' in Figure 3) of volume capacity 20 L. The primary sample increment is then discharged from the intermediate hopper through a nozzle via gravity, at which point sub-sampling begins. The intermediate hopper is fitted with a regulated compressed air supply (approx. 2-4 bar pressure).
Principal bias testing relating to segregation of particles in the intermediate hopper was conducted using the vezin credibility technique (Kruger and Millar, 2002). The primary and secondary sampling stages as depicted in Figure 2 were used to collect samples.
Experimental programme
The experimental work reported in this paper was conducted in two stages. Stage 1 involved experimental baseline test work on the existing sampling equipment. Stage 2 involved test work using a re-designed intermediate hopper nozzle.
Twin stream analyses were done for all samples sent to the analytical laboratory in order to determine the analytical variance. The analytical laboratory that conducted the assaying is ISO 17025 accredited. A certified reference material (CRM) matching the samples was used for quality control purposes. The CRM samples were randomly placed in each batch of samples that were analysed. All samples were analysed in triplicate and the relative standard deviation used to eliminate outliers. If there were no outliers, the average value of the three results was then reported. Backup samples were reserved (where possible) for repeat analysis.
The first objective was to investigate whether particle segregation occurs in the intermediate hopper of the UG2 feed sampling system. Two different tests were performed, namely the vezin credibility test and a chronological sub-sampling test. The purpose of a vezin credibility test is to verify whether the vezin sampler produces sound, repeatable, and unbiased results. If a vezin sampler is credible then the characteristic/analyte under consideration should be almost identical for both the official sample and reject sample. A total of five test runs were performed for repeatability purposes. For each test run, five individual samples were generated.
The vezin credibility test work involved the following steps:
► The plant control room personnel were notified of the test work plan
► A pre-work risk assessment was performed by all personnel involved in the test work. The equipment was inspected for leaks and physical damage. The secondary vezin speed was also determined
► The main feed stream was sampled by the primary vezin on a pre-determined time interval basis. The primary vezin sampler was operated in manual mode for this purpose
► A clean and empty 20 L plastic bucket was placed at the secondary vezin reject sample pipe discharge, and a clean and empty 5 L container was placed at the official sample pipe discharge
► With the primary vezin sampler in manual mode, the manual 'cut' button was pressed once. This resulted in a single cut of the main stream. Two more manual cuts were taken at intervals of approximately 30 seconds Each primary sample increment resulting from the primary vezin operation was then sub-sampled by the secondary vezin sampler to produce an official sample and reject slurry portion. The hopper retention time was measured in order to calculate the number of secondary cuts per primary increment
► The two buckets containing the official and reject samples were then removed from the sampling points. The containers were closed securely with the provided lids to ensure that no moisture evaporated and no sample was spilled. Each sample was accompanied by a sample identification tag
► The flexible hose connecting the discharge point of the primary vezin cutter to the Y-bend feed inlet of the intermediate hopper was then detached
► A single manual primary cut was then taken. An empty and clean 20 L bucket was used to collect this primary sample increment. The sample container with the primary slurry sample was then removed from the sampling point and secured as for the others
► The flexible hose was then re-attached to the inlet of the intermediate hopper.
The above steps were repeated five times for repeatability purposes. The time between each test run was minimized (less than 15 minutes) to reduce the risk of introducing unpredicted process variability into the test work. Once the required number of samples had been collected, i.e. five primary slurry sample increments and ten pairs of official sample and reject slurry samples, the sampler was immediately switched back to automatic operation. The collected samples were taken to a central storage area for further preparation, analyses, and data recording.
A schematic of the sampling and sample preparation methodology for the vezin credibility test work is shown in Figure 4.

The chronological sub-sampling test work was designed to determine the presence of particle segregation. The intermediate hopper discharge was sampled intermittently over a predetermined period of time in order to examine the constitution of the samples with respect to particle size. If coarse particles settle faster in the intermediate hopper, as intuition and Stokes Law (McCabe, Smith, and Harriott, 1993) suggest, they should exit the hopper first and more quickly on sub-sampling and are therefore not sub-sampled for the entire duration of the sampling campaign.
The chronological sub-sampling test work was carried out as follows:
► A primary increment was collected into the intermediate hopper by sampling the primary feed
► For every primary increment sub-sampled from the intermediate hopper by the secondary vezin, an official sample portion was collected every 6 seconds in separate containers until the intermediate hopper emptied out
► Seven primary increments were taken and the above steps repeated until enough sample mass was cumulatively collected in this chronological sequence
► Each of the chronological sub-samples was accompanied by a sample identification tag
► The sub-samples were then wet-screened independently over a 38 μm screen to produce a +38 μm fraction and -38 μm fraction
► The + 38 μm fraction was dried and weighed
► The -38 μm fraction was filtered, dried, and weighed
► The two fractions were then combined and weighed
► The % + 38 μm was then calculated
► The combined sample was then sent for 6T, base metals, and Cr2O3 twin-stream analysis.
A schematic of the sampling and sample preparation methodology for the chronological sub-sampling test work is shown in Figure 5.
Results and discussion
Stage 1 baseline test work results
Figure 6 shows the cumulative particle size distributions of the primary, official, and reject samples for all five of the test runs. It is clear from Figure 6 that the reject sample is coarser than both the official and the primary 'feed' sample and that the primary sample PSD lies between the PSDs of the official sample and reject sample.
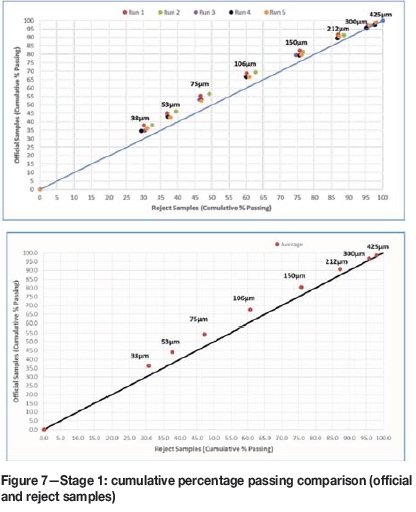
This demonstrates that the sampling system has a tendency to sample more of the finer particles than the coarser fraction. Figure 7 shows that bias exists between the reject and official samples. The official samples consistently have a higher cumulative percentage passing than that of the reject samples across all screen sizes.
The percentage bias between the reject and official samples wase calculated per size fraction and is shown in Figure 8.

Figure 8 shows the bias between official and reject samples across the spectrum of particle sizes. The official samples are consistently finer than the reject samples and the bias increases as the particles size decreases. The largest bias of 18.5% is observed for the -38 μπι fraction. Considering the previous suggestion that sub-75 μΓη particles normally have higher PGM grades, such biases would therefore have an effect on the overall grades of the primary, reject, and official samples, resulting in the declaration of an incorrect feed grade for metal accounting purposes.
A size by assay analysis was performed and the results are shown in Figure 9. It can be observed that there is an almost exponential increase in the PGM grade with decreasing in particle size.
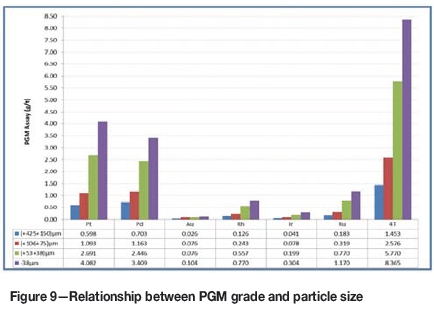
This again emphasizes that if sampling has a bias towards the finer fraction (below 75 μΓη), which has a much higher PGM grade, then the overall grade of the official sample will be much higher than that of the primary or reject samples. From Figure 10, the official samples (4B and 4E) clearly have the highest PGM grades, followed by the primary sample (4C) and reject samples (4A and 4D).

The results of the chronological sub-sampling of the official sample are shown in Figure 11. For the initial 12 seconds of secondary sampling (T1i0 to T1t1) the 4T grade remains fairly constant, thereafter increasing as the percentage +38 μm fraction decreases. This proves that coarser particles have a tendency to exit the intermediate hopper faster than finer particles. The base metal (BM) composition remains fairly constant as time progresses, suggesting that deportment of base metals does not change across the particle sizes as much as the deportment of PGMs. This has been proved by historical mineralogical investigations. Cr2O3 composition, however, follows the percentage +38 μm trend.

Changes in the intermediate hopper discharge nozzle design
The second objective of this research project was to determine how particle segregation could be minimized by optimization of the existing sampling equipment. A re-design of the intermediate hopper nozzle was considered. The original nozzle design is depicted in Figure 12.
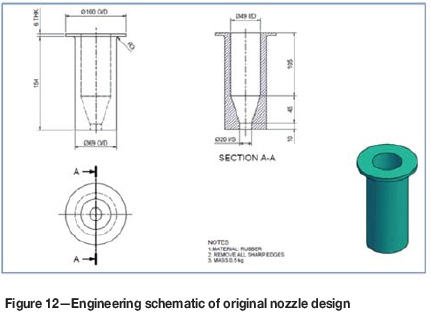
It was considered that the geometry of the nozzle could be the main contributor to the possible particle segregation, since compressed air at the inlet of the nozzle probably mixes the particles as they leave the intermediate hopper. The original nozzle design tapers off to an exit diameter after 105 mm of straight length. This promoted the argument that segregation could occur in the straight wider section. Under normal operation, the primary slurry sample would enter the intermediate hopper and be air-agitated at the base of the hopper before entering the nozzle. The particles in the slurry material would then have an opportunity to settle out over the length of the nozzle. The nozzle discharges into the secondary vezin sampler, which is used for sub-sampling until the intermediate hopper is emptied out. The idea of a new nozzle design was then suggested. The new nozzle design tapers off much earlier and has a narrower discharge length, as depicted in Figure 13.

Test work was then conducted to compare both nozzle designs in terms of their effect on particle segregation in the intermediate hopper of the UG2 feed sampling system. The same test work protocol as per stage 1, test 1 and stage 1, test 2 was followed).
Stage 2: optimization of existing sampling equipment
Figure 14 shows the cumulative particle size distribution of the feed slurry, official and reject samples for all five test runs performed. There is generally a closer agreement between the reject, official, and primary samples on the cumulative percentage passing.

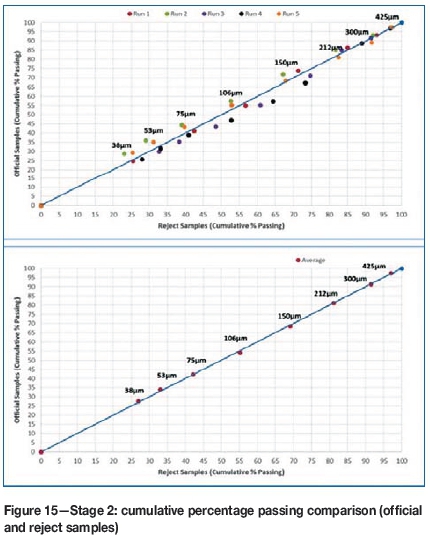
It is clear from Figure 15 that the reject and official samples are not identical at each respective size fraction, as the data is generally scattered around the 45° line; however, an averaged cumulative percentage passing comparison shows no net segregation. This indicates that over an entire sampling campaign, the random bias observed for individual increments would mostly likely average out and not result in a consistent bias in terms of particle size and hence overall grade of the reject and official samples.
The percentage bias between the reject and official samples was calculated per size fraction and is plotted in Figure 16, which also compares the new bias values with those obtained from the test work with the old nozzle. These results show that there is a consistent bias in the finer fractions and that the quantum of the bias per size class is much less than recorded with the old nozzle.

The chronological sub-sampling results for the tests with the new nozzle are shown in Figure 17. They indicate that for the initial 18 seconds of secondary sampling (T2t0 to T2t2) the 4T grade remains fairly constant. The 4T grade thereafter increases as the percentage +38 μm fraction decreases, but to a lesser degree than with the old nozzle. The BM composition remains fairly constant as time progresses, with the Cr2O3 composition again following the percentage +38 μm trend.

Figure 18 shows a comparison of the percentage +38 μm fraction for the tests with the old and the new nozzle tests. The results indicate that segregation is reduced to some extent with the new nozzle design.

The paired t-test method was applied in order to confirm whether there is a consistent bias between the reject and official samples that are correlated (i.e. it is expected that these measures would change with the change in the feed conditions) and are significantly different from zero. The differences in percentage mass retained for each pair of reject and official samples arising from an independent feed condition was compared in the statistical analysis. Table I indicates the confidence levels for the significance in the bias between reject and official samples. Red, yellow, and green cells indicate greater than 95% confidence, between 90% and 94.9% confidence, and less than 89.9% confidence respectively.

For Stage 1 test work, there is generally a greater than 95% confidence that a bias exists and that the bias is significant between the reject and official sample. The statistical confidence level for Stage 2 test work indicates that bias is not significant, and confirms that modifying the hopper discharge nozzle design effectively reduced particle segregation in the intermediate hopper of the sampling system.
Conclusions
The hypothesis that particle segregation is present in the intermediate hopper of a typical UG2 feed sampling system was confirmed by the vezin credibility and chronological sub-sampling test work on the original sampling system. A consistent bias was observed between the reject and official samples, with the official samples being depleted of coarse particles and higher in 4T grade than the reject samples. By means of a paired t-test, the calculated bias for percentage mass retained was deemed significant at the 95% confidence level. This outcome, together with the size by assay analysis, indicated that an under-accounting scenario would result.
Stage 2 test work indicated that optimization of the existing sampling system by modifying the design of the intermediate discharge hopper nozzle changed the dynamics at the base of the hopper and resulted in a random distribution of fine and coarse particles in both the reject and official samples. The PSDs for reject and official samples were similar across all test runs. The statistical confidence level for test work with the new nozzle indicates that bias is not significant and confirms that modifying the hopper discharge nozzle design reduced to some extent the particle segregation in the intermediate hopper of the sampling system.
In general, it is has been proven that particle segregation, which was so evident in the baseline test, was reduced with the incorporation of the alternative nozzle design.
Acknowledgements
The authors would like to thank Anglo American Platinum for the opportunity to conduct test work at one of their concentrator plants and for providing various resources throughout the research. The authors also wish to express appreciation to the technical services department of the concentrator plant where the experiments were sanctioned and carried out.
References
Bartlett, H.E. 2005. Confidences in metallurgical balances estimated from the errors in mass measurement, sampling and analytical determinations. Proceedings of the Conference on Exploration, Mine, Met and Environmental Sampling (EMMES2005), Eskom Conference Centre, South Africa, 3-4 November 2005. South African Institute of Mining and Metallurgy, Geological Society of South Africa, and Geostatistical Association of Southern Africa. [ Links ]
Kruger, C.J. and Millar, N.C. 2002. Evaluation manual. Group evaluation metal accounting. Anglo American Platinum, South Africa. [ Links ]
Kruger, C. and van Tonder, E. 2014. Pitfalls in vezin sampling for finely crushed materials. Journal of the Southern African Institute of Mining and Metallurgy, vol. 114. pp. 47-52 [ Links ]
McCabe, W.L., Smith, J.C., and Harriott, P. 1993. Unit Operations of Chemical Engineering. 5th edn. McGraw-Hill, Singapore. [ Links ]
Ntlhabane, S. 2014. Benchmark mineralogical investigation of UG-2 concentrator. Research report. no. MPR/14/183. Anglo Research, Crown Mines Campus, Johannesburg, South Africa. [ Links ]
Trottier, R. and Dhodapkar, S. 2012. Sampling particulate materials the right way. Chemical Engineering, vol. 119, no. 4. pp. 42-49. [ Links ] ♦
Paper received Apr. 2017
Revised paper received June 2017

