


Services on Demand
Article
 English (pdf)
 Article in xml format
 Article references
Indicators

Related links
-
 Cited by Google
 -
 Similars in Google
Share

 Permalink
Journal of the Southern African Institute of Mining and Metallurgy
On-line version ISSN 2411-9717
Print version ISSN 2225-6253
J. S. Afr. Inst. Min. Metall. vol.118 n.1 Johannesburg Jan. 2018
http://dx.doi.org/10.17159/2411-9717/2018/v118n1a5
PAPERS OF GENERAL INTEREST
Resource and Reserve estimation for a marble quarry using quality indicators
I. KapageridisI; C. AlbanopoulosII
ITechnological Educational Institute of Western Macedonia, Department of Environmental and Pollution Control Engineering, Koila, 50100, Kozani, Greece
IIIktinos Hellas SA, Aeshilou 11, 66100, Drama, Greece
SYNOPSIS
The use of standard estimation and modelling software tools in estimating marble quarry reserves poses a number of challenges. Marble quarry reserves are based on marble quality categories, which are unique for each quarry/deposit considered. These categories represent visual and physical aspects of marble such as colour, texture, and fractures. Classification of marble in one of the categories is performed by experienced personnel and is based on samples much smaller in area than the slabs of marble that would be produced. Furthermore, the available information is mostly qualitative, leading to further complications in the application of geomathematical estimation methods. The method of estimating marble reserves described in this paper is based on interpolating quality indicator values from drill-hole and quarry face samples to blocks in three dimensions. The procedure is applied in all working quarries of Iktinos Hellas SA and is based on Maptek Vulcan Quarry Modeller, a mine planning package adapted for quarrying. Its application and results are demonstrated using a case study from a quarry in northeastern Greece.
Keywords: inverse distance weighting, quality indicators, Reserve estimation, marble quarrying.
Introduction
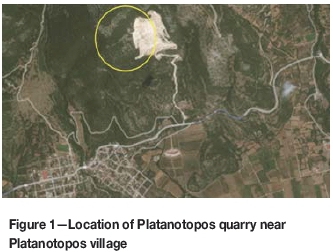
The reserve estimation procedure discussed in this paper concerns the Platanotopos quarry of Iktinos Hellas SA (Figure 1) - similar procedures are applied to the other quarries of the company. Specialized mine planning software (Maptek Vulcan Quarry Modeller) was used in all estimation and reporting stages. Data was provided by Iktinos Hellas SA personnel, including sample quality characterization. A technical report was issued on behalf of Iktinos Hellas SA (Kapageridis, 2015). Similar computerized estimation efforts are reported by Forlani and Pinto (2000), Careddu, Siotto, and Tuveri (2010), and Abdollahisharif et al. (2012).
Location
The quarry area is located in the Municipal District of Platanotopos of the Piereon Municipality of Kavala Prefecture, approximately 1.5 km NNE of Platanotopos village and 2 km SW of Mesoropi village (Figure 1). The quarry area under exploration is 88 649 m2. The quarry area is in public forest land covered by bushes, between 380 and 540 m elevation and administered by Kavala Prefecture Authorities and Kavala Forest Inspection Authorities.
Geological background and production history
The area is part of the Rodopi metamorphic massif, which extends from Thrace to part of Central Macedonia, with characteristic metamorphic geological formations and in particular marble horizons (metamorphosed limestones) in gneissic country rocks. Generally, the wider area is characterized by horizons and outcrops of white to semi-white and grey marbles, which are quarried locally. The quarry area contains calcitic and dolomitic marbles, gneiss, and gneissic schists. The calcitic marbles, gneiss, and gneissic schists have no commercial value and are not exploited.
Interest is focused on the dolomitic marbles, which occur as lenses enclosed by alternating gneissic schist layers and calcitic marbles. The marble-bearing horizon has a regular strike of NNW-SSE and dips between 25° and 30°° ESE. The lensoid white dolomitic microcrystalline marbles are massive, white, fine-grained, and traversed by red-yellow 'spider-web' fractures filled with iron oxides and hydroxides.
This rare combination of white fine-grained fractured marble and fractures filled with secondary material results in a massive, cohesive rock mass with an interesting appearance (Figure 2). Because the marbles are massive, large slabs can be recovered with minimal production of waste material. The top 1-2 m of the marble deposit consist of a weathered layer which has a low recovery factor for marketable marble.
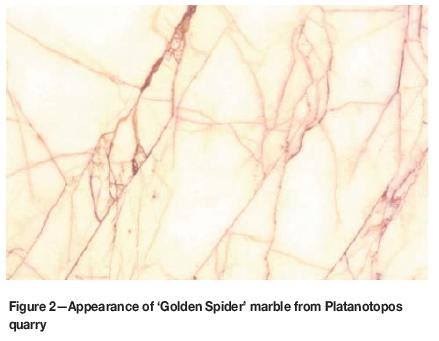
Production from the quarry is scheduled for 7 000-10 000 m3 per annum and at this rate, the life of the operation is estimated at 15 years. The marble, which is known as 'Golden Spider', has very good physical and mechanical properties and can take a very high polish (Table I).
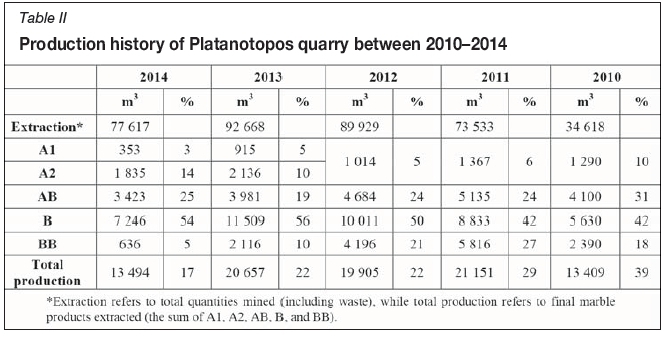
Historical production from the quarry is given in Table II -the marble quality categories are explained in the following section.
Marble quality characterization
Colour and texture
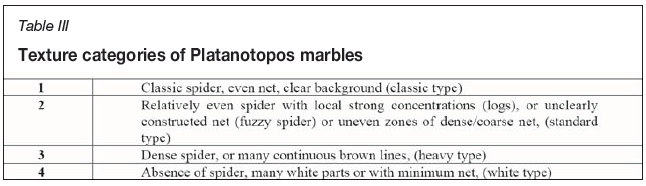
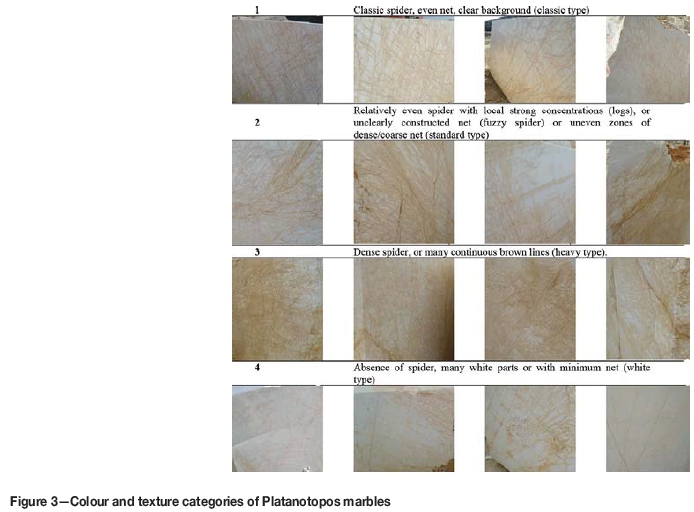
Quality grading of Golden Spider marble is initially based on colour according to the following categories: G - golden, Y -yellow, R - red. Grading based on the spider-web texture is in one of four categories as described in Table III. Colour and texture combinations are presented in Figure 3.
Defects
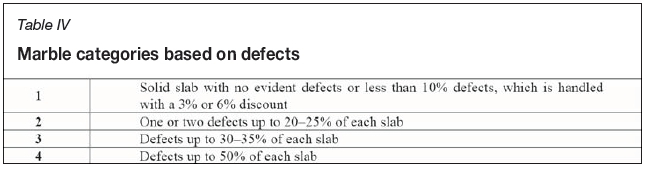
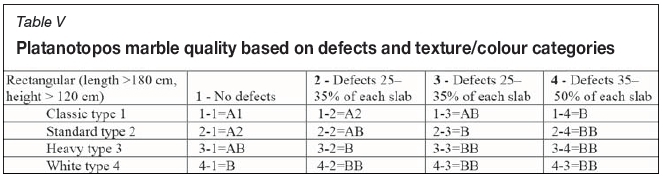
Based on defects (fractures, dendrite zones, brown lines, discolourings or marks etc.) each slab is classified using the four categories in Table IV, and the final quality is assigned according to Table V. The slabs produced from the Platanotopos quarry are 6 χ 2.8 χ 7 m (width, depth, height).
Reserve estimation data
Data used in the reserve estimation for each quarry includes the original as well as the current topography of the quarry area based on the quarrying activities up to the date of the study, as well as diamond drill-hole samples and sections on quarry faces, which are analysed every metre as to the marble quality. A separate data folder was created for each quarry with a separate database for the topographical/vector data and one for the drill-hole/section data. An effort was made to maintain a systematic naming scheme for all files of databases and models created during modelling and estimation. Topographical data was provided in AutoCAD™ (DWG, DXF) file format and imported to Maptek Vulcan Quarry Modeller software and stored in appropriate layers. Drill-hole data was provided in Microsoft Excel™ file format and imported to the specialized sample databases in Maptek Vulcan Quarry Modeller. In the following paragraphs, we discuss briefly the data provided for each quarry.
Topographical data
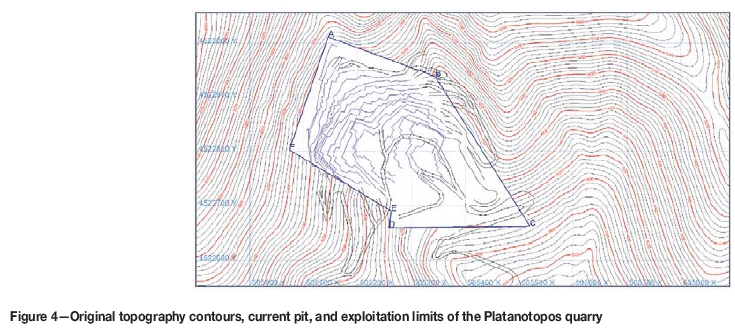
For the Platanotopos quarry, two layers were provided with the minor and major contours every 4 m and 20 m respectively. The exploitation limits were depicted on a separate layer as shown in Figure 4. The contours covered an area much larger than the quarry area and contained very good detail, suitable for reserve estimation. The current morphology of the quarry was also provided in two separate layers for crests and toes.
Drill-holes and quarry face sections
A total of 92 drill-holes and sections were provided for the Platanotopos quarry (47 sections and 45 drill-holes), giving a total of 1684 one-metre samples for use in reserve estimation. This data sufficiently covers the extent of the estimated final pit as show in Figure 5. The data was validated using the software for collar location and overlapping intervals.
Quarry volumetric model
The estimated volume of the final excavation was designed per bench (level) starting from the existing quarry morphology. The design of each of the 16 benches was modelled as a solid triangulation which was used in reserve estimation (Figure 6). These solids were visually checked and validated using triangulation topology checks (self-crossing, opening, inconsistencies) to ensure that they can be used for valid volumetric calculations.
Methodology
Sample database processing
The drill-hole and section sample database was configured with extra fields to allow the interpolation of arithmetic values in space. Specifically, fields were added which represent the different marble qualities based on original colour, texture, fracture, and tectonism fields. These fields take only two values, 0 or 1, based on whether the specific sample belongs to or does not belong to the particular quality category, which is based on criteria that are specific for each quarry. As shown in Figure 7, at the Platanotopos quarry, if a sample has lithology value LITHO = 'SPIDER' and spider type SPTYP = 1 and fractures BACKRO = 1 then it belongs to quality 1. This logic leaves out of the definition of initial quality due to the large-scale tectonism (represented by a solidity field called SYNOXH), which affect the final quality after it is estimated separately, with its own class fields. Thus different tectonism categories are defined for evaluation as for the different initial quality classes ( 1, 2, etc.). The reason for handling tectonism separately is the different orientations of large-scale tectonism, which requires a different search ellipsoid orientation (see Table VII). It is combined with initial qualities to derive the final ones with downgrading wherever necessary based on the estimated value of this field.
In other words, if the original field SYNOXH (solidity) has a value of 1, then the indicator field SN1_PR receives the value of 1; if it has a value of 2, then indicator field SN2_PR receives the value of 1 and so on up to SN5_PR. Only one indicator field can have the value of 1 in any case, while the others would be 0. The initial qualities are downgraded based on the SNx_PR fields. For example, if the initial quality is A1 and SN1_PR is 1 then the final quality is again A1 - no downgrading occurs. If the initial quality is A1 and SN3_PR is 1 then the final quality is AB - downgrading to two qualities lower.
After calculation of initial quality class fields and tectonism categories, a second procedure is carried out on the database by which the location of each sample (XYZ coordinates at the centre of each sample) is calculated and a weighting factor is assigned to the samples. This factor takes the value of 1 if the sample is from a section on the face of the quarry, and 0.5 if the sample comes from a drill-hole. Essentially, more weight is given to face sections as quality assessment is performed on a surface larger than the drill core and therefore better approaches the actual quality of the marble in that specific location. These weighting factors are used to further assess samples during interpolation.
Quality estimation
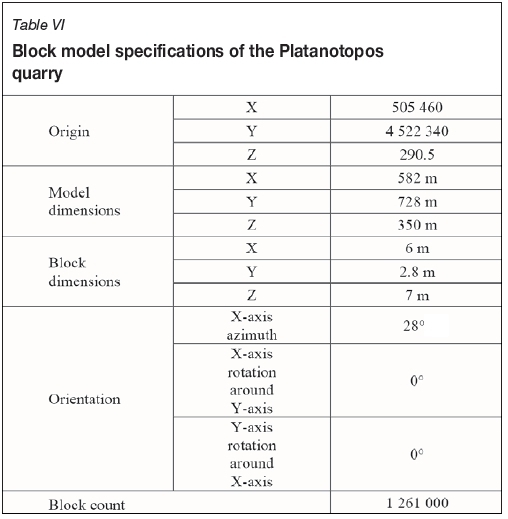
Quality class field values were interpolated using the inverse distance squared method as implemented by Maptek Vulcan Quarry Modeller software on the basis of a block model. The estimated volume is divided into blocks of the same size. For Platanotopos quarry, a block model with rotation around the Z axis was constructed that covered the entire quarry volume and current sampling. The model specifications are given in Table VI. Block dimensions were configured based on the marble volumes that are extracted separately at the Platanotopos quarry (slab dimensions). In each block, the percentage of each marble quality was estimated using the method analysed earlier using neighbouring samples. These samples are selected around each block using search ellipsoids that are oriented according to the geological features of the particular deposit. Ellipsoid parameters are given in Table VII.
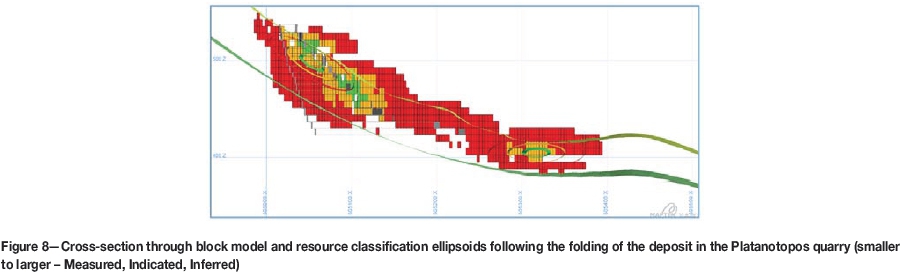
Block estimation in Platanotopos quarry was different to that for the other quarries as the ellipsoids had a different orientation in each block due to the folding of the deposit. Thus, a special function of the software was used before estimation that calculates the appropriate ellipsoid orientation for each block, taking in to account reference surfaces that define folding (Figure 8).
In the case of Iktinos Hellas SA quarries, the modifying factors for converting marble Resources to Reserves include the limitation of Resources inside a technically feasible excavation as designed by the company's personnel (mining and legal factors), inside the exploitation license limits (legal, environmental, and governmental factors). Classification based on the three categories of Mineral Resources was performed during three stages of block estimation, using ellipsoids of different dimensions and different sample count requirements (Table VI).
Results and conclusions
Reserve estimates
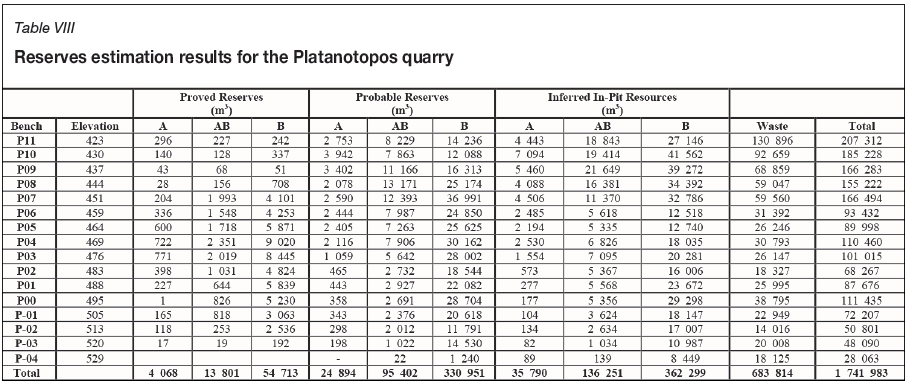
Table VIII gives the results of the reserve estimation. For each reserve category, three generalized qualities are reported. Generalizing of qualities was considered necessary as the limited sampling does not allow for a more detailed analysis of reserves to the original A1, A2, AB, B, and BB quality categories produced by the particular quarry. Therefore, reported quality A corresponds to quantities A1 and A2, AB is reported on its own, while B quality contains both B and BB. Reported waste quantities are the remaining bench volume, which cannot be estimated using the available sampling and the limitations set by the reserve categories with reference ellipsoid dimensions and minimum sample count. As a result, a considerable part of the waste and the Inferred Resources can potentially be upgraded in the future with additional drilling, which will provide a clearer and more detailed picture in areas where there are currently no samples.
Conclusions and future work
A Resource and Reserve estimation procedure applied at the Platanotopos marble quarry of Iktinos Hellas SA was performed using specialized software. Original sample quality values were converted to indicator values to allow interpolation to a block model using inverse distance weighting. This procedure provides Iktinos Hellas SA and potentially other marble quarrying companies with a method of producing reliable results according to international standards of Resources/Reserves reporting.
Future work will include integration of historical production data with the quality estimation process and implementation of an appropriate production quality control system that will produce the necessary data to improve the current quality models and reserve classification. As is evident in Figure 6, there is room to improve the Resource and Reserve classification of exposed marble - most of the exposed quarry face blocks are not classified as Proved. Standardization of quality assignment to drill core samples and production marble slabs is also an area where significant improvement is required.
References
Abdollahisharif, J., Bakhtavar, E., Alipour, A., and Mokhtarian, M. 2012. Geological modeling and short-term production planning of dimension stone quarries based on market demand. Journal of the Geological Society of India, vol. 80, September 2012. pp. 420-428. [ Links ]
Careddu, N., Siotto, G., and Tuveri, A. 2010. Evolution of a marble quarry: from open cast to underground exploitation. Proceedings of Global Stone Congress2010, Alicante, Spain, 2-5 March 2010. [ Links ]
Forlani, G. and Pinto, L. 2000. Monitoring marble extraction in open cast quarries. International Archives of Photogrammetry and Remote Sensing, vol. XXXIII, part B4. pp. 283-289. Proceedings of the XIXISPRS Congress, Amsterdam, The Netherlands, 16-23 July 2000. Technical Commission IV: Mapping and Geographic Information Systems. Fritsch, D. and Molenaar, M. (eds). http://www.isprs.org/proceedings/XXXIII/congress/part4/283_XXXIII-part4.pdf [ Links ]
Kapageridis, I. 2015. Iktinos Hellas SA quarries - marble reserves estimation. Technical report, September 2015. Maptek Pty Ltd. [ Links ] ♦
Paper received Apr. 2016
Revised paper received Mar. 2017

