


Services on Demand
Article
 English (pdf)
 Article in xml format
 Article references
Indicators

Related links
-
 Cited by Google
 -
 Similars in Google
Share

 Permalink
Journal of the Southern African Institute of Mining and Metallurgy
On-line version ISSN 2411-9717
Print version ISSN 2225-6253
J. S. Afr. Inst. Min. Metall. vol.118 n.1 Johannesburg Jan. 2018
http://dx.doi.org/10.17159/2411-9717/2018/v118n1a2
PAPERS OF GENERAL INTEREST
A mine-to-mill economic analysis model and spectral imaging-based tracking system for a copper mine
S.S. Nageshwaraniyer; K. Kim; Y-J Son
University of Arizona, USA
SYNOPSIS
An economic analysis model is proposed for estimating the cost savings incurred in all operations, from blasting to milling, in a copper mine using spectral imaging-based tracking. A conventional mid-sized copper mine in Arizona with two ore types is used as a case study. First, a combined regression and discrete event simulation model of the material-handling network of the mine, constructed in ArenaTM, is used mainly to obtain throughput information at pits, crusher, and mills as well as the stochastic power consumption at each operation from mine to mill. The two ore types are assumed to be distinguished using a spectral imaging-based tracking method. The main components of the spectral imaging-based tracking method are a multispectral camera and a regression model consisting of partial least-squares, principal component, or logistic regression methods. Partial least-squares, principal component, and logistic regression methods are then compared to select the best method to distinguish various ore types sampled from the mine. Finally, an economic analysis model based on tracking results fed to the simulation model is used to demonstrate the cost savings for each ore type as a function of the specific explosive energies. This is a preliminary study of the economic analysis of overall cost savings before testing in an actual copper mine.
Keywords:: mine-to-mill optimization, copper mine, ore tracking, hyperspectral imaging, multispectral, discrete event simulation.
Introduction
In a copper mining operation, the copper recovery in the mineral processing circuit is affected by upstream operations. The upstream operations in a conventional copper mine include blasting, excavation, crushing, transportation, stockpile storage, as well as milling in semi-autogenous grinding (SAG) and ball mills. Varying the specific explosive energy may have a significant impact on the downstream comminution processes, and can maximize the cost savings between blasting and ball milling while achieving a sufficiently small P80 at the ball mill (Chung and Katsabanis, 2000; Nielson and Lownds, 1997; Nielsen and Malvik, 1999; Scott, 1996). P80 is the 80% passing size in the cumulative size distribution (both post-blast and post-mill fragmentation), and it is generally used as a representative size of the fragmentation in the hard-rock mining industry. However, for a mine with two or more ore types, these savings are difficult to estimate in absence of an ore-tracking method that can detect ore type as well as estimate fragment sizes (Kim and Kemeny, 2011). There are challenges to ore-tracking methods as well, resulting from thorough mixing of ore, for example at the stockpiles. Dissimilarities between ore types in terms of their blastability, crushability, and grindability add to the complexity of estimating the energy expenditure required to achieve a target P80 during milling. In summary, although it may be difficult, it is important for mine operators to distinguish between ore types so as to be able to calibrate the total explosives energy accordingly in order to maximize the total cost savings over a period of time.
Tracking systems have been used in mines for other purposes in the past. A system based on a radio frequency identification (RFID) tracer in a plastic shell has been developed (Jansen et al., 2009). Although this tracer does not provide continuous tracking of all ore types in a mine, it could be used to track ore transported between stockpiles and bins. Similarly, RFID tracers have been used to track blast movements (La Rosa and Thornton, 2011). Continuous tracking already exists for all ore transported from pits to crushers (Modular Mining, 2014). This tracking is based on global positioning system (GPS) devices attached to the trucks hauling ore from shovel sites to the primary crushers. However, the tracking process does not continue through the comminution circuit and stockpiles. Thus, tracking ore movement from blast sites to the ball mills requires prediction and tagging of ore type of each individual fragment transported on trucks and conveyors. Tagging and prediction is useful in mines where the majority of fragments are over 1 inch (2.54 cm) in size, which, in the authors' experience, is the typical cut-off size for feasible prediction of ore type. Where fragment sizes are smaller, bulk tagging and prediction can be more useful than individual tagging and prediction. X-ray fluorescence, X-ray diffraction, and imaging spectrometry are possible technologies that can be used to remotely sense the mineral content in fragments (Klug and Alexander, 1954). Imaging spectrometry relies on obtaining electromagnetic spectra from the minerals of interest. It has been used in the past to detect minerals having spectral reflectance characteristics (SRC) in the visible and invisible parts of the electromagnetic spectrum. Some of its applications include mineral mapping (Tangestani et al., 2011), vegetation species identification (Bechtel, Ribard, and Sánchez-Azofeifa, 2002), and rock discrimination (Sgavetti et al., 2007; Combs et al., 2011) among others. The works cited have shown that wavelengths between 400 nm and 2500 nm, comprising both visible and near-infrared (VNIR) and short-wave infrared (SWIR) spectra, are the most useful for discrimination. Statistical analysis methods such as partial least-squares regression (PLSR) can be used for discriminating between mineral types based on a hyperspectral image (Haaland and Thomas, 1988; Blanco and Peguero, 2011). Principal component regression (PCR) is a method similar to PLSR that uses principal component analysis (PCA) to determine the unknown regression coefficients. Logistic regression (LR) is another competitive method for discriminant analysis, where the output specifies a particular fragment explicitly and categorically as belonging to an ore type.
To solve the tracking problem, we developed a spectral imaging-based automated tracking method for ore types and fragmentation. We demonstrate cost savings from applying the proposed system using a simulated conventional copper mine. A generic small-sized copper mine with two different types of ore - hard and soft rock (names of ore aligned with those used in the case study) - is considered. In general, mathematical programming and computer simulation can be applied to model mining operations in order to obtain various performance measures such as production and equipment utilization. When used as a standalone tool, stochastic programming is best suited for instances where the goal is to maximize a performance measure such as production under constraints with stochastic model parameters (Kataoka, 1963; Kall, Wallace, and Kall, 1994; Sahinidis, 2004; Santelices et al., 2017). But when combined with simulation, in addition to maximization of a measure, the combined tool can be used to evaluate system performance measures as well as keep track of detailed system statuses over time, such as locations of trucks and movement of ore on conveyors. Simulation models of most processes in mines can be constructed through a combination of discrete event simulation and process simulation. The need to use process simulation arises when environmental factors underlying crushing and grinding processes vary significantly enough to impact performance measures such as quality of throughput. There are several recent applications of process simulation to model the underlying dynamics in crushers (Asbjörnsson, Hulthén, and Evertsson, 2012, 2013; da Cunha, de Carvalho, and Tavares, 2013; Asbjörnsson et al., 2016). Discrete event simulation has been applied to model truck-shovel haulage operations in surface coal mines, underground mines, and similar operations in construction such as earth movement (Zhang, 2008; Meng et al., 2013; Nageshwaraniyer, Son, and Dessureault, 2013; Salama, Greberg, and Schunnesson, 2014; Torkamani, and Askari-Nasab, 2015; Park, Choi, and Park, 2016). Discrete event simulation software packages such as ArenaTM and SIMIOTM have become popular because they offer easy-to-use graphical user interfaces and attractive animation capabilities. An early, but thorough, review of software used in mine system simulation in the USA is provided by Sturgul (1999). Since conducting experiments at all locations from mine to mill in a real mine in order to collect inputs and outputs for estimating cost savings is difficult, a regression model (using experimental data from one of many operations of the mine) and discrete event simulation model using ArenaTM software are used to model all the mining operations in this study. The Monte Carlo technique is embedded in ArenaTM and is used to estimate the confidence intervals in performance measures such as production, equipment utilization, and queue times caused by uncertainties from shovel loading times, truck haul, and dumping times.
In this work, the first objective is to model all operations from blasting to grinding using a combination of regression and discrete event simulation. Constructing very granular models for blasting requires an understanding of the underlying physics. However, models predicting aggregated blast particle-size distributions have been constructed in the past based on linear regression (Kim and Kemeny, 2011; Modular Mining, 2014). Hence, real data for blasting parameters such as explosives energy, burden, spacing, rock properties (tensile strength or mode I fracture toughness), and block size of the bench face is used to construct a blasting regression model to predict the resulting particle size distribution (Kim and Kemeny, 2011). A MS Excel® linear regression tool has been used to estimate the coefficients of the blasting regression model. The other operations, such as excavation and transportation of ore via trucks and conveyors to crushers and grinders, mimic supply chain systems, and are therefore modelled using discrete event simulation in ArenaTM. The data for blasting and other operations, as well as the structure of the simulated mine, is based on a mid-sized copper mine in Arizona. One of the main contributions of this paper is to specify the mean cost savings percentage, together with its confidence interval, as a function of specific explosives energy.
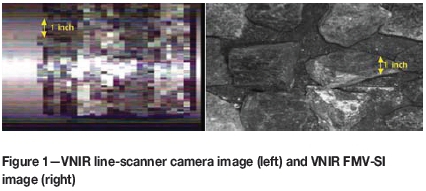
The spectral imaging-based tracking method proposed involves a combination of software and hardware. The software tools used are SPLIT Online 4.1 (image processing system) and a MATLAB-based regression model. SPLIT Online 4.1 is used to estimate fragment contours and volumes. At the core of SPLIT Online 4.1 technology are particle delineation algorithms used for marking outlines of fragments in truck dumps, muckpiles, and moving conveyor belts (Kemeny, Mofya, and Kaunda, 2002; Latham et al., 2003; BoBo et al., 2004). PLSR, PCR, and LR are compared for selecting the best prediction model for distinguishing samples from real mines, using the built-in functions in MATLAB. The main hardware components used in the method are multispectral cameras. The regression algorithms mentioned above are used to distinguish between ore types in each image delivered by the multispectral camera. The VNIR camera costs less than the SWIR camera because the SWIR camera captures much higher wavelengths. A 3D full-motion video spectral imaging (FMV-SI) camera such as the one from Surface Optics (SOC, 2014) is better than linescanner cameras in retaining spectral information, even at medium to high conveyor speeds (approx. 1 m/s in Figure 1). Since training and validation testing on real ore samples is necessary for comparisons between different regression algorithms, the second objective of this work is to collect and perform laboratory tests on ore samples from different mines. The tests were conducted on both a static surface (wood) as well as a moving conveyor. The third objective is to determine the combination of multispectral camera and regression model for prediction that can most accurately detect and distinguish different ore types. To the best knowledge of the authors, this is one of the first investigations in which VNIR, SWIR, and FMV-SI cameras have been studied for distinguishing between ore types on moving conveyors in a laboratory setting.
A brief description of the blasting regression model, as well as the simulation model of the mine used as a case study, is provided. This is followed by a discussion of results from testing different regression models on different ore samples using VNIR and SWIR cameras. A technique for integrating the detected ore type information with delineation information for implementation in the real mine is explained. The economic analysis of the overall cost savings achieved through the proposed spectral imaging-based tracking is discussed, and finally, the conclusions are presented.
Simulation model of a copper mine
Three simulation sub-models were developed in ArenaTM for the mid-sized copper mine: (1) forward blasting model, (2) reverse blasting model, and (3) comminution model (see Figure 2). The forward blasting model simulates the blasting process using site-specific blasting models at the pits (Kim and Kemeny, 2011). Two main assumptions are made for the simulation modelling: (1) a specific number of truckloads per day per pit along with cycle times is assumed, and (2) errors in blasting parameters - burden and spacing - are assumed to be induced by drill error and the mismatch between drill pattern and blast direction. The actual value of the error in blasting parameters can be obtained from operational blast data. In the experiments conducted, the errors are assumed to follow a uniform distribution. For example, if the error in burden is 5%, then the actual burden in a blast can vary between -5% and +5% of its mean value. Two ore types are considered in this model, and one shot per day is made at each of the pits. This sub-model is used to determine the coefficients of the site-specific blasting model when there is only limited data availablefor blasting parameters, such as burden, spacing, and particle size distribution of ore in truck beds.
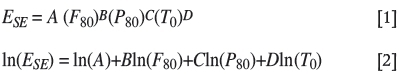
For constructing our site-specific blasting model, data from visible range cameras at a real copper mine in Arizona was used. F80 of shots - the bench face block size (80% passing size) before blasting - and particle size distributions of blasted ore dumped into trucks were provided. F80, bench height, and tensile strength (70), are taken to be deterministic variables. During the simulation run, for each pit, the values of burden, spacing, bench height, T0, F80, and P80 from each truckload were recorded into an MS Access database. The site-specific blasting model taken from Kim and Kemeny (2011) and its logarithmic form used in regression analysis are given in Equations [1] and [2], respectively. Although additional efforts are needed to validate this model for many mines around the world, the results presented by Kim and Kemeny (2011) applying this blasting model on data from a real copper mine are promising. EsEis the specific explosives energy, whereas F80 and P80 are the 80% passing sizes before and after the shot respectively. ln(A) is the intercept, and B, C, and D are the coefficients in the regression model.
The above model was also applied by Nageshwaraniyer, Kim, and Son (2015) using an MS Excel regression analysis tool on same sample data as in this paper, and the best model coefficients were chosen using the R2 value (which is the proportion of variation in EsEas explained by variation in T0, P80, and F80). Values of R2 above 0.9 were obtained, which implied that the regression model had a good fit between dependent (EsE) and independent variables (T0, P80, and F80). Thus, EsEvalues could be explained by our sample data using the site-specific blasting model. The estimated regression coefficients were then provided as input to the reverse blasting model in order to determine the product of burden and spacing for a desired P80 for each ore type, given the F80, bench height, explosives energy, tensile strength, and specific gravity for the corresponding pit. After many simulation replicas, the mean of product of burden and spacing along with the confidence intervals were recorded. If there is a known relationship between burden and spacing, the burden and spacing values can be deduced separately from this product of burden and spacing. If such a relationship is unavailable, different combinations of burden and spacing yielding the abovementioned product can be reviewed, and the best combination among these can be chosen by blast engineers for application at the real mine.
The P80 of each blast from the forward blasting model serves as input to the comminution model, which in turn is used to simulate truck haulage, crushing, stockpiling, and grinding operations. Using the forward blasting model, plus the F80, power setting (with uncertainty) and the associated Bond work indices for each comminution process, we can estimate throughput as well as the P80 for each of these comminution processes. Thus, the forward blasting model is used to construct a model to predict blast fragmentation, the reverse blasting model is used to determine burden and spacing (for a desired P80) when needed, and the comminution model is used to estimate throughput and P80 values for crushing and grinding operations.
Multispectral imaging and statistical prediction
Regression results using multispectral images
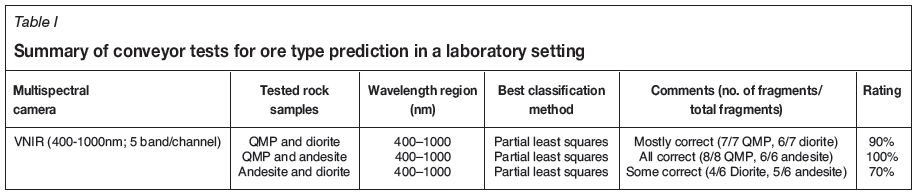
In this work, three types of regression techniques were applied for prediction of ore types from images of ore fragments: PLSR, PCR, and LR. Fragments of different sizes were present in each sample image. This was done in order to analyse the effect of varying fragment sizes on accuracy of prediction of rock types based on statistical regression techniques. The fragments, collected from a mid-sized copper mine in southern Arizona, were not cleaned before imaging, so as to mimic a real-world situation. In some cases, fines were added. Spectral imaging-based prediction involves calibration of the image, training and validation of regression model, and prediction. Calibration mainly involves correcting and recalculating the intensities, in raw multispectral images, of fragments on moving conveyors, based on the extreme values of intensities obtained from images taken at the same site on a static conveyor. Thereafter, for each pixel, the intensity values across all wavelengths are converted into absorbance values. As an example, in Figure 3, PLSR was used for distinguishing between QMP (quartz monzonite porphyry) and diorite, using the corresponding multispectral image as input. The image of a conveyor moving at 1 m/s was captured by a multispectral five-band camera with 1024x1360 pixel resolution; the spectral wavelength range was 400-1000 nm. For training, 11 pixels covering QMP (bright fragments; assigned '1'), diorite (other fragments; assigned '0'), and background (tray; assigned '0') were chosen. PLSR in this case was trained to predict the pixel-wise likelihood that there is QMP in an image. When the trained PLSR was validated, it produced the image depicted in Figure 3, where pixels that are more likely to be QMP exhibit red or yellow colours and other pixels blue or green colours. The bright red fragments are QMP and the others are diorite. The sets of scenarios that were considered are as follows: (1) QMP and diorite, (2) QMP and andesite, and (3) diorite and andesite. In each of these images, training was performed using spectral information from all types of materials available that could be visually identified. A summary of conveyor tests performed using this camera for ore type prediction in a laboratory setting is provided in Table I.
A summary of tests performed on a static surface with the SWIR and VNIR cameras is provided in Table II. These cameras generally have a large number of bands, and hence they are called hyperspectral cameras. However, due to their 'push-broom' mode of operation, these cameras can lose spectral information at high speeds (Figure 1). So, even though the results are impressive, they are not suited for prediction on conveyors at high speeds in real mines. The effect of the presence of dust and fines on ore type prediction is demonstrated in Figure 4. As illustrated in the left image of Figure 4, the presence of dust was simulated in a laboratory setting. Here, dust was simply blown when the image was being captured to imitate a real mine. The pixels covering the fines on top of andesite were not chosen for training. From Figure 4 (right), it can be observed that the presence of dust does not affect prediction using either the PLSR, PCR, or LR method. However, the pixels covered by fines were not detected as andesite. Here, the more reddish the colour, the more likely it corresponds to andesite.
Proposed spectral imaging system
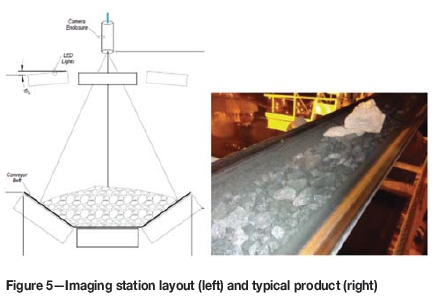
The VNIR camera is mounted four to six feet above the belt to provide a wide field of view of the passing product. A LED lighting array is positioned around the camera to provide even illumination of the target (Figure 5). The FMV-SI camera uses a micro lens array so that all spectral bands are imaged with each captured frame. The camera has 16 narrow-band filters over a spectral range of 450-900 nm with each image size of 640x540 pixels while capturing at least 30 images per second.
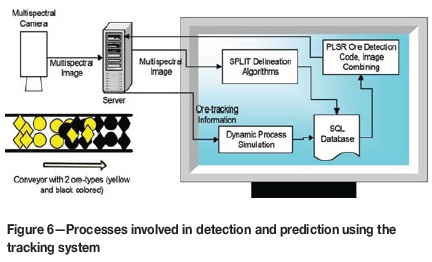
The proposed hardware to be used for the spectral imaging-based tracking system (Figure 6) is as follows: (1) conveyor; (2) multispectral camera; (3) server for storing images; (4) computer for processing raw multispectral images and calibrated images using SPLIT Online and the PLSR regression model. The following software may be used: (1) dynamic process simulation using ArenaTM, (2) SPLIT Online, and (3) MATLAB. The sequence of steps involved in detection and prediction of ore type is as follows. At first, the raw feed from the cameras will be supplied to the server, which stores this information. SPLIT Online delineates the contours of each fragment from the feed images and also provides average volume information of each fragment. Then, MATLAB is used to run a PLSR code to distinguish between ore types. Subsequently, based on the delineations of the images provided by SPLIT Online, the PLSR outputs of fragment contours and shadows are ignored. The end results are the volume and tonnage by ore type that have passed the camera at a given time. This information will be written into a table in the server, which can be later used to run a dynamic process simulation as well as estimate the cost savings, as discussed later.
The integration technique for SPLIT (image processing system) and regression results distinguishing ore types are briefly discussed here using an example. Figure 7 (left) shows the delineations of a sample multispectral image (Figure 3, right) using SPLIT Online. For delineation, SPLIT Online first converts the RGB portion of the multispectral image to greyscale. Secondly, various image enhancement techniques, such as smoothing and sharpening, are applied. To identify rock fragments, SPLIT Online utilizes techniques such as texture analysis and threshold determination algorithms. Results obtained from image processing using SPLIT Online's particle detection algorithms are to be overlaid onto the PLSR code's colour maps (Figure 3, right for this example), as shown in Figure 7 (right). Here, pixels of very dark blue colour in Figure 7 (right) correspond to black pixels or non-fragment pixels in the delineated image in Figure 7 (left).
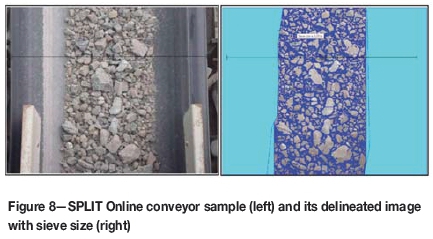
After ignoring non-fragment pixels, the remaining pixels are grouped into two clusters. A fragment's rock type is estimated after assigning it to an appropriate cluster, based on its average likelihood as determined by the PLSR code. Not all pixels of a fragment are homogenous, possibly because of variations in fracture or mineral content. In some cases, the detection of non-fragment pixels may not be a significant issue. For example, a real conveyor's background - such as in Figure 8 (left) and the delineated SPLIT image in Figure 8 (right) - will have no exposure since the fragments are very closely packed. In such cases, approximations can be made about the ore type and volume of the very small non-delineation dust-like fragments.
Economic analysis using simulation
The proposed tracking system can help estimate the power consumption for each ore type at blasting, crushing, and grinding stages. It follows that the four best camera locations for detecting ore fragment types and sizes leading to power consumption estimation are before the crusher, after the crusher, after the stockpile, and after the SAG mill. Due to the non-availability of detailed P80by ore type at each stage, the power consumptions have been calculated for an assumed reduction ratio (Kim, 2006, 2012; Kim, and Kemeny, 2011; Nageshwaraniyer, Kim, and Son, 2015) at each stage. The reduction ratio at a particular stage is defined in this work as ratio of F80to P80. The power consumption for blasting (using the camera before the crusher) is estimated using Equation [1]. The power consumptions for the crusher and grinding operations are estimated using the Bond work index formula with known Bond work indices.
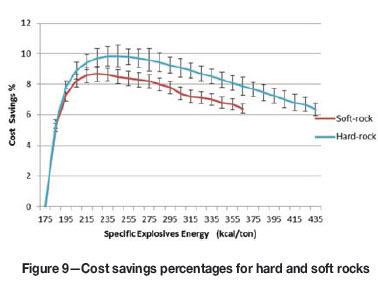
The aim of this experiment is to demonstrate how spectral imaging-based tracking of classification into hard and soft rocks can be used to obtain their optimum EsE values that maximize cost savings from mine to mill. The simulation model and the blasting parameter errors discussed earlier were considered (Nageshwaraniyer, Kim, and Son, 2015). In addition, a percentage error of uniform distribution UNIF (4, 5.5) was considered for each comminution power setting. To simplify calculations, it was assumed that the haulage costs are independent of specific explosives energy applied during blasting. Therefore, for the purposes of comparison of cost savings across different specific explosives energies, the total power consumption is the sum of power consumptions over the blasting and comminution processes (Kim, and Kemeny, 2011). It was also assumed that the mills are the primary bottlenecks in production (Nielsen and Lownds, 1997; Nielson and Malvik, 1999). Therefore, fixed relative power consumption cost percentages were assumed for the blasting, crushing, and milling processes, with the costs increasing as ore moves from blasting to milling (Kim, and Kemeny, 2011). The effects of reductions in Bond work indices due to micro-cracking were included as well. Ten replications were performed to determine the mean and confidence intervals of power consumptions at all the stages indicated in Table III. The cost savings shown in Figure 9 are compared to the base Ese scenario of 175 kcal/t (732.2 kJ/t). It can also be seen that the cost savings for hard rocks are larger for a wider range of Esethan those for soft rocks. Although this is a preliminary economic analysis based on some assumptions, the results show ore-tracking will provide the information necessary to choose the Esefor each ore type in order to achieve the maximum cost savings.
Conclusions
The economic benefits of using a spectral imaging-based tracking method for ore type prediction in a mid-sized copper mine in Arizona with two ore types have been demonstrated. For the experiments, the ore types were assumed to have different hardnesses; hence, they were classified into hard and soft rocks (names of ore aligned with those used in the case study). A simulation model of the material-handling network from the blast sites to ball mills was constructed for the analysis. The determination of cost savings over ranges of Ese(specific explosives energy) values for each ore type is made possible due to the tracking using a combination of multispectral camera, SPLIT Online fragment delineation algorithm, and an ore type regression model in MATLAB. After conducting tests using visible and near-infrared (VNIR) and short-wave infrared (SWIR) cameras with the number of bands ranging between 5 to 540, we concluded that:
(1) VNIR range cameras should be chosen, since they cost less while achieving similar effectiveness to SWIR cameras in ore type prediction
(2) Only up to five bands were needed for distinguishing the various samples we obtained from real mines
(3) A 3D full-motion video spectral imaging camera is better than line-scanner cameras in retaining spectral information at medium to high conveyor speeds.
It was observed that the cost savings as a function of EsE do not behave the same way for the two ore types, which implies that the spectral imaging-based tracking is economically beneficial for the mine.
References
Asbjörnsson, G., Hulthén, E., and Evertsson, M. 2012. Modelling and dynamic simulation of gradual performance deterioration of a crushing circuit-Including time dependence and wear. Minerals Engineering, vol. 33. pp. 13-19. [ Links ]
Asbjörnsson, G., Hulthén, E., and Evertsson, M. 2013. Modelling and simulation of dynamic crushing plant behavior with MATLAB/Simulink. Minerals Engineering, vol. 43. pp. 112-120. [ Links ]
Asbjörnsson, G., Bengtsson, M., Hulthén, E., and Evertsson, M. 2016. Modelling of discrete downtime in continuous crushing operation. Minerals Engineering, vol. 98. pp. 22-29. [ Links ]
Bechtel, R., Rivard, B., and SAnchez-Azofeifa, A. 2002. Spectral properties of foliose and crustose lichens based on laboratory experiments. Remote Sensing of Environment, vol. 82, no. 2. pp. 389-396. [ Links ]
Blanco, M. and Peguero, A. 2011. A new and simple PLS calibration method for NIR spectroscopy. API determination in intact solid formulations. Analytical Methods, vol. 4, no. 6. pp. 1507-1512. [ Links ]
BoBo, T.W., Norton, B., Kemeny, J.M., and Taylor, M. 2004. Split-Online® digital image analysis system to quantify particle size for the industrial mineral industry. 2004 SME Annual Meeting Preprints. [ Links ]
Chung, S.H. and Katsabanis, P.D. 2000. Fragmentation prediction using improved engineering formulae. Fragblast, vol. 4, no. 3-4. pp. 198-207. [ Links ]
Combs, J.H., Kudenov, M.W., Craven, J., and Kemeny, J.M. 2011. Evaluation of rock faces with hyperspectral imaging. Proceedings of the 45th US Rock Mechanics / Geomechanics Symposium. American Rock Mechanics Association, Alexandria, VA. [ Links ]
Da Cunha, E.R., de Carvalho, R.M., and Tavares, L.M. 2013. Simulation of solids flow and energy transfer in a vertical shaft impact crusher using DEM. Minerals Engineering, vol. 43. pp. 85-90. [ Links ]
Haaland, D.M. and Thomas, E.V. 1988. Partial least-squares methods for spectral analyses. 1. Relation to other quantitative calibration methods and the extraction of qualitative information. Analytical Chemistry, vol. 60, no. 11, pp. 1193-1202. [ Links ]
Jansen, W., Morrison, R., Wortley, M., and Rivett, T. 2009. Tracer-based mine- mill ore tracking via process hold-ups at Northparkes Mine. Proceedings of the Tenth Mill Operators' Conference, Adelaide, SA. Australasian Institute of Mining an Metallurgy, Melbourne. pp. 345-356. [ Links ]
Kall, P., Wallace, S.W., and Kall, P. 1994. Stochastic Programming. Wiley, Chichester, UK. [ Links ]
Kataoka, S. 1963. A stochastic programming model. Econometrica, vol. 31, no. 1-2. pp. 181-196. [ Links ]
Kemeny, J., Mofya, E., Kaunda, R., and Lever, P. 2002. Improvements in blast fragmentation models using digital image processing. Fragblast, vol. 6, no. 3-4. pp. 311-320. [ Links ]
KIM, K. 2006. Blasting design using fracture toughness and image analysis of the bench face and muckpile. Master's thesis, Virginia Tech. [ Links ]
Kim, K. and Kemeny, J.M. 2011. Site specific blasting model for mine-to-mill optimization. Proceedings of the SME Annual Meeting and Exhibit and CMA 113th National Western Mining Conference 2011. SME, Littleton, Co. [ Links ]
Kim, K. 2012. Rock fracturing and mine to mill optimization. Doctoral dissertation, University of Arizona. [ Links ]
Klug, H.P. and Alexander, L.E. 1954. X-ray Diffraction Procedures. Vol. 2. Wiley, New York. [ Links ]
La Rosa, D. and Thornton, D. 2011. Blast movement modelling and measurement. Proceedings of the 35th International Symposium on the Applications of Computers and Mathematics in the Mineral Industries (APCOM 2011). Australasian Institute of Mining and Metallurgy, Melbourne. pp. 297-310. [ Links ]
Latham, J.P., Kemeny, J., Maerz, N., Noy, M., Schleifer, J., and Tose, S. 2003. A blind comparison between results of four image analysis systems using a photo-library of piles of sieved fragments. Fragblast, vol. 7, no. 2. pp. 105-132. [ Links ]
Meng, C., Nageshwaraniyer, S.S., Maghsoudi, A., Son, Y.J., and Dessureault, S. 2013. Data-driven modeling and simulation framework for material handling systems in coal mines. Computers and Industrial Engineering, vol. 64, no. 3. pp. 766-779. [ Links ]
Modular Mining. 2014. http://mmsi.com [ Links ]
Nageshwaraniyer, S.S., Kim, K.M., and Son, Y.J. 2015. Optimal blast design using a discrete event simulation model in a hard-rock mine. Mining Engineering, vol. 67, no. 11. pp. 47-53. [ Links ]
Nageshwaraniyer, S.S., Son, Y.J., and Dessureault, S. 2013. Simulation-based optimal planning for material handling networks in mining. Simulation, vol. 89, no. 3. pp. 330-345. https://doi.org/10.1177/0037549712464278 [ Links ]
Nielsen, K., and Lownds, C.M. 1997. Enhancement of taconite crushing and grinding through primary blasting. International Journal of Rock Mechanics and Mining Sciences, vol. 34, no. 3. p. 226-e1. [ Links ]
Nielsen, K. and Malvik, T. 1999. Grindability enhancement by blast-induced microcracks. Powder Technology, vol. 105, no. 1. pp. 52-56. [ Links ]
Park, S., Choi, Y., and Park, H.S. 2016. Optimization of truck-loader haulage systems in an underground mine using simulation methods. Geosystem Engineering, vol. 19, no. 5. pp. 222-231. [ Links ]
Salama, A., Greberg, J., and Schunnesson, H. 2014. The use of discrete event simulation for underground haulage mining equipment selection. International Journal of Mining and Mineral Engineering, vol. 5, no. 3. pp. 256-271. [ Links ]
Sahinidis, N.V. 2004. Optimization under uncertainty: state-of-the-art and opportunities. Computers and Chemical Engineering, vol. 28, no. 6. pp. 971-983. [ Links ]
Santelices, G., Pascual, R., Lüer-Villagra, A., MacCawley, A., and Galar, D. 2017. Integrating mining loading and hauling equipment selection and replacement decisions using stochastic linear programming. International Journal of Mining, Reclamation and Environment, vol. 31, no. 1. pp. 52-65. [ Links ]
Scott, A. Ed. 1996. Open pit blast design: analysis and optimisation. JKMRC Monograph Series in Mining and Mineral Processing, no. 1. Julius Kruttschnitt Mineral Research Centre, University of Queensland. [ Links ]
Sgavetti, M., Pompilio, L., Carli, C., de Sanctis, M.C., Capaccioni, F., Cremonese, G., and Flamini, E. 2007. BepiColombo SIMBIO-SYS data: Preliminary evaluation for rock discrimination and recognition in both low and high resolution spectroscopic data in the visible and near infrared spectral intervals. Planetary and Space Science, vol. 55, no. 11. pp. 1596-1613. [ Links ]
SoC. 2014. Surface optics Corp. www.surfaceoptics.com. [ Links ]
Sturgul, J.R. 1999. Discrete mine system simulation in the United States. International Journal of Surface Mining, Reclamation and Environment, vol. 13, no. 2. pp. 37-41. [ Links ]
Tangestani, M.H., Jaffari, L., Vincent, R.K., and Sridhar, B.M. 2011. Spectral characterization and ASTER-based lithological mapping of an ophiolite complex: A case study from Neyriz ophiolite, SW Iran. Remote Sensing of Environment, vol. 115, no. 9. pp. 2243-2254. [ Links ]
Torkamani, E. and Askari-Nasab, H. 2015. A linkage of truck-and-shovel operations to short-term mine plans using discrete-event simulation. International Journal of Mining and Mineral Engineering, vol. 6, no. 2. pp. 97-118. [ Links ]
Zhang, H. 2008. Multi-objective simulation-optimization for earth moving operations. Automation in Construction, vol. 18, no. 1. pp. 79-86. [ Links ]
Paper received Mar. 2017
Revised paper received May 2017

