


Servicios Personalizados
Articulo
 Inglés (pdf)
 Articulo en XML
 Referencias del artículo
Indicadores

Links relacionados
-
 Citado por Google
 -
 Similares en Google
Compartir

 Permalink
Journal of the Southern African Institute of Mining and Metallurgy
versión On-line ISSN 2411-9717
versión impresa ISSN 2225-6253
J. S. Afr. Inst. Min. Metall. vol.117 no.12 Johannesburg dic. 2017
http://dx.doi.org/10.17159/2411-9717/2017/v117n12a10
PAPERS OF GENERAL INTEREST
Near-surface wave attenuation (kappa) of an earthquake near Durban, South Africa
M.B.C. Brandt
Council for Geoscience, Geophysics Competency, South Africa
SYNOPSIS
The near-surface wave attenuation factor κ (kappa), which describes the attenuation of seismic waves over distance in the top 1-3 km of the Earth's crust, was determined for eastern South Africa using data recorded by five stations of the South African National Seismograph Network. The author carried out the analysis on data from an earthquake with magnitude 3.8 that occurred off the coast of Durban on 6 February 2016 at 09:00:01 GMT. For the analysis, the author selected a 30-second window for the S-phase portion of the vertical component seismogram. The result was an average κ = 0.021 ± 0.0007 seconds, which is lower than κ = 0.048 seconds for micro-events in the Far West Rand and much lower than κ = 0.098 seconds for explosions at Sasolburg coal mines (Brandt, 2017). Kappa was found to be higher than for a stable continental region (κ = approx. 0.0006 seconds). This is likely due to the narrow frequency range between 4 Hz and 9 Hz, as well as the small data-set employed during this analysis.
Keywords: kappa, near-surface seismic attenuation, tectonic earthquake, spectral analysis.
Introduction
Brandt (2017) recently undertook a study to determine the near-surface wave attenuation factor κ (kappa) of Far West Rand microevents and Sasolburg coal mine explosions. The values of κ = 0.048 seconds (micro-events) and κ = 0.098 seconds (explosions) were found to be much higher than for a stable continental region where κ = approximately 0.0006 seconds {e.g. Atkinson, 1996; Douglas et al, 2010). Brandt (2017) ascribed this higher value obtained for κ to (1) additional near-surface wave attenuation at the shallow focus of both micro-events and explosions; and (2) the effect of the implosive component (micro-events) or explosive component (explosions) not accounted for in the Brune source model (Brune, 1970, 1971). These two factors differentiate mining-related events and explosions from tectonic earthquakes that have (1) deeper focal depths (Brandt, 2014) and (2) a source mechanism that may be described by a double couple (McGarr, 2002). The purpose of the initial investigation by the author (Brandt, 2017) was to derive a value for mining-related κ that will be useful in determining the attenuation relation required by spectral analysis when calculating moment magnitude, Mw, for S-waves using the seismograms recorded by the South African National Seismograph Network (SANSN).
However, no analyses are available for κ from tectonic earthquakes in South Africa for comparison. Some doubt remains whether the value of κ = 0.048 seconds for mining-related events is appropriate for shallow, non double-couple sources. Recently, a unique opportunity presented itself when the seismic waves, originating from a magnitude 3.8 earthquake off the coast of Durban on 6 February 2016 at 09:00:01 GMT, were clearly recorded by five stations of the SANSN, including station Parys (PRYS), with which Brandt (2017) had previously determined κ for micro-events and explosions. In this study, the author used the SEISAN earthquake analysis software (Havskov and Ottemöller, 2010) and Scilab open-source software (2012) to determine κ for eastern South Africa using data from this earthquake. The author employed a Fourier acceleration spectral analysis of the seismic signals in eastern South Africa recorded by nearby regional, suitably calibrated seismograph stations that had been properly installed on bedrock. This study follows the method by Douglas et al. (2010), who derived a kappa model for France, but has adapted this approach for vertical component seismograms. The advantage of using this adapted approach is that the spectral analysis will be backwardly compatible to the 1990s, when waveform recording by the SANSN was carried out on vertical-component seismographs only (Saunders et al., 2008). It was envisaged that the resultant κ would be useful for a comparison with the κ of Far West Rand micro-events and Sasolburg coal mine explosions, as well as for the calculation of Mw for tectonic earthquakes in South Africa. However, owing to the limited frequency range of 4-9 Hz of the author's analysis, this derived κ should not be extrapolated for strong ground motion engineering applications.
Method
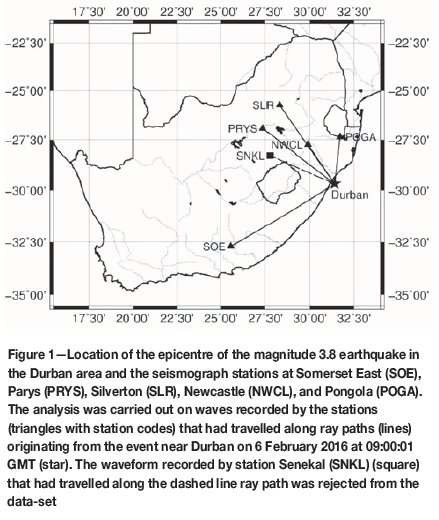
The present study is a continuation of the work previously completed by Brandt (2017). The reader is referred to that article for the definition of near-surface wave attenuation, κ, the two routine methods used to determine κ, the advanced method to determine κ, and how κ shapes the source spectrum of a small earthquake. In this study, κ is determined by means of definition (1) in Brandt (2017). This is the original definition given by Anderson and Hough (1984), but modified here for signals originating from a moderate size earthquake of ML> 3.4 rather than for events larger than magnitude 5. Figure 1 is a map showing the epicentre of the magnitude 3.8 earthquake off the coast of Durban that occurred on 6 February 2016 at 09:00:01 GMT, together with the seismograph stations that recorded the signals at the time. The analyses were performed using the signals recorded by seismograph stations in eastern South Africa with epicentral distances of 271-640 km. The stations were suitably calibrated up to a maximum frequency of 9 Hz (beyond which the anti-alias filter influences the signal, which is difficult to calibrate). Moreover, the stations had been properly installed on bedrock, the purpose of which was to ensure that no unwanted signal distortions or amplifications would occur at the site. Station Parys (PRYS) had been used in the previous study to derive κ for Far West Rand micro-events (Brandt, 2017) and is included in the present data-set for comparison.
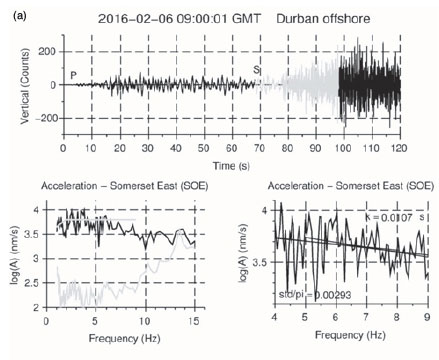
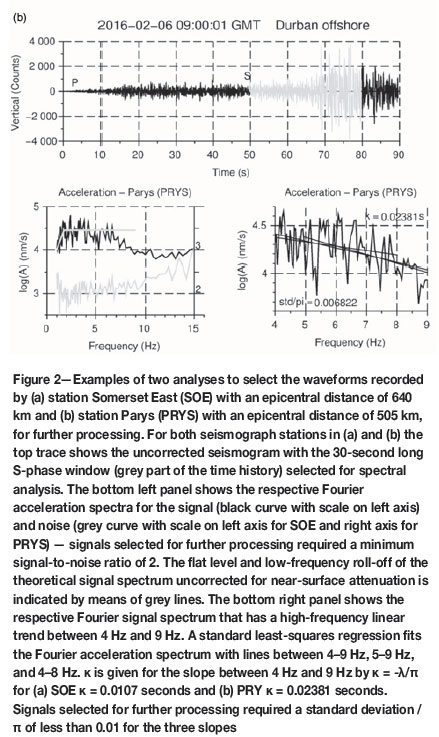
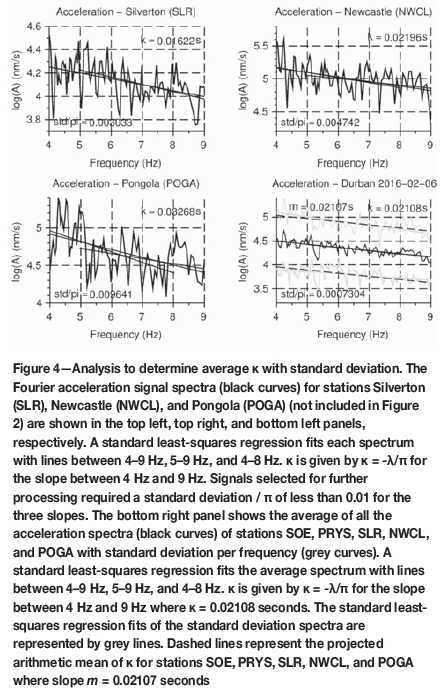
The first step in the analysis was to select suitable signals recorded by nearby regional stations for further processing. Examples of the semi-automatic selection procedure are shown Figure 2. The S-phase portion of the vertical component seismogram was identified and the corresponding Fourier acceleration spectra calculated. The Fourier acceleration S-spectrum and noise spectrum for a 30-second window preceding the P-phase were plotted together to identify signals with a signal-to-noise ratio of at least 2. Next, the high-frequency linear downward trend (above 4 Hz) in the acceleration spectrum was identified visually by comparing this spectrum to the theoretical signal spectrum that had not been corrected for near-surface attenuation. Based on this comparison, Fourier acceleration spectra without an obvious high-frequency linear trend were rejected. Finally, three lines were semi-automatically fitted (with a linear regression) over the high-frequency linear trend between 4-9 Hz, 5-9 Hz, and 4-8 Hz, with κ = -λ/π, where λ is the measured slope of the fitted line. Kappa was determined over the frequency range 4-9 Hz. Signals with an unacceptable high-frequency linear downward trend were rejected from further processing if the standard deviation / π of the three slopes exceeded 0.01. Figure 3 demonstrates how a signal recorded at station Senekal was rejected. The noise spectrum displayed unwanted signal distortions at 1 Hz, 2.5 Hz, and 8 Hz, which were attributed to a local factor (man-made or geological) that distorted the signal acceleration spectrum.
The average spectrum of all five selected Fourier acceleration spectra (in view of deriving the average κ = 0.021 ± 0.0007 seconds) is shown in Figure 4, together with the linear fits to the acceleration spectra for those seismograph stations not included in Figure 2. Three lines were again semi-automatically fitted over the average spectrum high-frequency linear trend to derive average kappa. Lines were also fitted over the standard deviation per frequency of the average spectrum and compared with the arithmetic mean of κ for stations SOE, PRYS, SLR, NWCL, and POGA to test the consistency of average κ (i.e. the slope of the fitted line) with individual analyses. This test required the normalization of the different signal amplitudes to a common level to account for the attenuation over the epicentral distances ranging from 271-640 km.
Discussion and conclusion
Determining average κ from a tectonic earthquake has provided a viable comparison to evaluate whether the value of κ = 0.048 seconds is appropriate for mining-related events with shallow, non double-couple sources. The result of this analysis has yielded a κ = 0.021 seconds, which is lower than κ for micro-events in the Far West Rand, and much lower than κ for explosions at Sasolburg coal mines. However, kappa is higher than for a stable continental region where κ = approximately 0.0006 seconds (Atkinson, 1996; Douglas et al., 2010). This may be ascribed to the narrow frequency range between 4 Hz and 9 Hz as well as the small data-set employed during the present analysis. Douglas et al. (2010) determined κ over a broad frequency range between 3 Hz and 50 Hz. For their study, the start of the linear downward trend in the acceleration signal spectrum (f) was generally at 3 Hz, but with a large scatter within the 2-12 Hz range, as had originally been observed by Anderson and Hough (1984). However, it would appear from the present study thatfE is consistently at 4 Hz for all five the stations and that the narrow frequency range between 4 Hz and 9 Hz is likely detrimentally affected by broad, local signal distortions (in comparison to the 2 Hz-50 Hz range). Nevertheless, since the moment magnitude for regional earthquakes is calculated by means of a spectral analysis of the S-wave using frequencies below 9 Hz, Mwfor tectonic earthquakes can now be assigned with more confidence than before.
The result of κ = 0.024 seconds for a tectonic earthquake, derived by station Parys (PRYS), as shown in Figure 2b, is in agreement (i.e. is lower) with the analysis of Brandt (2017), which yielded a value of κ = 0.048 seconds for Far West Rand micro-events, using the same station.
The result of the present study is based on a small dataset derived from one earthquake with hypocentre near Durban, South Africa, and narrow frequency range signals recorded by five nearby regional stations. However, the comparison of κ derived before for Far West Rand micro-events and Sasolburg coal mine explosions with κ derived in this study for the tectonic earthquake using the same station, PRYS, indicates that the analysis techniques are sound. Once more earthquake signals are analysed, and specifically when signals over the frequency range between 3 Hz and 50 Hz become available for analysis from suitable tectonic and mine-related events, a more accurate understanding of near-surface wave attenuation for South Africa will emerge.
References
Anderson, J.G. and Hough, S.E. 1984. A model for the shape of the Fourier amplitude spectrum of acceleration at high frequencies. Bulletin of the Seismological Society of America, vol. 74. pp. 1969-1993. [ Links ]
Atkinson, G.M. 1996. The high-frequency shape of the source spectrum for earthquakes in eastern and western Canada. Bulletin of the Seismological Society of America, vol. 86. pp. 106-112. [ Links ]
Brandt, M.B.C. 2014. Focal depths of South African earthquakes and mine events. Journal of the Southern African Institute of Mining and Metallurgy, vol. 114. pp. 1-8. [ Links ]
Brandt, M.B.C. 2017. Near-surface wave attenuation (kappa) of Far West Rand micro-events. Journal of the Southern African Institute of Mining and Metallurgy, vol. 117. pp. 511-516. [ Links ]
Brune, J.N. 1970. Tectonic stress and the spectra of seismic shear waves from earthquakes. Journal of Geophysical Research, vol. 75. pp. 4997-5009. [ Links ]
Brune, J.N. 1971. Correction. Journal of Geophysical Research, vol. 76. p. 5002 [ Links ]
. Douglas, J., Gehl, P., Bonilla, L.F., and Gélis, C. 2010. A kappa model for mainland France. Pure and Applied Geophysics, vol. 167. pp. 1303-1315. doi. 10.1007/s00024-010-0146-5 [ Links ]
Havskov, J. and Ottemöller, L. 2010. SEISAN earthquake analysis software for Windows, Solaris, Linux and Macosx. Ver. 8.3. University of Bergen, Norway. [ Links ]
Mcgarr, A. 2002. Control of strong ground motion of mining-induced earthquakes by the strength of seismic rock mass. Journal of the South African Institute of Mining and Metallurgy, vol. 102. pp. 225-229. [ Links ]
Saunders, I., Brandt, M.B.C., Steyn, J., Roblin, D.L., and Kijko, A. 2008. The South African National Seismograph Network. Seismological Research Letters, vol. 79. pp. 203-210. doi: 10.1785/gssrl.79.2.203 [ Links ]
Scilab Enterprises. 2012. Scilab: Free and open source software for numerical computation (Windows, version 5.5.2). http://wwww.scilab.org [ Links ]
Paper received Jul. 2016
Revised paper received Aug. 2017

