


Services on Demand
Article
 English (pdf)
 Article in xml format
 Article references
Indicators

Related links
-
 Cited by Google
 -
 Similars in Google
Share

 Permalink
Journal of the Southern African Institute of Mining and Metallurgy
On-line version ISSN 2411-9717
Print version ISSN 2225-6253
J. S. Afr. Inst. Min. Metall. vol.117 n.11 Johannesburg Nov. 2017
http://dx.doi.org/10.17159/2411-9717/2017/v117n11a14
PAPERS OF GENERAL INTEREST
Development of a predictive model of fragmentation using drilling and blasting data in open pit mining
J.D. SilvaI; J.G. AmayaII; F. BassoIII
IUAI Mining Center, Faculty of Engineering and Sciences, Universidad Adolfo Ibañez Santiago, Chile
IICenter for Mathematical Modeling, Universidad de Chile, Santiago, Chile
IIIEscuela de Ingeniería Industrial, Universidad Diego Portales, Santiago, Chile
SYNOPSIS
This article presents predictive statistical models for fragmentation in open pit mines using drill-and-blast data. The main contribution of this work is the proposing of statistical models to determine the correlations between operational data and fragmentation. The practical use of these models allows the drill-and-blast parameters, i.e. burden, spacing, explosive, among others, to be optimized in order to obtain a more efficient size distribution.
Keywords: open pit blasting, linear models, blast fragmentation.
Introduction
The drill-and blast-process (D&B), the main objective of which is to remove the ore from its in situ position, aims at generating a degree of fragmentation that permits loading and transporting the ore to the processing plant, and which minimizes energy consumption in comminution. Moreover, in those processes where the ore is treated by heap leaching operations, D&B also seeks to generate the conditions to maximize copper extraction on the leach pads through a better-controlled size distribution profile.
In the literature, several models are described that are aimed at predicting the fragmentation obtained by the D&B process. However, the greatest difficulty in applying them successfully in normal operations is the complex calibration required, considering different D&B practices in different types of rock. Therefore, the quality of calibration must be improved to obtain an applicable predictive model for D&B operations.
The main variables and parameters that define D&B practice are burden (B), spacing ( S), quality and quantity of the explosive charged into the blast-holes (Q), stemming (T), and firing pattern. This article aims to establish an empirical model that uses D&B data to predict P80, P50, and P20, defined as the 80%, 50%, and 20% passing sizes, respectively. From these variables it is possible to infer the size distribution of the feed to downstream processes.
Fragmentation by blasting
Basis of modelling
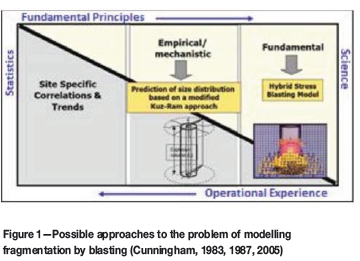
In general, mathematical models that allow any physical phenomenon to be reproduced in a simplified manner fall into one of three categories. First, there are models based on 'site-specific' correlations and trends that have local application, and therefore are difficult to extrapolate to other settings. The most sophisticated models are those that rely on the fundamental principles of physics, such as fracture mechanics and/or the theory of detonation, as for blasting. Between these two approaches are the so-called mechanistic empirical models, which are cost-effective since they predict appropriately in most situations of interest, without requiring a degree of unmanageable complexity in their practical implementation (supercomputers and excessive processing time, typical of research -essentially academic).
Figure 1 shows schematically the difference among these three approaches to fragmentation by blasting. For the reasons given above, it is not surprising that most of the knowledge regarding fragmentation has evolved in line with empirical-mechanistic models, especially the approach proposed by Cunningham (1983, 1987, 2005), which has been the subject of countless case studies, both in quarries and mining, and there are many references in the literature on its applicability. Evidence collected globally and the contribution of several researchers supports the introduction of different modifications that deal with the limitations contained in its formulation, particularly regarding the correct estimate of the fine fraction of the size distribution, which is consistently underestimated by the original model.
Applied models
Among the main refinements documented in the literature, and without prejudice to the work done by other researchers, are those proposed by Kanchibotla (1999) and Spathis (2005), which correct the fine fraction bias (crushed zone model) and specify the estimation of the parameters described by Weibull and implied in the Rossin-Rammler distribution, respectively. In addition, other authors have proposed alternative three-parameter distributions, such as Ouchterlony (2005) with the Swebrec function, which although also empirical, allows better fits over a wide range of particle sizes when field measurements are available. While there is consensus on the quality of these proposals, they lack mechanical characteristics, thus affecting the correlation with the blasting layout in order to establish causal relationships that respond directly to changes in specifications such as drilling pattern and/or the strength and type of explosive.
The choice between one variant or the other will depend on the nature of the problem (focus only on diggability, or interest in the fine fraction); the quantity and quality of data available, including the chance of running field tests (greenfield project or operating mine); and the experience of those responsible for calibrating the predictive model. In this regard, it is important to point out the ability of the blasting specialists to standardize criteria and develop tools that combine public-domain information with algorithms designed internally, not available in the market, which integrate cross-cutting issues of utmost relevance to the ultimate goal such as blasting characterization and in situ block size estimation. All this entails a strong component of stochastic simulation for management of the uncertainty associated with the inherent variability of the rock mass.
The specific case presented in this paper deals with a copper mine located in the north of Chile, with a production over 100 000 t/a, where D&B plays an important role in the fragmentation for heap leaching. The model used to calibrate the fragmentation sampling, obtained as part of the survey of the project baseline, contains elements of the 'site-specific' empirical approach, which has been suitably modified to deal with the fine fraction by utilizing image analysis and size distribution analysis of samples of broken material in the laboratory. Also, representative variables of fragmentation have been included, especially of the rock mass, whose characteristics require a 'site-specific' model due to the presence of fines in situ prior to blasting, for the problems are caused not only by the generation, but also by the release of, fines from the rock mass, and the unique characteristics of the rock mass studied in this research. In the case of the mine studied, there is evidence of the presence of fine material (smaller than 150 m) which originates from degradation and the geological alteration characteristic of a porphyry copper deposit, and which affects the ore processing in the plant.
Modelling strategy
Currently, blasting remains as much an art as a science. Although a lot of work has been done in the area of modelling the fracturing process and the propagation of stress waves in an isotropic or anisotropic medium, the natural variability of the rock mass usually distorts the complex blasting layout approaches mentioned above, and consequently much of the engineering conducted ends up relying on relatively simple 'rules of thumb' from global experience, as part of the documentation and dissemination of knowledge typical of the mining industry.
Overall, without considering the dynamic component of blasting (timing), the blasting layout must consider the following parameters (Cunningham, 1983):
> Blast-hole diameter
> Bench height considered in the mining plan
> Burden for blast-holes (B)
> Spacing between blast-holes (S)
> Stemming length (T)
> Deviation and alignment of blast-holes
> Type of drilling pattern (staggered or rectangular)
> Properties of the rock mass and discontinuities
> Properties of the explosive(s) used.
Regardless of the chosen model and its implicit sophistication, the most critical dimension of blasting is none other than the burden, since it represents the rock mass to be fragmented as a result of the detonation of the explosive column in an individual blast-hole. Its value will depend on a combination of variables, including the characteristics of the rock mass and the explosive used.
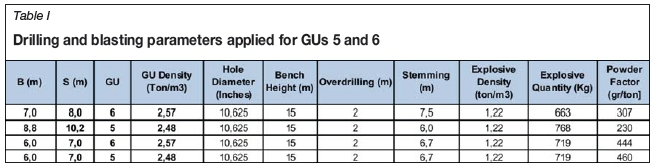
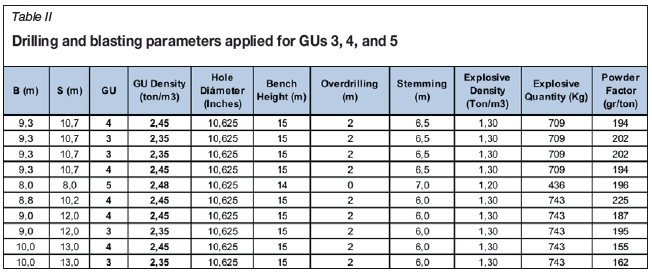
In this regard, and only for illustrative purposes, it should be noted that within the wide range of empirical references available, one that is appropriate for estimating the effect of the burden is the ratio between this dimension and the hole diameter, a dimensionless ratio typically ranging from 20 to 40. Experience suggests that under average field conditions, satisfactory results can normally be expected for values of 30. While the problem is focused on the fine fraction of the size distribution, this ratio is within the aforementioned range (33 <burden / diameter <37) for both the diameter of interest (10 inches, or 270 mm) and the current blasting layouts. Tables I and II show the drilling and blasting practices applied according to the geological units (GUs) that occur in the mine.
It is also important to note that fragmentation by blasting is strongly affected by local geological conditions. For instance, the dip and dip direction of structural sets and their frequency in the rock mass are of great importance, not only because they determine the in situ block size, but they also condition the reflection of stress waves produced by the detonation of explosive charges as long as blasting progresses.
Goal of the study
The aim of this study is to generate empirical models based on statistical analyses to predict the values of P80, P50, and P20of the analysed sample for a set of D&B parameters. Predictive statistical models will be tested with actual data from a Chilean mine. Predicting these variables is key to measuring D&B efficiency, but more importantly it is relevant to predicting copper extraction by heap leaching.
Different ore geotechnical units, called GUs, are identified and ranked according to variables of the rock mass such as compressive strength, frequency of fractures, density, etc. In this study, the data included pertains to GUs 3 and 4 and GUs 5 and 6. In each of these, different D&B practices are applied by modifying the values for burden (B), spacing (5), and explosive charge per blast-hole (Q), and thus different effects on the blast fragmentation are obtained.
Statistical analysis is then aimed at detecting possible correlations between the variables describing D&B with the variables of interest (P80, P50, and P20). In addition to detecting correlations, the following phases study functional relationships emerging of the phenomenon in order to set mathematical models to predict or anticipate size distribution. Usually, there is an attempt to estimate the resulting size distribution, measured on P80 at a sampling line or even a sampling point. However, to fit the D&B layout, an estimate of mean fragmentation is needed, and it is represented by P80 on full blasting, and by P50 and P20 values.
In this article, special emphasis is placed on linear models since nonlinear cases studied did not show significant improvements compared to linear, according to the data available for the study. The whole idea is to derive models aimed at improving the predictive capacity, measured as the relative error between the actual values of the variables and their estimated values. The relative error will be measured as the difference between the estimated value and the actual value divided by the actual value. This relative error is expected to be less than 15% for blast-holes, and with this estimate, the fragmentation prediction measured by the model will be deemed appropriate. This value was considered reasonable given the geological variability of the rock mass and the implementation of the D&B design.
Other non-functional estimation forms can be suggested; for example, the CART method (regression trees), among others. The CART statistical method (for more technical information on these procedures see Breiman, 2001) is descriptive, easy to apply, and often efficient in classifying individuals by proximity of the values of certain variables. In this case, however, as will be shown later, it showed no evidence of improvement over linear regression models.
Blasting modelling
Database and modelling
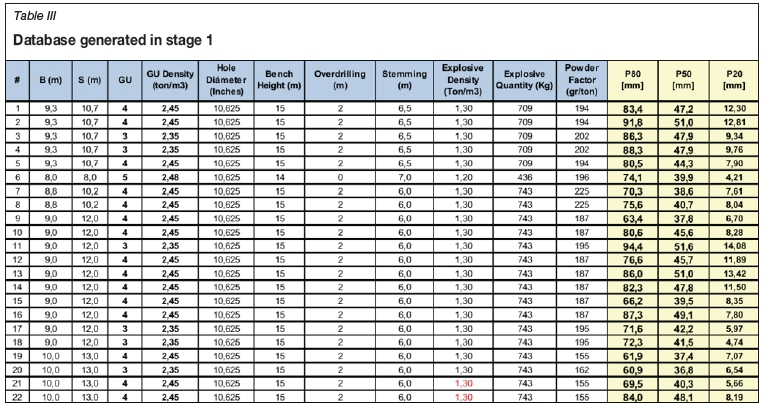
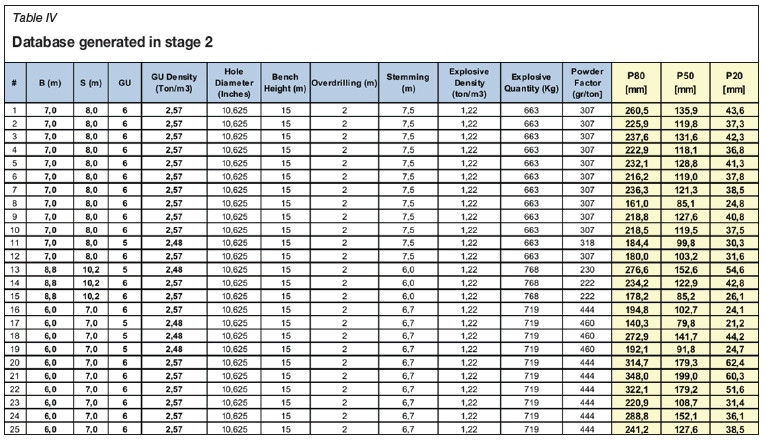
The project considered sampling a total of 47 data lines divided into two stages. Stage 1 considered sampling 22 lines of post-blasting broken material belonging basically to GUs 3 and 4. The second stage considered sampling 25 lines of post-blasting broken material belonging basically to GUs 5 and 6.
On each sample line, the following variables were measured: layout burden (B), layout spacing (5), bench height (H), stemming (T), predominant geotechnical unit in the blast-hole (GU), hole diameter (D), kilograms of explosives charged (Q), and powder factor (PF). Samples of material broken by blasting were taken for size analysis by sieving to measure P80, P50, and P20.
Tables III and IV show the detail of the database used to construct the models.
With this database we began predictive modelling of the expected fragmentation by blasting. The following paragraphs contain a brief summary of the models that showed the best predictive properties for the observed data.
In all models, GU variables are binary, that is, they equal unity when there is a lithological unit, and zero in other cases. In addition, they are mutually exclusive, that is, one and only one out of the four equals unity. The best models obtained for P80, P50, and P20 are displayed in centimetres. All models are least-squares linear regressions.
Model for P80
The following equation shows the relationship between P80 and the type of GU, according to the main variables of blasting.
P80= -20.42806 GU3 -20.97552 GU4 -11.63432 GU5 -7.91386 GU6 -0.11981 Area + 0.05485 Q
where
Area = Burden*Spacing= B*S (m2)
Q: kilograms of explosives per blast-hole.
These variables proved to have the highest statistical significance for the prediction.
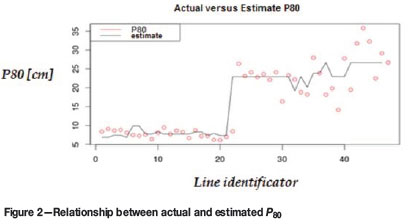
The correlation coefficient of the model is 0.92. This model explains a large percentage of the variability in the data (83% fit). Selected variables are statistically significant and GU 6 is the variable that mainly explains the value of P80. Blasting at GUs 5 and 6 results in a P80 that is 16 cm larger than for GUs 3 and 4. For GUs 5 and 6 the average is around 25 cm, compared to 9 cm for GUs 3 and 4. The mean error of this model is 15.49% for blast-holes and 2.96% for muckpiles (several blast-holes.)
The graph in Figure 2 shows the relationship between the values observed for P80 and the predictions for the 47 blasting lines available in the data obtained from the mine.
Model for P50
The following equation shows the relationship between P50 and the type of GU, according to the main blasting variables.
P50 = 8.83424 GU3 -9.06110 GU4 -4.47821 GU5 -2.46214 GU6 -0.05998 Area +0.02628 Q
where
Area= Burden*Spacing= (B*5) (m2)
Q: kilograms of explosives per blast-hole
The correlation coefficient is 0.90.
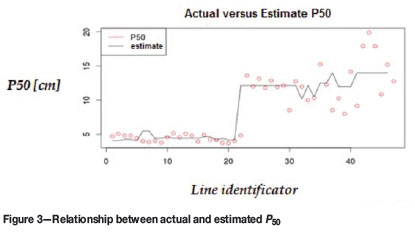
This model exhibits a large percentage of data variability (77% fit), and the variables selected are statistically significant. In this case, the pattern (B and S) and kilograms of explosives have less explanatory significance than in the P80 model, although quite acceptable for this case study. The main variables that affects the P50 value are GU 6 and GU 5. Blasting in GU6 and GU 5 results in a P50 that is about 6 mm larger than for other GUs. The mean error of this model is 15.71% for blast-holes, and 3.24 for muckpiles.
The graph in Figure 3 shows the quality of predictions using this model. As in the former case (P80), the most relevant variable when estimating is the respective GU, because the model essentially decides based on whether this is GU 3-4 or GU 5-6.
Model for P20
The following equation shows the relation between P20 and the type of GU, according to the main variables of blasting.
P20= -1.791332 GU3 -1.744310 GU4 + 0.661212 GU5 + 1.172037 GU6 -0.006157Area -0.006157Q
where
Area = Burden*Spacing= (B*S) (m2)
Q: kilograms of explosives per blast-hole
The correlation between the actual predicted values is 0.88.
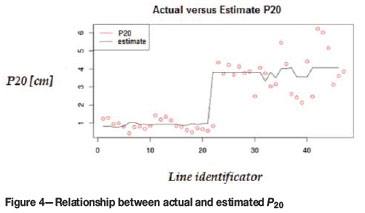
This model exhibits a large percentage of data variability (75% fit.) Since the P50 and P20 values correlate, so do the sign and magnitude of the coefficients obtained. However, unlike other models, the pattern and kilograms of explosives have neither explanatory significance nor desirable magnitude. The main variables that affect the P20 value are GU 6 and GU 5. Blasts in GU 6 result in a P20that is about 3 mm larger than for another GUs. The mean error of this model is 26.34% for blast-holes and 8.52% for muckpiles.
The graph in Figure 4 shows the relationship between actual and estimated P20. It can be seen that the error in the estimation becomes larger as the degree of fragmentation increases.
Conclusions
Although the results of this research have revealed variables with a certain level of significance (stemming, burden, density, explosive), these cannot fully explain the variability of the models. Despite this, the great strength of the models that considered all the available data was their ability to determine in which GU is each line, which has an impact on the values of P80, P50, and P20. While GUs 3 and 4 deliver a P80 close to 8 cm, GUs 5 and 6 obtain P80 values of about 25 cm. This is a very valuable result because it enabled a typical behaviour to be identified for each GU as a relevant variable to estimate P80, P50, and P20 in a given D&B layout for this mining operation.
This research has shown that there is significant correlation between D&B variables, which indicates the possibility of building a predictive tool for fragmentation of blasted material for a particular GU, with reasonable relative errors, close to 15%. This validated hypothesis will enable significant improvements in copper extraction by heap leaching and, in the future, the methodology could be extended to other mining operations in Chile and South America. Our analysis could be replicated in other mines defining appropriated geological units and calibrating new linear models.
In addition to the models shown here, we have tried other classification and prediction techniques such as CART (classification and regression tree), and nonlinear multiplicative models, but these show no evidence of improved predictive power compared with the linear models.
This is possibly due to the paucity of data. Such models require further study using more data with greater variability.
Acknowledgment
We would like to thank Geoblast SA for kindly sharing unpublished fragmentation data. Also, the second author thanks FONDECYT Grant 1130816 and BASAL Project CMM-University of Chile. Finally, the third author thanks a CONICYT doctoral grant.
References
Breiman, L. 2001. Random forests. Machine Learning, vol. 45. pp. 5-32. [ Links ]
Cunningham, C.V.B. 1983. The Kuz-Ram model for prediction of fragmentation from blasting. Proceedings of the First International Symposium on Rock Fragmentation by Blasting, Luleá, Sweden, 23-26 August 1983. Holmberg, R. and Rustan, A. (eds.). Luleá University of Technology. pp. 439-454. [ Links ]
Cunningham, C.V.B. 1987. Fragmentation estimations and the Kuz-Ram model. Proceedings of the Second International Symposium on Rock Fragmentation by Blasting, Keystone, CO, 23-26 August 1987. Fourney, W. and Dick, R.D. (eds). Society for Experimental Mechanics, Bethel, CT. pp. 475-487. [ Links ]
Cunningham, C.V.B. 2005. The Kuz-Ram fragmentation model - 20 years on. Proceedings of the Brighton Conference2005. European Federation of Explosives Engineers. pp. 201-210. [ Links ]
Ouchterlony, F. 2005. The Swebrec© function: linking fragmentation by blasting and crushing. Transactions of the Institution of Mining and Metallurgy, Section A, vol. 114, no. 1. pp. 29-44 [ Links ]
Ouchterlony, F. 2005. What does the fragment size distribution of blasted rock look like? Proceedings of the Brighton Conference 2005. European Federation of Explosives Engineers. pp. 189-199. [ Links ]
Ouchterlony, F. Olsson, M., Nyberg, U., Andersson, P., and Gustavsson, L. 2006. Constructing the fragment size distribution of a bench blasting round, using the new Swebrec function. Fragblast 8. Proceedings of the 8th International Symposium on Rock Fragmentation by Blasting, Santiago, Chile. Editec, Santiago. pp. 332-344. [ Links ]
Spathis, A.T. 2010 Formulae and techniques for assessing features of blast-induced fragmentation distributions. Fragblast 9, Proceedings of the 9 th International Symposium on Rock Fragmentation by Blasting, Granada, Spain. CRC Press. pp. 209-219. [ Links ]
Spathis, AT. 2012., A three parameter rock fragmentation distribution. Measurement and Analysis of Blast Fragmentation. Sanchidrián, J.A. and Singh, A.K. (eds.). CRC Press. pp. 73-86. [ Links ]
Sanchidrián, J.A. et al. 2010. Evaluation of some distribution functions for describing rock fragmentation data. Fragblast 9, Proceedings of the 9th International Symposium on Rock Fragmentation by Blasting, Granada, Spain. CRC Press. pp. 239-248. [ Links ]
Sanchidrián, J.A., Segarra, P., López, L. M., and Moser, P. 2012. On the performance of truncated distributions to describe rock fragmentation. Proceedings of the 10th International Symposium on Rock Fragmentation by Blasting. Workshop on Measurement and Analysis of Blast Fragmentation, New Delhi, India. Sanchidrián, J., Ouchterlony, F., and Singh, A.K. (eds.). CRS Press. pp. 87-96. [ Links ] ♦
Paper received Feb. 2017
Revised paper received Jul. 2017

