


Services on Demand
Article
 English (pdf)
 Article in xml format
 Article references
Indicators

Related links
-
 Cited by Google
 -
 Similars in Google
Share

 Permalink
Journal of the Southern African Institute of Mining and Metallurgy
On-line version ISSN 2411-9717
Print version ISSN 2225-6253
J. S. Afr. Inst. Min. Metall. vol.117 n.11 Johannesburg Nov. 2017
http://dx.doi.org/10.17159/2411-9717/2017/v117n11a10
PAPERS OF GENERAL INTEREST
Target fragmentation for efficient loading and crushing - the Aitik case
A. Beyglou; D. Johansson; H. Schunnesson
Luleå University of Technology, Luleå
SYNOPSIS
Blast-induced fragmentation has a significant influence on the operational efficiency of open pit mines, especially on loading and crushing, the two immediate tasks after blasting. This study presents an empirical method to determine the target fragmentation for efficient loading and crushing at the Aitik mine in Sweden. In the study, the loading efficiency of rope shovels was correlated to the energy consumption and throughput of a gyratory crusher. Two photographic techniques were utilized to assess the feed fragmentation, considering the lithological origin of the ore as an indicator of hardness. The results indicate ore hardness is most influential in mid-range fragmentation, with a marginal effect in coarser fragmentations. The influence of fragmentation is more pronounced in the coarse region, with a sudden reduction in efficiency for P80values coarser than 800 mm. The results suggest tailoring the fragmentation to a P80 of 600-800 mm could lead to higher operational efficiency at Aitik.
Keywords: open pit, fragmentation, loading, crushing, energy, efficiency.
Introduction
Energy efficiency in operations is vital to achieving sustainability in the mining and metals sector. On the one hand, adverse environmental aspects of inefficient energy consumption and their consequent costs to mining companies are driving the industry towards leaner and more responsible operations. On the other hand, high prices of energy, volatile markets, and falling commodity prices put pressure on mines to cut costs and optimize their operations as a whole. Consequently, increasing efficiency has become a priority in many base and precious metals mines.
A great deal of the total energy consumption in most mine sites can be traced to comminution, the process of reducing the size of rock particles to extract their valuable components. Despite differences in their quantitative figures, most studies agree that milling, i.e. crushing, grinding, and separation, is the largest consumer of energy (Napier-Munn, 2015; Ballantyne and Powell, 2014). Although the energy, and eventually costs, for each unit operation are site specific, the figures suggest a more or less equal share in costs for mining and milling processes. Curry, Ismay, and Jameson (2014) evaluated the total costs of 41 open pit operations and found that around 40% of the total costs correspond to operational mining activities, while milling typically accounts for 49%. Therefore, any improvement in the efficiency of either the mining or the milling operation contributes to the overall economy of the operation. There is, however, a fundamental difference between the two; process optimization in the mine revolves around blast-induced fragmentation as the final deliverable of the mine to the crusher, while the crusher product is the initial input for the mill. Such a distinction defines the crusher as the link between the mine and the mill. It also signifies the necessity to assess the downstream effects in a stepwise manner along the comminution process, i.e. direct influence of run-of-mine (RoM) fragmentation on loading and crushing, before the next comminution stage.
This study examines the influence of fragmentation on loading and crushing in mines. The goal is to define an optimum range of fragmentation to yield maximized productivity in these two processes. Such information can be implemented in future models to evaluate the overall influence of fragmentation on the entire mining process, thus helping to improve operations. A gyratory crusher was observed for 20 days and digital images of the crusher feeder were used to assess the fragmentation of each truck cycle, both quantitatively and qualitatively. The fragmentation was then correlated to ore type and efficiency to evaluate its margins of influence on loading and crushing.
Background
From a mine-to-mill point of view, blasting is a crucial step in the comminution chain. The procedures before blasting determine the level of fragmentation and uniformity of the particle size distribution. This, in turn, dictates the efficiency of subsequent tasks in the operation, including loading and crushing. The effects of fragmentation are first seen in loading; no matter what type of machinery is used, fragmentation plays a leading role in loading efficiency. A well-swollen muckpile with a fragmentation tailored to the type and size of the machinery will yield fewer passes and smoother, more efficient loading compared to an inconsistent and disproportionately fragmented muckpile (Williamson, McKenzie, and O'Louglin, 1983; Hawkes, Spathis, and Sengstock, 1995; Onederra et al., 2004; Singh and Narendrula, 2006).
The efficiency and productivity of loading equipment have been studied extensively, especially for electric rope shovels. However, because several qualitative and quantitative descriptors are also associated with loading, it is difficult to determine the individual influence of any one of these on efficiency. For example, loading is influenced by fragmentation, make and design of loading equipment, operator proficiency, loading trajectory, swell, and muckpile shape and looseness (Bellairs, 1987; Hendricks, 1990; Singh and Narendrula, 2006).
Early studies on electric shovels attempted to correlate digging performance of shovels to muckpile fragmentation by using time studies combined with logs of voltage and current in the hoist and crowd motors of rope shovels (Williamson, McKenzie, and O'Louglin, 1983; Hendricks, 1990; Patnayak et al., 2008). Dipper fill factor, dipper payload, dig rate, and frequency of dig cycles have also been used as performance indicators for rope shovels (Onederra et al, 2004; Halatchev and Knights, 2007).
According to Hendricks (1990) and Onederra et al (2004), dig cycle times are not specifically related to digging effort or fragmentation. But digging trajectory, which depends on operator skills, has a great influence on shovel performance. Using geostatistics and data from monitoring systems, Halatchev and Knights (2007) showed basic key performance indicators (KPIs) such as shovel payload can be used to evaluate digging performance and muckpile properties. Based on 20 production blasts in two open pits, Sanchidrián, Segarra, and López (2011) developed a model for loader productivity which took into consideration the rock strength and density, as well as explosive energy and dipper capacity. Hansen (2001) reported measurements of dipper payload for improving shovel performance as well. Patnayak et al. (2008) confirmed the large variability in performance indicators and stressed that these studies should be conducted over a larger number of load cycles to yield meaningful results. All these studies emphasize the complexities involved in assessing loading performance. Owing to operator dependence and variability in muckpile conditions, researchers have not as yet been able to establish a definite correlation of muckpile properties with loading efficiency, but it is possible to evaluate loading performance by statistically assessing basic KPIs over a large number of load cycles.
The next step in the production chain is primary crushing. This is the second mechanical breakage step after blasting; it prepares the RoM ore for further processing in the mill. Crushing typically consumes much less energy than grinding, but it still accounts for a large portion of energy costs in a typical mine operation, and its product has an enormous influence on downstream processes (Murr et al., 2015).
Gyratory crushers play an important role in large scale mines as primary crushing units. As crushing is the link between the mine and the mill, it has two-fold potential for process improvement. Crushing efficiency is determined not only by the design and operational factors of the crusher itself, but also by characteristics of the RoM feed. Therefore, any effort to improve the energy efficiency of crushers must consider both factors, not to mention the requirements for the crusher's product (Evertsson, 2000; Herbst, Lo, and Flintoff, 2003).
The power drawn by gyratory crushers depends on many factors, including size distribution, hardness and shape of the feed, as well as liner profile, feeding rate, closed side setting (CSS), eccentric speed and stroke of the mantle. This complex and dynamic system has been simulated in several models (McKee and Napier-Munn, 1990; Evertsson, 2000; Pothina et al., 2007). Studies show that fragmentation and ore hardness are the most prominent feed characteristics affecting crushing energy consumption (Eloranta, 1995). After much research, scientists at the Julius Kruttschnitt Mineral Research Centre (JKMRC) developed a simulation package to optimize mineral processing circuits (McKee and Napier-Munn, 1990). Included in this package is a model for predicting crusher power draw and product size distribution. However, these models have been developed as tools for the optimization of the entire mineral processing circuit and do not comply with stand-alone crushers (Pothina et al., 2007). Moreover, they are based on comminution theories, such as Bond's work index (Bond and Whitney, 1959), and they depend on a large database of site-specific and machine- specific data gathered over years of research. The complexity and extensive data requirements of these models make them difficult to use in typical industrial conditions.
Pothina et al. (2007) developed an analytical model for energy consumption of gyratory crushers by using CSS and feed size variations. However, the feed fragmentation in this model is based on the Kuz-Ram model (Cunningham, 1983) and is assumed to be a function of burden and spacing, regardless of all other factors affecting blast fragmentation. In reality, it is well known that blast-induced fragmentation in mines varies because of several uncontrollable factors. Variations in lithology, structural geology, explosive performance and precision of drilling and blasting are some of the factors leading to inconsistencies in RoM fragmentation. Therefore, such assumptions about the relationship between burden/spacing and crushing energy are of little practicality in day to day production blasts.
For a specific site, an empirical approach yields more hands-on conclusions. It provides a simple but statistically reliable understanding of the influence of the feed size of a certain ore on the energy consumption of a certain crusher. In practice, the mine has the ability to produce different ore fragmentations by manipulating the blasting set-up. It is, therefore, possible for the mine to tailor the feed material in such way that loading and crushing are performed at peak efficiency. Despite the aforementioned uncertainties in blast fragmentation, having a target fragmentation in mind for a specific ore helps the mine modify the blast set-up to yield a fragmentation as close as possible to the target. This has a great influence on operational efficiency in the long term.
Aitik mine
At 3 km long, 1.1 km wide, and 450 m deep, Aitik is one of the largest open pit copper mines in the world. It is situated about 60 km above the Arctic Circle in northern Sweden and has been owned and operated by Boliden Mineral AB since 1968. The Aitik deposit comprises metamorphosed plutonic, volcanic, and sedimentary rocks. The ore zone consists of biotite gneiss, biotite schist, and muscovite schist with dykes of pegmatite cutting through.
Despite its low grade ore (0.22% copper on average), Aitik is considered one of the most efficient open pit mines in operation. In 2015, its annual production of ore reached more than 36 Mt, yielding about 67 kt of copper, 61 t of silver, and 2 t of gold. Its efficiency stems from its in-pit crushing and conveying system, as well as advanced technological infrastructure and monitoring systems. These permit the mine to audit and improve the operation continuously. In fact, the well-coordinated fleet management system and comprehensive data collection during all stages of operation provided a solid platform for this study. Data from different sources could be extracted and utilized to correlate fragmentation to both loading and crushing.
Data collection and methods
The goal of this study was to investigate the effects of fragmentation on the efficiency of loading and crushing. It also considered rock hardness, as crushing efficiency is sensitive to the hardness of the ore. Because different factors are important at different stages of a mine's production, it is crucial to define a unit mass of ore and follow it up the production chain. The most suitable unit for such a purpose in a fully operational mine is the haul truck, as it can be tracked from the muckpile to the crusher by means of fleet data. A schematic illustration of the ore-tracking method and factors extracted at each stage is presented in Figure 1.
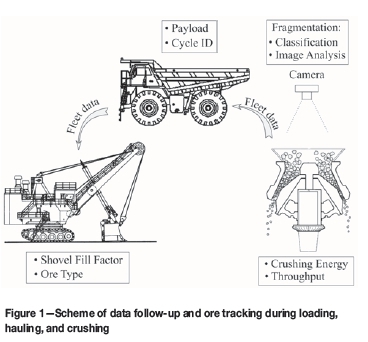
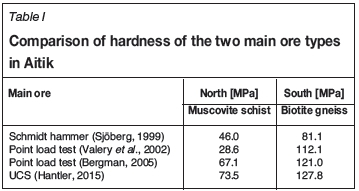
As seen in Figure 1, the data corresponding to each truckload was acquired by back-tracking it from the targeted crusher to the muckpile. Each ore unit (i.e. one truckload) was photographed after the truck dumped it in the crusher inlet. The photographs were used to assess the fragmentation using image analysis and ordinal classification. The energy consumption in the crusher was recorded for the entire cycle and was normalized to the tonnage of crushed ore. By incorporating fleet data, each truck could be traced to its corresponding rope shovel, thus allowing loading efficiency and the coordinates of the ore unit to be extracted as well. The loading coordinates were later cross-referenced with geological data to define the lithological origin of the ore. Unfortunately, complex geology, uncertain mechanical properties, and low spatial resolution of lithological information in the mine did not permit a strict distinction of ore types for the studied cycles. Hence, the mine was roughly divided into two main areas: north and south. During the study, the mined ore in the north area had a large content of muscovite schist, while the south ore contained a high amount of biotite gniess. A summary of the mechanical tests on specimens of these ores is presented in Table I.
All truckloads were traced back to their original coordinates in the mine and were distinguished to be from either the north or south area. This over-simplified distinction between the two is due to uncertainties in the lithological content of truckloads as well as large variations in hardness between different specimens. As the mechanical properties of these ores do not fit within the scope of this study, the results were simply separated by origin. Therefore, the following comparisons of the two ores do not take into consideration the numerical difference in hardness of the material, but simply indicate the origin of the ore as either north or south, considering that south ore is generally harder than north ore. Additionally, since the nominal density of both ore types is identical, density differences were not considered in the analysis of loading or crushing and are not given in what follows.
Given the large quantity of the data in this scheme, each of the aforementioned stages included careful filtering and selection procedures to keep external factors at bay. The 20-day study period provided fully compatible data for 225 truckloads, equivalent to approximately 50 kt of ore.
Fragmentation
Assessing blast-induced fragmentation has been one of the most challenging tasks for both researchers and the industry. Until now, the only reliable method to quantify the sizedistribution of a muckpile has been physical sieving, yet it yields reliable results only if the process is carried out carefully using adequately large samples and in a controlled environment. Because of its time-consuming and costly nature, this method is generally disregarded by industry and the research community; few studies present full-scale sieving results, and they all agree on its practical difficulties (Ouchterlony, Bergman, and Nyberg, 2010; Wimmer et al., 2015).
Since the 1980s, photographic techniques have been used as non-contact measurement tools to estimate the size distribution of muckpiles. Image-based fragmentation assessment started with the visual comparison of muckpiles to scaled photographs; it later advanced to 2D image analysis techniques, and more recently broadened to include more complicated 3D analysis using laser scanning or photogrammetric methods (Thurley, Wimmer, and Nordqvist, 2015). One of the simplest methods of using photographs to assess fragmentation is to compare the target muckpile to reference images of standardized muckpiles. An early example of this method is the 'Compaphoto' technique, introduced by Aswegen and Cunningham (1983). The technique is based on visual comparison of the target muckpile to scaled photographs of standardized muckpiles and uses the Rosin Rammler function to estimate the particle size distribution. In a recent study, Wimmer et al. (2015) used a similar but customized approach in the so-called quick rating system (QRS). This method was developed to classify the fragmentation of LHD bucketloads into four classes of median fragment size (P50) and three subclasses of uniformity index (n) varying from 0.6 to 2.2. These researchers also compared the results from a rating system, 2D and 3D image analysis, and physical sieving of LHD bucketloads. They reported that the quick rating system showed consistent results between users, except for fine-medium material of an inhomogeneous character. The method was also found reliable - if used carefully - and accurate in comparison with 2D image analysis.
2D image analysis techniques have been studied extensively, with various disadvantages pointed out by several researchers (Hunter et al., 1990; Chavez et al., 1996; Maerz and Zhou, 1998; Lathham et al., 2003; Thurley and Ng, 2005; Sanchidrián et al., 2009; Spathis, 2009). Because of the method's shortcomings, the repeatability of 2D image-based measurements is generally poor. Segregation of differently sized particles in a muckpile, the lay and aspect ratio of fragments, overlapping fragments, insufficient and biased sampling, imaging inconsistency (lighting, scaling, and perspective), inaccurate automatic delineation, and time-consuming and user-dependent manual delineation are some of the drawbacks of this technique. If done carefully, however, 2D image analysis can provide insights into the trends of variations in fragmentation; these trends may not describe the entire size distribution accurately, but they are still more practical than physical sieving and have been proven useful over years of experience in the industry.
The errors and shortcomings of both classification and image analysis techniques are well known. However, with consistent measurement procedures and statistically reliable sampling, researchers can identify the trends of variation with either method. Maerz and Zhou (1998) state:
'Processes such as blasting [and crushing] can be characterized by looking at the relative differences between two measurements, and consequently the absolute error is not important.'
On the one hand, the advantage of the classification method lies in its fast and straightforward procedure which allows a large number of samples. However, it only shows subjective trends in the mean RoM fragmentation with little information on the details of size distribution. 2D image analysis, on the other hand, is limited to a much smaller number of samples because of the time-consuming delineation procedure. Yet it yields a detailed quantitative assessment of particle size distribution. Given their respective strengths and weaknesses, this study used both 2D image analysis and ordinal classification of fragmentation and compared the results.
The gyratory crusher at Aitik includes two bays where the trucks dump the ore directly into the crusher inlet. Each bay is equipped with several closed-circuit cameras with realtime feed and a stationary camera aimed at the crusher inlet. In this study, the bay cameras were used to double-check the time-tag of dumps, while the camera aimed at the inlet was used to assess the feed fragmentation for each crushing cycle. This latter camera provided a continuous video feed at two frames per second, and fragmentation was based upon single frames of each cycle sampled every five seconds, as each cycle typically took 4-6 minutes to finish. Consequently, each crushing cycle was assigned a series of images with a five-second interval. A sample image of the crusher inlet with its dimensions is presented in Figure 2.
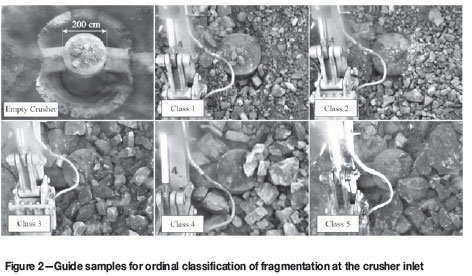
The study assessed the feed fragmentation of crushing cycles in two stages. In the first stage, all image sequences were classified into five ordinal categories, with class 1 the finest and class 5 the coarsest fragmentation. In the second stage, eight cycles from each class were selected and then analysed using Split-Desktop image analysis software (Kemeny et al., 2002).
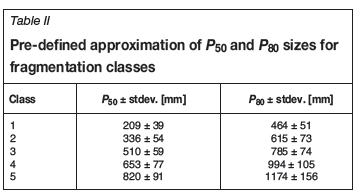
One of the authors performed the five-class rating of the cycles based on a visual comparison of all images of the cycle with a series of predefined sample images for each class. Figure 2 shows samples of each class. The choice of guide samples for classes was based on image analysis of three sample images per class. The median fragment size (/50) and 80% passing size (P80) values of images were extracted before classification and used to define more or less equal size-spans for each class in such way as to cover the entire range of observed fragmentation. The numerical values were not used to classify cycles, as the rating was solely qualitative, i.e. comparing the image sequence of each cycle to guide samples and rating them from 1 to 5. The range of pre-defined values for the /50 and /80 of each class is presented in Table II.
The image sequences from selected cycles were inspected carefully for any external factor affecting the crushing cycle and feed size at the crusher inlet, e.g. interruptions in the cycle due to boulders. The circular steel protector of the mantle was visible in almost all images, hence its diameter was measured and used as a scale to estimate fragment size. Since the camera was stationary and perpendicular to the crusher inlet, all images included identical viewpoints, thus minimizing errors introduced by perspective. The crusher inlet was lit by artificial light to reduce lighting variations. Finally, all images were enhanced by increasing their contrast and sharpened using the Unsharp Mask tool in Adobe Photoshop™ for better particle delineation (Wimmer et cel., 2015).
All images were delineated manually by only one user to minimize the user-dependency of the results. Due to uncertainties in theoretical estimation of fines, no fines factor was used in the analysis, and only visible particles were included in size distribution curves (Spathis, 2009). Finally, the 50% and 80% passing sizes for each cycle were extracted and correlated to the loading and crushing efficiency of cycles. However, it should be mentioned again that despite all efforts to minimize errors, the image analysis technique is not in any way comparable to full-scale sieving. The P50 and P80 values are not expected to represent the true size distribution of the feed. Thus, the results can only be considered quantitative figures suitable to compare the size distributions of different feeds and identify trends.
Crushing efficiency
The gyratory crusher studied here is an Allis-Chalmers Superior 60-109. The diameter at the lower part of the mantle is 2770 mm, and the closed side setting (CSS) of 160180 mm determines the crusher product. Depending on the characteristics of the ore, the coarsest particles after crushing vary from 350 to 400 mm in size (Bergman, 2005). During the study, the CSS and the eccentric speed of the crusher were kept constant, so the only variable was the torque applied on the motor for effective breakage, measured in terms of power draw (kW). The power draw at the crusher motor was sampled every nine seconds. The raw data was then broken down into crushing cycles by cross-referencing the power draw curve to the fleet logs, and each cycle was given a unique ID.
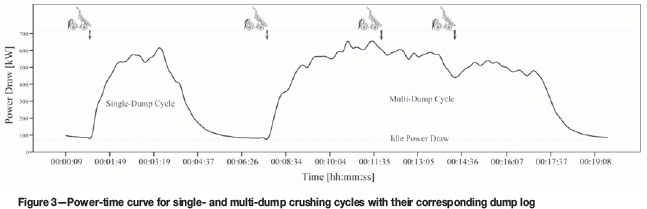
Only the single-dump cycles were selected for further analysis. The single-dump cycles, as opposed to multi dump (choked) cycles, correspond to the crushing cycles in which the material from a single truck is dumped into the feeder; no other material is dumped until the cycle is finished. Figure 3 shows samples of single-dump and multi-dump cycles of the crusher. The reason for this selection is that gyratory crushers perform slightly differently under choked conditions (Eloranta, 1995). A choked crusher will go through a continuous material flow with heavier particle interaction and a varying force of gravity. This, in turn, could introduce bias into the energy consumption measurements. In addition, at the study mine, the blending of material in multi-dump cycles made it impossible to trace the ore to a specific coordinate in the mine, possibly compromising the material follow-up as well as energy and tonnage estimation.
All crushing cycles included in the study were from single dumps. Each cycle started as soon as the material entered the idle crusher and ended when all the material had passed through and the status returned to idle. In this way, the start and end of all cycles could be distinguished precisely, and the influence of the rise and fall in torque of the motor was evident for all cycles. Furthermore, the duration of each cycle could be accurately extracted for further analysis of momentary throughput.
The energy consumption in the crusher was calculated for each cycle by integrating the area under the power-time curve (Figure 3). The consumed energy was normalized to the tonnage of the crushed material from the fleet logs, and energy consumption per unit mass was extracted and presented in kWh/t for each crushing cycle. As the tonnage and duration were known for each cycle, the instantaneous throughput of the crusher could also be calculated.
Loading efficiency
The load and haul fleet at Aitik mine comprises a variety of electric and hydraulic shovels combined with differently sized haul trucks. Loading efficiency is comparable only between similar types and makes of machinery, as the mechanisms and capacities of different rope shovels vary widely. Consequently, all truck cycles included in the study were filtered to include only identical shovels loading identical trucks, namely P&H4100C shovels with an 81.7 t dipper capacity loading CAT793 trucks with a capacity of 227 t. When the truck payloads were comparable, the crushing cycles could be evaluated and the loading efficiency determined for identical shovel-truck combinations.
The studied trucks were normally loaded to full capacity by three to five shovel passes, depending on the fragmentation and diggability of the muckpile. The payload and number of shovel passes to fill a corresponding truck were used to estimate the mean payload of the dipper in each cycle. The mean payload of each dipper pass was compared to the nominal capacity of the dipper, and the mean fill factor was calculated and presented as a percentage of full dipper capacity.
Although loading is an operator-dependent task, this was not considered in the analysis because of the number of cycles and operators. However, in a previous study of Aitik, the authors compared the performance of different operators and concluded the influence of muckpile diggability on loading is greater than that of operator skills (Beyglou et al., 2015). Therefore, the present study assumed the operator effect to be negligible, especially as similar operators operated all shovels in circulation during the study.
Results and analysis
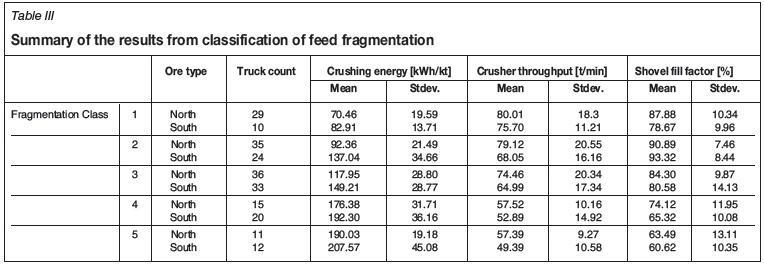
A summary of the classification results is presented in Table III. Mean values for crushing energy, crusher throughput, and fill factor of shovel dipper are separated by ore type (north/south) and presented for each fragmentation class.
Table III shows that the crushing energy consumption gradually increases as fragmentation shifts from fine to coarse. Meanwhile, throughput shows a consistent decrease with increasing fragment size. The fill factor shows the highest loading efficiency for class 2 fragmentation (i.e., finer fragmentation); it gradually decreases as fragmentation reaches the very coarse end (class 5). To determine the statistical distribution of values in each class, Figures 4-7 compare means and quartiles across fragmentation classes.
As seen in Figure 4, the mean energy consumption shows a consistent stepwise increase from class 1 (very fine) to 5 (very coarse). For all fragmentation classes, the south ore (harder ore) consumes more energy than the north ore (softer ore). The difference is largest for classes 2 and 3, implying that ore hardness is less influential for crushing very fine or very coarse fragmentations. In addition, the increase in energy consumption from class 4 to 5 is smaller than that between other classes in both ores, especially from class 3 to 4, which shows the largest difference. This indicates that fragmentation is less influential when the particles are larger than a certain size. This can be seen in the distribution plot as well. However, the distribution of the values exhibits rather large variation spans in all classes. Overall, the variations increase as fragmentation becomes coarser. The largest spans, for classes 4 and 5, show a more or less similar statistical range of variation. It is also apparent that the lower and upper quartiles lie relatively far away from the minimum and maximum values, suggesting that the statistical spread includes a wide scatter.
The analysis of mean crusher throughput (Figure 5) shows that the largest decrease in throughput occurs between class 3 and class 4. There is a slight decrease from classes 1 to 3, a significant drop from classes 3 to 4, and a marginal difference between classes 4 and 5. In all classes, the south ore shows a 5-10% reduction in throughput compared to the north ore. As in energy consumption, the differences between north and south ores are more pronounced in classes 2 and 3 and marginal in classes 1, 4, and 5. The distribution of throughput demonstrates large variations in classes 1 through 3, with more or less similar ranges in all quartiles, and classes 4 and 5 showing comparatively smaller, but identical throughputs overall.
The fill factor of the shovel dipper (Figure 6) shows a dissimilar trend. Firstly, the influence of ore type is not as pronounced for loading as for crushing. North and south ores show closely comparable means and medians. Secondly, the fill factor in class 1 is lower than in class 2, indicating medium-fine fragmentation has higher diggability than very fine fragmentation. The fill factor gradually decreases from classes 2 through 5. The quartiles in the distribution plot also show a decrease, with a marginal difference between the two ores.
The results of the classification of feed fragmentation give an overview of the trends in loading and crushing efficiency over a relatively large sample population (n=225). In contrast, the image analysis results, presented in Figure 7, provide a detailed view of about 40 single crushing cycles. Since P80 and P50of the size distributions were strongly correlated (Figure 7a), the image analysis results are presented only in terms of P80. More or less similar trends were observed for P50, but are not presented here.
The plot of crushing energy against P80 of the feed (Figure 7b) demonstrates a correlation similar to that found in the classification results. The energy consumption increases as fragmentation reaches the coarse end of the spectrum. The regression lines show that south ore generally consumes more energy during crushing, though the difference is marginal in the fine end of the fragmentation range and increases with /80. The difference between the ores is more pronounced in the mid-range (P80=600-800 mm) and includes large scatter at the coarse end. This agrees well with the results obtained from classification; however, the variations at the coarse region of the plot could imply that factors other than ore type and fragmentation have influenced the energy consumption.
The throughput of the crusher (Figure 7c) also shows a decreasing trend as fragmentation becomes coarser, but the low correlation coefficients imply that in single crushing cycles, the throughput is not only affected by fragmentation, but also by external factors such as feeding rate (material flow) and shape of fragments. The regression lines show that, on average, south ore yields less throughput than north ore, but the values do not show a strong correlation to either size or ore type in this number of samples (n=40). The fill factor of the electric shovels (Figure 7d) shows an even weaker correlation with /80. The trend of the overall envelope suggests diggability decreases with increasing /80. But the correlation coefficients are rather small, and no distinct difference is observed between the two ores, as all points lie within a similar, wide statistical range. This could arguably be due to inaccuracies in fragmentation measurements, or other factors related to the machinery; either way, the large scatter does not allow a definite conclusion about the loading efficiency.
Summary and conclusion
This study analysed the feed fragmentation of 225 single-dump crushing cycles statistically in an ordinal manner. It considered the fragmentation for 40 of the cycles using an image analysis tool and correlated the results to the crushing energy consumption per unit mass, throughput of the crusher and fill factor of the shovel dipper. The crushing cycles were traced to their loading origin and subjectively separated by estimated ore hardness. During the study period, the CSS of the crusher was kept constant, as was the rotational speed of the mantle. The loading efficiency was compared for identical electric rope shovels. The classification and image analysis were conducted in a systematic manner with images from a single stationary camera aimed at the crusher inlet. The findings are summarized as follows.
> The results indicate a consistent difference between the soft and hard ores in their crushing efficiency. Both the classification and the image analysis show that, regardless of size distribution of the feed, the harder ore (south) involves higher energy consumption and lower throughput than the softer ore (north)
> The influence of ore hardness is most pronounced in mid-range fragmentation (classes 2 and 3), implying hardness matters less for very fine or very coarse fragmentations
> The largest change in both energy consumption and throughput of the crusher occurs between class 3 and class 4 fragmentations. This indicates that the efficiency decreases slightly as the fragmentation becomes coarser (from class 1 to 3), but as the fragmentation exceeds a certain size (between class 3 and 4), the efficiency drops considerably. Interestingly, for the very coarse fragmentations (class 5), the efficiency does not decrease significantly
> The loading efficiency shows no correlation to the hardness of the ore. The highest efficiency is observed in mid-fine range fragmentation (class 2). It decreases thereafter with increasing feed size
> The general trends in crushing and loading efficiency are consistent in both the classification and the image analysis results. However, a comparison of the results shows both methods include large scatters. The classification method provides a much larger sample population and is, therefore, statistically more representative than the image analysis of limited samples. Although both methods are image-based and include similar drawbacks, the trends in classification results are more reliable for subjective evaluations. This is more evident for the throughput and fill factors; they show very large scatters in both methods, but the broad sampling in classification leads to more representative results over a larger population
> Several shortcomings of image-based methods to assess fragmentation were observed in this field study. These observations were not easily measurable in a non-contact manner, but affected the results in one way or another. Segregation of material, lay and shape of fragments, overlapping fragments, and inhomogeneity within each sample (truck) were some of the factors causing inaccuracies, not only in fragmentation assessment but also in loading and crushing. Despite their limitations, these methods are the only available tools to measure fragmentation.
Finally, the findings of this study suggest that higher loading and crushing efficiencies can be achieved in Aitik mine. This could be accomplished by tailoring the blast-induced fragmentation to class 2 or 3, approximately equivalent to a /80 of 600-800 mm. Such target fragmentation could be achieved by using field trials to find the most economical blast set-up satisfying those requirements. Furthermore, the results suggest that the crushing efficiencies are different for north and south ores, something to consider in blast design and cost estimations. The target fragmentation for loading and crushing can be correlated to the operational parameters of the crusher and the efficiency of the mill to find the most suitable combination for efficient milling. Subsequent cost estimations for each unit operation can determine a combination of blast set-up, crusher setting, and milling parameters to eventually yield the highest overall chain value of this particular operation in the long term.
Acknowledgments
Boliden Mineral AB, especially the staff and management of the Aitik mine are gratefully acknowledged for the support and valuable input they provided during this study. This work was supported by Vinnova, The Swedish Energy Agency, Formas, LKAB, and Boliden Mineral AB through the SIP-STRIM programme.
References
Aswegen, H.V. and Cunningham, C.V.B. 1986. The estimation of fragmentation in blast muckpiles by means of standard photographs. Journal of the South African Institute of Mining and Metallurgy, vol. 86, no. 12. pp. 469-474. [ Links ]
Ballantyne, G.R. and Powell, M.S. 2014. Benchmarking comminution energy consumption for the processing of copper and gold ores. Minerals Engineering, vol. 65. pp. 109-114. [ Links ]
Bellairs, P. 1987. The application of geological and downhole geophysical data to blast pattern design, Proceedings of the 2nd International Symposium on Rock Fragmentation by Blasting, Keystone, Colorado. pp. 398-411. [ Links ]
Bergman, P. 2005. Optimisation of fragmentation and comminution at Boliden Mineral, Aitik Operation. Licentiate thesis, Luleå University of Technology, Sweden. [ Links ]
Beyglou, A., Schunnesson, H., Johansson, D., and Johansson, N. 2015. Adjusting initiation direction to domains of rock mass discontinuities in Aitik open pit mine. Proceedings of the 11th International Symposium on Rock Fragmentation by Blasting, Sydney, Australia. Australasian Institute of Mining and Metallurgy, Melbourne. pp. 385-391. [ Links ]
Bond, F.C. and Whitney, B.B. 1959. The work index in blasting. Proceedings of the 3rd US Symposium on Rock Mechanics (USRMS). American Rock Mechanics Association. pp.78-90. [ Links ]
Chavez, R., Cheimanoff, N., and Schleifer, J. 1996. Sampling problems during grain size distribution measurements. Proceedings of the 5th International Symposium on Rock Fragmentation by Blasting, vol. 5, pp. 245-252. [ Links ]
Cunningham, C.V.B. 1983. The Kuz-Ram model for prediction of fragmentation from blasting. Proceedings of the 1st International Symposium on Rock Fragmentation by Blasting, Luleå, Sweden. vol. 2, pp. 439-453. [ Links ]
Curry, J.A., Ismay, M.J., and Jameson, G.J. 2014. Mine operating costs and the potential impacts of energy and grinding, Minerals Engineering, vol. 56. pp. 70-80. [ Links ]
Eloranta, J. 1995. Influence of crushing process variables on the product quality of crushed rock. PhD thesis, Tampere University of Technology, Finland. [ Links ]
Evertsson, C.M. 2000. Cone crusher performance. PhD thesis, Chalmers University of Technology, Goteborg, Sweden. [ Links ]
Halatchev, R.A. and Knights, P.F. 2007. Spatial variability of shovel dig performance. International Journal of Mining, Reclamation and Environment, vol. 21, no. 4. pp. 244-261. [ Links ]
Hansen, J. 2001. Electric rope shovel monitoring. CIM Bulletin, vol. 94, no. 1052. pp. 80-82. [ Links ]
Hantler, A. 2015. Crushing index - Aitik. Technical Report, no. 8HX286586.10, Pöyry Sweden AB. [ Links ]
Hawkes, P.J., Spathis, A.T., and Sengstock G.W. 1995. Monitoring equipment productivity improvements in coal mines. Proceedings of EXPLO 95 Conference, Brisbane. Australasian Institute of Mining and Metallurgy, Melbourne. pp. 127-132. [ Links ]
Hendricks, C. 1990. Performance monitoring of electric mining shovels. PhD thesis, McGill University, Montreal, Canada. [ Links ]
Herbst, J.A., Lo, Y.C., and Flintoff, B. 2003. Size reduction and liberation. Principles of Mineral Processing. Fuerstenau, M.C and Han, K.N. (eds). SME, Littleton, Colorado. pp. 61-118. [ Links ]
Hunter, G.C., McDermott, C., Miles, N.J., Singh, A., and Scoble, M.J. 1990. A review of image analysis techniques for measuring blast fragmentation. Mining Science and Technology, vol. 11. pp. 19-36. [ Links ]
Kemeny, J., Mofya, E., Kaunda, R., and Lever, P. 2002. Improvements in blast fragmentation models using digital image processing. Fragblast, vol. 6, no. 3-4. pp. 311-320. [ Links ]
Latham, J.P., Kemeny, J., Maerz, N., Noy, M., Schleifer, J., and Tose S. 2003. A blind comparison between results of four image analysis systems using a photo-library of piles of sieved fragments. Fragblast, vol. 7, no. 2. pp. 105-132. [ Links ]
Maerz, N.H. and Zhou, W. 1998. Optical digital fragmentation measuring systems-inherent sources of error. Fragblast, vol. 2, no. 4. pp. 415-431. [ Links ]
McKee, D.J. and Napier-Munn, T.J. 1990. The status of comminution simulation in Australia. Minerals Engineering, vol. 3, no. 1. pp. 7-21. [ Links ]
Murr, D.L., Workman, L., Eloranta, J., and Katsabanis, T. 2015. Blasting influence on comminution. Proceedings of the Sixth International Conference on Semi-autogenous and High Pressure Grinding Technology, Vancouver, Canada. http://www.ceecthefuture.org/publications/5911/ [accessed 8 June 2016]. [ Links ]
Napier-Munn, T. 2015. Is progress in energy-efficient comminution doomed? Minerals Engineering, vol. 73. pp. 1-6. [ Links ]
Onederra, I.A., Brunton, I.D., Battista, J., and Grace, J. 2004. 'Shot to shovel'-understanding the impact of muck pile conditions and operator proficiency on instantaneous shovel productivity. Proceedings of EXPLO2004 Conference, vol. 3. Australasian Institute of Mining and Metallurgy, Melbourne. pp. 205-213. [ Links ]
Ouchterlony, F., Bergman, P., and Nyberg, U. 2010. Fragmentation in production rounds and mill throughput in the Aitik mine, a summary of development projects 2002-2009. Report no. 2010:3. Swebrec, Luleå University of Technology, Sweden (in Swedish). [ Links ]
Patnayak, S., Tannant, D.D., Parsons, I., Del Valle, V., and Wong, J. 2008. operator and dipper tooth influence on electric shovel performance during oil sands mining. International Journal of Mining, Reclamation and Environment, vol. 22, no. 2. pp. 120-145. [ Links ]
Pothina, R., Kecojevic, V., Klima, M.S., and Komljenovic, D. 2007. Gyratory crusher model and impact parameters related to energy consumption. Minerals and Metallurgical Processing, vol. 23, no. 3. pp. 170-180. [ Links ]
Sanchidrián, J.A., Segarra, P., Ouchterlony, F., and López, L.M. 2009. On the accuracy of fragment size measurement by image analysis in combination with some distribution functions. Rock Mechanics and Rock Engineering, vol. 42, no. 1. pp. 95-116. [ Links ]
Sanchidrián, J.A., Segarra, P., and López, L.M. 2011. On loader productivity, rock strength and explosive energy in metal mining. Proceedings of the Sixth EFEE World Conference on Explosives and Blasting, Lisbon, Portugal. pp. 461-468. [ Links ]
Singh, S.P. and Narendrula, R. 2006. Factors affecting the productivity of loaders in surface mines. International Journal of Mining, Reclamation and Environment, vol. 20, no. 1. pp. 20-32. [ Links ]
Sjõberg, J. 1999. Analysis of large scale rock slopes. PhD thesis, Luleå University of Technology, Sweden. [ Links ]
Spathis, A.T. 2009. Formulae and techniques for assessing features of blast-induced fragmentation distributions. Proceedings of the 9th International Symposium on Rock Fragmentation by Blasting, Granada, Spain. pp. 209-219. [ Links ]
Thurley, M.J. and Ng, K.C. 2005. Identifying, visualizing, and comparing regions in irregularly spaced 3D surface data. Computer Vision and Image Understanding, vol. 98, no. 2. pp. 239-270. [ Links ]
Thurley, M.J., Wimmer, M., and Nordqvist, A. 2015. Blast fragmentation measurement based on three dimensional imaging in sublevel caving drawpoints and underground excavator buckets at LKAB Kiruna. Proceedings of the 11th International Symposium on Rock Fragmentation by Blasting, Sydney, Australia. Australasian Institute of Mining and Metallurgy, Melbourne. pp. 763-773. [ Links ]
Valery, W., Thornton, D., Jankovic, A., and Kristiansen, J. 2002. Mine to mill scoping study at Aitik Mine Boliden. Technical Report no. TM_REP 2002/006, Boliden Mineral AB, Sweden. [ Links ]
Williamson, S., McKenzie, C., and O'Louglin, H. 1983. Electric shovel performance as a measure of blasting efficiency. Proceedings of the 1st International Symppsium on Rock Fragmentation by Blasting, Luleå, Sweden. pp. 625-635. [ Links ]
Wimmer, M., Nordqvist, A., Righetti, E., Petropoulos, N., and Thurley, M.J. 2015. Analysis of rock fragmentation and its effect on gravity flow at the Kiruna sublevel caving mine. Proceedings of the 11th International Symposium on Rock Fragmentation by Blasting, Sydney, Australia. Australasian Institute of Mining and Metallurgy, Melbourne. pp. 775-791. [ Links ] ♦
Paper received Jun. 2016
Revised paper received Feb. 2017

