


Servicios Personalizados
Articulo
 Inglés (pdf)
 Articulo en XML
 Referencias del artículo
Indicadores

Links relacionados
-
 Citado por Google
 -
 Similares en Google
Compartir

 Permalink
Journal of the Southern African Institute of Mining and Metallurgy
versión On-line ISSN 2411-9717
versión impresa ISSN 2225-6253
J. S. Afr. Inst. Min. Metall. vol.117 no.10 Johannesburg oct. 2017
http://dx.doi.org/10.17159/2411-9717/2017/v117n10a10
CONFERENCE PAPERS
Alternative carbon materials as practical and more durable fuel cell electrocatalyst supports than conventional carbon blacks
M.L. Stevenson; G. Pattrick
HySA/Catalysis, South African Council/or Mineral Technology, Mintek, South Africa
SYNOPSIS
Conventional low-temperature proton exchange membrane fuel cell (LTPEMFC) electrocatalyst supports suffer from excessively high corrosion rates. In this work, several alternative carbons were investigated in terms of their viability to produce 'drop-in' alternative electrocatalysts to the conventional materials while providing significantly enhanced support corrosion resistance. This was to establish their potential to serve both current and future markets. The materials examined were: partially graphitised Vulcan, a hierarchical porous graphene-like material and commercial graphitised carbon nanofiberes (CNFs). Samples were prepared at 40 wt% Pt loading and performance compared to conventional Pt (40wt%)/Vulcan and Pt (40wt%)/Ketjenblack. CNFs were the only material to display improved corrosion resistance over the conventional supports. The catalyst did, however, suffer from comparatively low beginning-of-life performance. This work did nonetheless demonstrate good promise for the commercial CNF support in producing functional electrocatalysts that could (a) potentially be directly substituted into well-established conventional catalyst-based MEA manufacturing processes and (b) offer considerably enhanced support corrosion resistance.
Keywords: PEM fuel cell, electrocatalyst support, corrosion, carbon nanfibres, durability.
Introduction
Conventional electrocatalysts supported on Vulcan XC72R and Ketjenblack EC300J display poor durability under typical automotive operating conditions, as well as certain stationary applications (Zhang, 2008; Gasteiger, Vielstich and Lamm, 2003; Rabis, Rodriguez and Schmidt, 2012). This leads to fuel cell stack lifetimes far lower than current targets set by the US Department of Energy (5000 hours for automotive; 40 000 hours for stationary) (US Department of Energy, 2013). Two major degradation mechanisms, particularly on the cathode, are responsible for this: instability in the nanometre-sized Pt particles on the catalysts and corrosion of the carbon support material (Gasteiger, Vielstich and Lamm, 2003). Both of these mechanisms lead to losses in active area and, as a result, losses in catalytic activity of the materials. Corrosion of the support also reduces the porosity of the electrode catalyst layers, decreasing the accessibility of reagent gases to the active sites on the catalyst (Schulenburg et al., 2011).
Typically, systems-level measures are incorporated into the fuel cell stack design to prevent modes of operation which are particularly damaging to the support (Zhang, 2008; Gasteiger, Vielstich and Lamm, 2003). Carbon corrosion does nevertheless occur and so to further improve the useful life of the membrane electrode assembly (MEA), catalysts supported on materials with inherently higher corrosion resistance are needed.
Conventional supports possess several properties essential for high performance catalyst layers within MEAs (Rabis, Rodriguez and Schmidt, 2012), which alternative carbons would also need to maintain:
► High electronic conductivity, in excess of 1 S/cm. This is needed to keep electronic resistance (ohmic) losses in the catalyst layer to a minimum
► High specific surface area, in the region of 50 to 800 m2/g, to achieve high dispersions of the active Pt metal. This is to maximise the utilisation of the catalyst
► Ability to form a structure with high porosity when fabricated into catalyst layers. This is essential for creating a large three-phase interfacial area in the electrodes of an MEA.
Increasing the graphitic content of a carbon material is a common technique to improve its stability. Yu et al., (2006) reported that with in situ testing, an MEA fabricated using a catalyst supported on a graphitised carbon black showed a degradation rate five times lower than that of an MEA made with a standard carbon-black-supported catalyst. This was after 1000 start/stop cycles - a degradation protocol particularly taxing to a carbon support.
Highly graphitised carbon materials other than carbon black are also being investigated as viable alternative supports. In particular, graphitised carbon nanofibres and nanotubes have shown promise in producing catalysts with high metal dispersions and improved support corrosion resistance over the standard carbon blacks (Guha, Zawodzinski and Schiraldi, 2008; Lee et al., 2006; Zaragoza- Martin et al., 2007).
Another key consideration of this work, however, was to establish whether certain alternative supports would be capable of providing enhanced support corrosion benefits for both current and future applications. Since many existing large-scale MEA manufacturing processes are currently based on conventional catalysts, viable alternative carbons would need to produce electrocatalysts directly compatible with these processes to see rapid entry into current commercial pipelines.
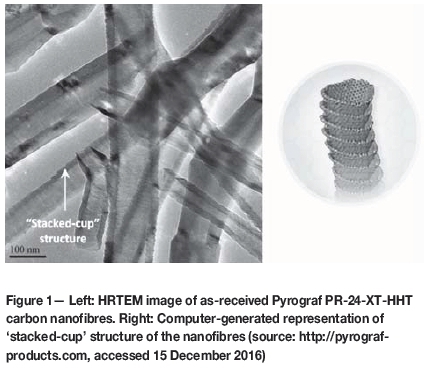
The alternative carbons examined were: a partially graphitised form of Vulcan XC72R (pG-Vulcan) produced by Cabot®; highly graphitised carbon nanofibres (CNFs) from Pyrograph® Products, Inc. (PR-24-XT-HHT); and a 3D network, hierarchical porous graphene-like material (HPG) obtained through international collaborations within the HySA/Catalysis programme.
Experimental
Catalyst preparation
Catalysts were prepared according to a proprietary synthesis technique developed within the HySA/Catalysis programme. In brief, the routine involved the precipitation of Pt complexes from an aqueous solution of Pt precursor, followed by deposition on to the carbon support material and in situ reduction with a suitable reducing agent. Syntheses in per batch quantities from 0.5 g to 1 kg per batch have been thoroughly investigated and shown to yield Pt/C materials supported on Vulcan XC72R and Ketjenblack EC-300J without any losses in performance throughout the scale-up procedure.
Ex-situ catalyst characterisation
X-ray Diffraction
XRD was used to characterise the crystallographic structure of selected catalyst samples. Co K radiation was used and scans were performed from 10° to 120° (2Θ) using a Bruker D8 Advance diffractometer. Average Pt crystallite sizes were calculated using the Scherrer equation applied to the Pt(220) diffraction peak (Venkateswara Rao and Viswanathan, 2010).
HRTEM
High-resolution TEM images, using a JEOL JEM-2100F instrument, were taken of selected catalyst samples to visualise metal dispersions, for validation of the Pt surface areas predicted by cyclic voltammetry and also the average crystallite sizes calculated from XRD.
BET surface area
BET surface area measurements were performed on the various support materials using a Micromeritics ASAP 2020. All samples were degassed at 350°C under vacuum for 4 hours prior to measurement.
Thin-film rotating disk electrode measurements
All TF-RDE measurements were performed in 0.1M HClO4 using a three-electrode cell. A saturated calomel electrode (SCE) served as reference and a Pt strip as counter-electrode. All reported potentials were referenced back to the relative hydrogen electrode (RHE). The working electrode was a 5 mm glassy carbon RDE and all measurements were carried out on an Autolab PGSTAT302N potentiostat.
Prior to the measurements, the glassy carbon electrodes were polished with 0.05 μm alumina on a Buehler Texmet® polishing pad. Catalyst inks were prepared by dispersing a calculated mass of catalyst in approximately. 15 mℓ of high-purity water by ultrasonication for 30 minutes. Catalyst was then deposited at a Pt loading density of 56 mg m2 after which 27.8 μL of a 0.2817 mg/mL Nafion® solution was micropipetted on top of the catalyst layer and dried in an oven at 120°C for 10 minutes.
Pt surface area measurements were performed in N2-purged, 0.1M HClO4, maintained at 25°C. The catalyst layers on the RDEs were first conditioned by cycling the potential between 0 and 1.2 VRHE at 50 mV/s for 15 cycles. Thereafter, three further cycles were measured at 20 mV/s and the hydrogen adsorption charge of the third cycle used to calculate the Pt surface area of the catalyst. In order to limit contributions from molecular hydrogen evolution, integration for the hydrogen adsorption charge was performed up until the potential of the current maximum following the Pt(111) adsorption peak in the cathodic sweep. A specific charge transfer value of 210 mC/cm2 Pt was assumed.
Kinetic ORR activity measurements were carried out in O2-saturated electrolyte at 60°C. The RDE was rotated at 1600 r/min and the potential was swept from 0 to 1.0 VRHE at 20 mV/s. Background correction to remove the capacitive currents not related to ORR was performed in N2-purged electrolyte at 60°C with zero rotation of the RDE. Mass transport limitations were removed using the Koutecky-Levich equation (Gasteiger et al., 2005) and a Tafel analysis performed on the kinetic data between 875 and 950 m VRHE.
Pt particle stability was assessed by cycling the potential between 0.6 and 1.0 VRHE for 7200 square-wave cycles, with Pt SA measured at 1200-cycle intervals. This was done in N2-purged 0.1M HClO4 at 60°C. Support corrosion resistance was evaluated by holding the potential on the RDE at 1.5 VRHE for 2 hours and then averaging the final 2 minutes of the measurement to obtain a measure of the support corrosion current. This was performed in N2-purged, 25°C HCIO4.
In situ evaluation
MEA fabrication
Catalyst-coated substrates (CCS) with active areas of 50 cm2 were fabricated by a procedure developed within HySA/Catalysis. Catalyst inks were prepared using a proprietary combination of solvents, catalyst and 15 wt% ionomer solution (IonPower™, LQ-1015). An I:C ratio of 0.75 was employed for both the anode and cathode catalyst layers. A Silverson® L5MA high-sheer mixer was used to homogenise the ink components before transfer to a USI® Prism 300 spray coater. Catalyst layers were then deposited onto Freudenberg H2315 I2C6 GDLs by ultrasonic spray coating and dried in an oven at 120°C for 30 minutes. Targeted electrode Pt loadings were 0.4/0.4 mg Pt/cm2 (anode/cathode). The resulting gas diffusion electrodes (GDEs) were hot-pressed onto opposite sides of Nafion® NRE211 membrane at a pressure of 10 MPa relative to active area, at 135°C for 3 minutes.
Testing protocols
Prior to evaluation, newly fabricated MEAs were subjected to a conditioning protocol in order to stabilize performance at the assembly's peak value. This involved cycling the potential on the MEA between 1.0 V (or open circuit) for 30 seconds and 0.3 V for 10 minutes. This was performed for a total of 12 cycles under the conditions summarised in Table I.
Following this, the MEA was assessed by a number of standard in situ testing protocols, the conditions for which are also contained in Table I.
Results and discussion
Ex-situ analysis
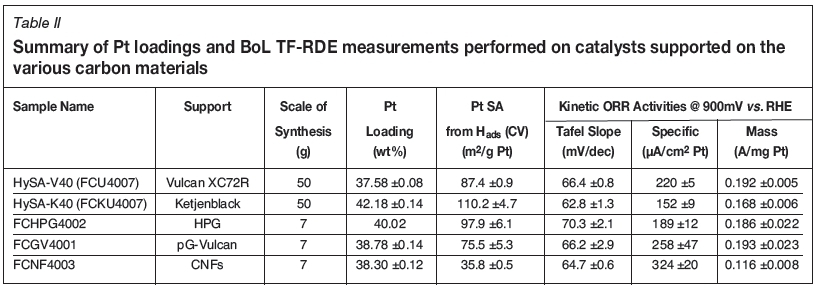
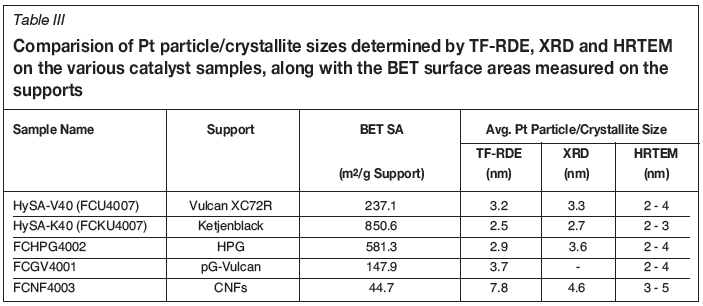
Figure 2 displays a comparison of the BoL thin-film RDE cyclic voltammograms measured on the catalysts synthesised with the various supports. Included are the CVs obtained on the conventional Pt(approx. 40 wt%)/Vulcan XC72R (HySA-V40) and Pt(approx. 40 wt%)/Ketjenblack EC-300J (HySA-K40) materials. Table II summarises the Pt loadings, BoL Pt surface areas and kinetic ORR activities measured on the various catalyst samples and Table III provides a comparison of the Pt particle sizes determined by TF-RDE, XRD and HRTEM. Also shown in Table III are the BET surface areas measured on the supports.
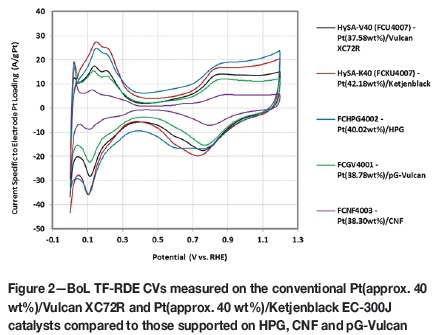
What is immediately apparent in Figure 2 is the extremely low initial metal area measured on the CNF-supported catalyst relative to the other Pt (approx. 40 wt%) materials. At just 35.8 m2/g Pt, this represents only 41% of the metal area obtained on the standard Vulcan-supported HySA-V40. The TF-RDE Pt surface area ranking on the catalysts, as well as the XRD Pt crystallite and HRTEM Pt particle sizes in general, followed the BET surface areas measured on the supports, with lower BET SAs yielding lower Pt SAs. This is unsurprising, as smaller support surface areas relate to a lower number of active sites on the support for metal deposition, leading to a lower Pt dispersions for a given synthesis procedure.
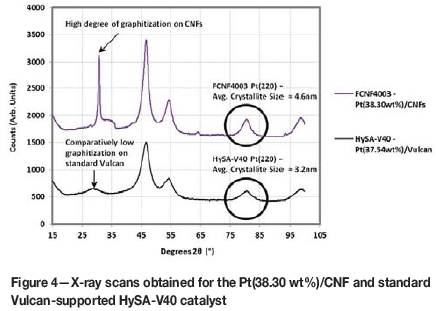
The average metal particle size calculated from the TF-RDE Pt SA on the Pt/CNF catalyst was 7.8 nm. HRTEM imaging of the catalyst, however, displayed a high dispersion of the Pt metal across the nanofibres with Pt particle sizes typically in the 3 to 5 nm range (Figure 3). In agreement with this is the average Pt(220) crystallite size estimated from XRD, which was 4.6 nm (Figure 4). The reason for the large disparity between these measurements on the CNF-supported catalyst could be the possibility of Pt particle growth inside the nanofibre tubes during synthesis, which may have been inaccessible to the electrolyte during RDE measurements.
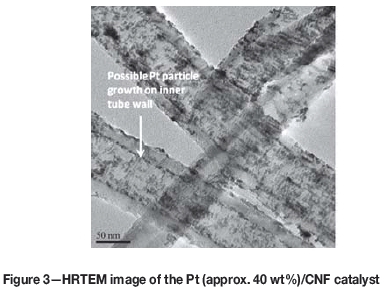
HRTEM images appear to confirm this, showing a clear line of Pt metal particles along the inner wall of the CNFs (Figure 3).
In terms of kinetic ORR activity measurements, specific activity was approximately 47% higher on the Pt(38.30 wt%)/CNF sample than the HySA-V40, but because of the very low Pt SA, mass activity was only 60% of the standard Vulcan-supported catalyst at 0.116 A/mg Pt.
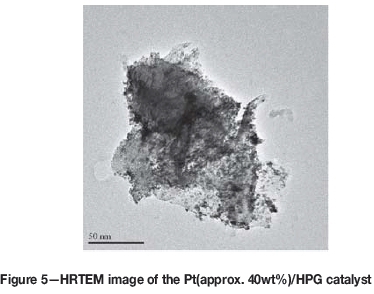
Moving on to the Pt(40.02wt%)/HPG catalyst, as can be seen in Table II, it possessed an initial Pt surface area between that of the HySA-V40 and HySA-K40 catalysts at 97.9 m2/g Pt. In agreement with this, HRTEM imaging of the catalyst indicated particles in the 2-4 nm range. Kinetic ORR mass activity was found to be essentially the same as the HySA-V40. BoL performance of the HPG supported catalyst therefore seemed very promising, matching that of the conventional catalysts.
The pG-Vulcan-supported catalyst showed a Pt surface area only marginally lower than the conventional HySA-V40. Kinetic ORR mass activity was also on par with the HySA-V40 with, however, a slightly higher specific activity at 900 m VRHE, attributed to the larger average Pt particle size on the pG-Vulcan-supported material. This was possibly due to the Pt particle size effect.
Being referred to here is the straightforward relationship between Pt particle size and ORR activity, where larger particles have been associated with higher specific activities and lower mass activities and smaller particles associated with smaller specific activities and higher mass activities (Gasteiger et al., 2005). The drop-off in mass activity with increasing Pt particle size has been found to increase somewhat only at values below approximately 60-70 m2/g Pt (Gasteiger et al, 2005). Thus with sample FCGV4001 possessing approximately 75.5 m2/g Pt, the impact on mass activity of its slightly larger particles on average than the HySA-V40 was perhaps not seen because of this phenomenon.
Looking now at durability testing, Figure 6 presents the Pt surface area decay profiles obtained from the thin-film RDE Pt stability ADT. As can be seen, with the exception of the HPG-supported catalyst, all the materials actually showed fairly similar degradation profiles, losing between 35 and 42% of their initial Pt surface area by the end of the test. The HPG-supported catalyst clearly showed the highest degradation, however, losing nearly 60% of its active area by the end of the ADT.
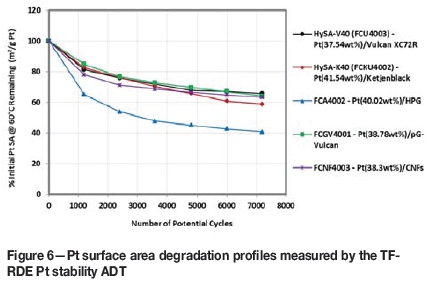
The CNF- and pG-Vulcan supported catalysts performed only as good as their standard Vulcan-and Ketjenblack-supported counterparts and so improved support durability would be the only potential advantage the alternative carbons could offer over the conventional carbon blacks.
Figure 7 displays the corrosion currents measured over the final 1200 seconds of the TF-RDE support corrosion resistance ADT. In terms of the alternative carbons, the HPG-supported catalyst showed the highest corrosion current, which was in fact 10% higher than the Pt(approx. 40 wt%)/Ketjenblack material. Showing both lower Pt particle stability and support corrosion resistance, the HPG material did not appear to have any improved durability over the conventional carbon blacks and therefore would likely not provide any significant advantage over these materials.
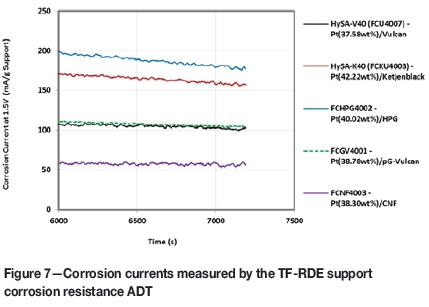
The partially graphitised Vulcan-supported catalyst, rather surprisingly, showed essentially the same average corrosion current as the HySA-V40. It was anticipated that the graphitisation imparted into the material, however small, would at least provide a noticeable enhancement in support corrosion resistance. With respect to the TF-RDE BoL and ADT measurements, therefore, the pG-Vulcan material was almost indistinguishable from standard Vulcan, except in terms of BoL Pt SA, for which it showed a 14% reduction. It was thus expected that it would show no appreciable advantage over the HySA-V40 in a fuel cell environment either and with the material costing more than standard Vulcan, it would in fact be less attractive as a fuel cell catalyst support.
In situ analysis and Pt(approx. 20 wt%)/CNF catalyst
The CNF-supported catalyst was the only material to show any improvement in support corrosion resistance over the conventional carbon blacks. The improvement was in fact fairly substantial, with the two-minute average corrosion current approximately 36 and 63% lower than the HySA-V40 and HySA-K40 catalysts, respectively. Unfortunately, this improved support corrosion resistance came at the cost of a large reduction in BoL Pt dispersion and kinetic ORR activity.
In view of these results, it was decided to investigate lowering the Pt loading on the CNF supported catalyst to 2 0wt%. Table IV summarises a comparison between the BoL TF-RDE measurements performed on the 20 and 40 wt% Pt/CNF catalysts, as well as the HySA-V20 and V40 materials.
As can be seen, the 20 wt% Pt/CNF catalyst did indeed show an increase in Pt SA by approximately 60% over the 40 wt% material, achieving just under 60 m2/g Pt versus the 35.8 m2/g Pt of sample FCNF4003. Rather surprisingly, kinetic ORR mass activity was actually somewhat lower, at around 0.095 A/g Pt, compared to 0.115 A/gPt for the 40 wt% catalyst. A near 50% reduction in specific activity appeared to be the cause for this and thus a phenomenon besides the Pt particle size effect was likely at play.
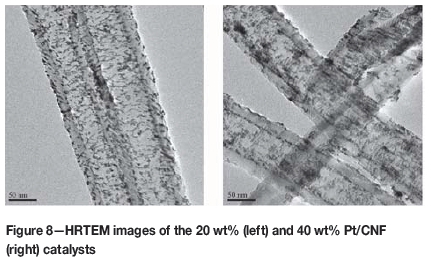
As can be seen in the HRTEM images of Figure 8, there appeared yet again to be a significant deposition of Pt particles on the inner nanofibre walls of the Pt(approx. 20 wt%)/CNF catalyst. A possibility therefore exists that a larger fraction of the total metal may have been inactive on the 20 wt% catalyst than the 40 wt%, resulting in the apparent lower mass activity measured on the material.
Shown in Figure 9 is a comparison of the H2/air polarisation curves measured on the Pt/CNF- and HySA-K40-based MEAs. Immediately apparent is the drastically lower performance of the CNF-supported catalysts compared to the benchmark HySA-K40 catalyst across the entire range of current densities measured. At 0.6 V, both the 20 and 40 wt% Pt/CNF materials displayed current densities less than half that of the HySA-K40, achieving approximately 570 mA/cm2versus 1188 mA/cm2 on the conventional catalyst. A number of possible causes for this are evident in Table V, where, in particular, the in situ kinetic ORR mass activities measured on samples FCNF2001 and FCNF4003 were only 13 and 16% of the value obtained on the HySA- K40.
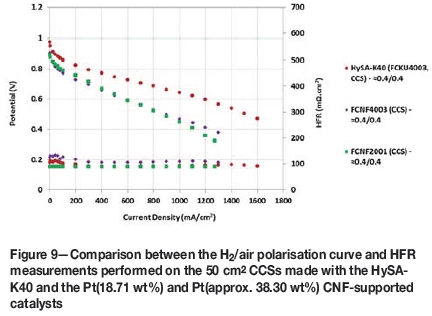
What can also be seen is that the slope in the ohmic region of the polarisation curves for the CNF-based MEAs was higher than for the HySA-K40. Since the HFR values were similar for the MEAs across the range of current densities, it is likely that increased mass transport resistance in the Pt/CNF based layers was the cause for this, having a greater effect on polarisation performance at lower current densities than in the conventional catalyst.
Validation for the increased mass transport resistance is provided by a comparison between the maximum current densities produced - the Pt/CNFs only achieving 1300 mA/cm2vs. 1600mA/cm2 for the HySA-K40. A reason for this could have been that the catalyst layer structure produced by the nanofibres had a smaller porosity than the Ketjenblack catalyst, increasing the resistance to diffusion of the reagent gases to the active sites and leading to a lower overall three-phase interfacial area. The bulk density of the CNF material was also noted as being exceptionally lower than that of Ketjenblack and it is therefore likely that the electrode catalyst layers were also appreciably thicker, resulting in poorer gas transport through the layers.
Also apparent was a lower OCV on the Pt/CNF CCSs. Although the exact reason for this is unclear, it may have simply been related to the poorer ORR kinetics on the Pt/CNF cathode catalyst layers. In line with the poorer ORR kinetics was the charge transfer resistance at 100 mA/cm2, which was also higher on the CNF-based MEAs and cathodic EPSAs were 31 and 65% below that of the HySA-K40 for the 20 and 40 wt% CNF catalysts, respectively.
Conclusions
Several alternative carbon materials were investigated in this work for their viability as replacement supports with improved durability over the conventional Vulcan XC72R and Ketjenblack EC-300J materials. BoL thin-film RDE measurements on samples synthesised at the 40 wt% Pt loading revealed that the HPG and pG-Vulcan catalysts had similar kinetic ORR mass activity at 900 mVRHE as the benchmark conventional catalysts. The Pt(approx. 40 wt%)/CNF catalyst, however, presented only 41% and 60% respectively of the Pt SA and kinetic ORR activity of the Pt(approx. 40 wt%)/Vulcan material.
TF-RDE support corrosion resistance testing indicated that the HPG-supported catalyst had a corrosion current higher than both the V40 and K40 catalysts. Pt stability was also drastically lower, ruling out the material as a valuable, more durable replacement for the conventional carbon blacks. The pG-Vulcan catalyst presented essentially the same corrosion current as the V40; however, the CNF support showed a substantial decrease over the conventional materials, with a corrosion current approximately 63% below the HySA-K40.
To address the extremely poor BoL performance, the Pt loading on the CNF supported catalyst was reduced from 40 to 20 wt%. This, as expected, resulted in an increase in BoL Pt SA by nearly 60%, but with no corresponding improvement in kinetic ORR mass activity. This was proposed to be the result of Pt particles being deposited on the inner tube walls of the CNF material, with a larger fraction of the total Pt metal occurring on the inner walls of the Pt(20 wt%)/CNF sample.
In situ H2/air polarisation curve performance was appreciably lower on both the 20 and 40 wt% Pt/CNF catalysts compared to the HySA-K40. The most significant reasons for this appeared to be in situ kinetic ORR mass activity, which was less than 20% of the value measured on the Ketjenblack-supported catalyst, as well as suspected higher mass transport resistance
The CNF catalysts did, however, produce functional electro-catalyst layers showing modest performance without any modification of the MEA manufacturing procedure developed specifically for conventional Vulcan- and Ketjenblack-supported catalysts. There does therefore appear to be some promise for the CNFs in being able to produce electrocatalysts that could function as drop-in replacements for the conventional catalysts. In doing so, they could benefit not only future applications, but current applications as well.
A deeper consideration of the surface properties of the supports and resulting catalysts (microscopic and macroscopic structures, effects on the interparticle distance between the Pt particles of the catalysts, etc.) may also help in further elucidating the various phenomena observed in terms of both the ex-situ and in situ measurement of the various supports. This was beyond the scope of this work, but may be addressed in a follow-up at a later stage.
Acknowledgements
The authors would like to thank the South African Department of Science and Technology (DST) for funding this research through the HySA/Catalysis programme. We would also like to thank Professor Pei Kang Shen from the Advanced Energy Materials Laboratory at the Sun Yat-Sen University of China for providing the hierarchical porous graphene sample material.
References
Carter, R..N., Kocha, S.S., Wagner, F.T., Fay, M. and Gasteiger, H.A. 2007. Artefacts in measuring electrode catalyst area of fuel cells through cyclic voltammetry. ECS Transactions, vol. 11, no. 1. pp. 403-410. [ Links ]
Gasteiger, H.A, Vielstich, W. and Lamm, A. 2003. Handbook of Fuel Cells - Volume 3: Fuel Cell Technology and Applications. Wiley, Chichester, UK. [ Links ]
Gasteiger, H.A., Kocha, S.S., Sompalli, B. and Wagner, F.T. 2005. Activity benchmarks and requirements for Pt, Pt-alloy and non-Pt oxygen reduction catalysts for PEMFCs. Applied Catalysis B: Environmental, vol. 56, no. 1-2. pp. 9-35. [ Links ]
Guha, A., Zawodzinski, T.A. and Schiraldi, D.A. 2008. Influence of carbon support microstructure on the polarization behavior of a polymer electrolyte membrane fuel cell membrane electrode assemblies. Journal of Power Sources, vol. 195, no. 16. pp. 5167-5175. [ Links ]
Lee, K., Zhang, J., Wang, H. and Wilkinson, D.P. 2006. Progress in the synthesis of carbon nanotube- and nanofiber-supported Pt electrocatalysts for PEM fuel cell catalysis. Journal of Applied Electrochemistry, 36 (5), pp. 507-522. [ Links ]
Li, Y., Lí, Z. and Shen, P. 2013. Simultaneous formation of ultrahigh surface area and three-dimensional hierarchical porous graphene-like networks for fast and highly stable supercapacitors. Advanced Materials, vol. 25 no. 17. pp. 2474-2480. [ Links ]
Rabis, A., Rodriguez, P. and Schmidt, T. 2012. Electrocatalysis for polymer electrolyte fuel cells: recent achievements and future challenges. ACS Catalysis, vol. 2, no. 5. pp. 864-890. [ Links ]
Schulenburg, A., Schwanitz, B., Linse, N., Scherer, G.G., Wokaun, A. and Krbanjevic, J. 2011. Quantification of platinum deposition in polymer electrolyte fuel cell membranes. Electrochemistry Communications, vol. 13 no. 9. pp. 921-923. [ Links ]
US Department of Energy. 2013. Fuel cell technical team roadmap. http://energy.gov/sites/prod/files/2014/02/f8/fctt_roadmap_june2013.pdf [accessed 15 December 2016]. [ Links ]
Venkateswara Rao, C. and Viswanathan, B. 2010. Monodispersed platinum nanoparticle supported carbon electrodes for hydrogen oxidation and oxygen reduction in proton exchange membrane fuel cells. Journal of Physical Chemistry C, vol. 114, no. 18. pp. 8661-8667. [ Links ]
Yu, P.T., Gu, W., Makharia, R., Wagner, F.T. and Gasteiger, H.A. 2006. The impact of carbon stability on PEM fuel cell startup and shutdown voltage degradation. ECS Transactions, vol 3, no. 1. pp. 797-809. [ Links ]
Zaragoza-Martin, F., Sopena-Escario, D., Morallön, E. and Salinas-MartInez de Lecea, C. 2007. Pt/Carbon nanofibers electrocatalysts for fuel cells: effect of the support oxidizing treatment. Journal of Power Sources, vol. 171, no. 2. pp. 302-309. [ Links ]
Zhang, J. 2008. PEM Fuel Cell Electrocatalysts and Catalyst Layers, Springer- Verlag, London, UK. [ Links ] ♦
This paper was first presented at the AMI Precious Metals 2017 Conference 'The Precious Metals Development Network' 17-20 October 2017, Protea Hotel Ranch Resort, Polokwane, South Africa.

