


Services on Demand
Article
 English (pdf)
 Article in xml format
 Article references
Indicators

Related links
-
 Cited by Google
 -
 Similars in Google
Share

 Permalink
Journal of the Southern African Institute of Mining and Metallurgy
On-line version ISSN 2411-9717
Print version ISSN 2225-6253
J. S. Afr. Inst. Min. Metall. vol.117 n.10 Johannesburg Oct. 2017
http://dx.doi.org/10.17159/2411-9717/2017/v117n10a4
CONFERENCE PAPERS
Microstructural characterization of laser beam and gas tungsten arc welded zirconium-2.5Nb
S.S. Mahlalela; P.G.H. Pistorius
SAIW Centre for Welding Engineering, Department of Material Science and Metallurgical Engineering, University of Pretoria, South Africa
SYNOPSIS
The current study is intended to characterise the complex microstructure that results from autogenous welding of Zr-2.5Nb and its influence on mechanical properties. Laser beam welding (LBW) and gas tungsten arc welding (GTAW) were performed on a 1.5 mm thick samples by applying different combinations of speed and power to vary the heat input. The effect of cooling rate on ß-a phase transformation temperature and the resulting microstructure was investigated using a Bahr dilatometer. In addition, mechanical properties were determined by tensile and hardness testing. The base metal microstructure consisted of a fine structure of Zr-alpha with a small fraction of Nb-beta phase. Both LBW- and GTAW-welded joints displayed similar martensitic microstructures, with the main difference being the weld geometry and strength.
Keywords: Zr-2.5Nb, autogenous welding, microstructure, ß-a transformation.
Introduction
Zirconium is used to manufacture nuclear plant components, more specifically the pressure tube containing the UO2 fuel rods. The use of zirconium and its alloys in the nuclear industry is credited to Admiral Rickover of the US Navy, who oversaw the development of the Shippingport Atomic Power Station in Pennsylvania (Krishnan and Asundi, 1980). This was the world's first commercial pressurized water reactor (PWR) used for generating electricity. Zirconium alloys are preferred because of their low neutron absorption cross-section, good resistance to corrosion, high strength and good creep resistance (Douglass, 1971). The desire by the nuclear industry to prolong the service life of cladding tubes while improving power output by increasing the operation temperatures led to the development of zirconium-niobium alloy. This alloy was first used in the USSR, due to its superior properties compared to other popular alloys like Zr-Sn (Cox, 2004). Currently these pressure tubes operate at about 300°C with a coolant pressure of about 10 MPa in pressurized heavy water reactors. The pressure tubes are extruded at around 820 to 850°C, cold worked 20 to 30% and stress relieved (autoclaved) at 400°C. The autoclaving treatment at 400°C and the reactor operation temperatures of 300°C eventually leads to a microstructure of elongated grains with equilibrium phases (αZr and ßNb)
Zirconium-2.5Nb exhibits two equilibrium phases, namely alpha (αZr) phase with hexagonal close-packed (hcp) crystal structure at room temperature and beta (αZr) phase with body-centred cubic (bcc) structure at temperatures above about 870°C (Banerjee and Mukhopadhyay, 2010). In the equilibrium phase diagram, the single-phase a and singlephase ß regions are separated by a two-phase region of (αZr+ßZr) between 602-871°C. Alloying elements have an effect on the alpha to beta transformation temperature (Lustman and Kerze, 1955). Beta-stabilising elements (such as Sn and Nb) lower this temperature, thereby stabilising the αZr phase. Alpha-stabilising elements (such as H, N and O) raise the alpha to beta transformation temperature, stabilising the ßZr phase. Niobium is a ßZr phase stabiliser, but conventional Zr-Nb alloys contain some oxygen, which is an αZr-phase stabiliser.
The phase transformation of beta to alpha during thermal treatment of Zr-2.5Nb alloy results in mainly two microstructural morphologies, namely Widmanstätten and martensitic structures. A Widmanstätten structure can further manifest itself in two morphologies, called parallel plates and basketweave (Holt, 1969). The parallel plate structure consists of a number of long αZr plates that precipitate and grow on the same habit plane from the grain boundary in one parent ß grain. Basketweave structure, in contrast, is composed of relatively short Zr plates that randomly precipitate on a number of planes within the same parent ß grain. The latter structure is promoted by an increase in cooling rate and the presence of randomly dispersed second-phase particles in the parent ß phase. There are non-equilibrium phases such as the martensite (oc') phase (hcp and orthorhombic), the cu- phase and a large number of metastable intermetallic phases. The retention of a metastable Zr-rich ß-phase during fast cooling has also been found in the binary Zr-2.5Nb system (Banerjee and Mukhopadhyay, 2010). Zirconium-niobium alloys mainly show martensite with an acicular morphology (Srivastava et al., 2000). This is characterised by a structure consisting of primary martensite plates cutting across the parent ß grain. Secondary plates subsequently transform from the primary plates in different variants of orientation relation (Banerjee and Mukhopadhyay, 2010).
The deformation mechanism of zirconium alloys (hcp crystal structure) is through both the slip system and the deformation twin system. This complex behaviour is due to the less ideal axial ratio (c/a) of the alpha phase (Cochrane, 2013). A number of factors determine which system is activated first and these include microstructure, texture, deformation temperature, strain mode and strain rate. At intermediate temperatures (RT), transition in the ratecontrolling deformation mode from slip to twinning has been observed to occur during the course of plastic deformation (Song and Gray, 1995). Reducing grain size has been shown to inhibit twinning deformation mode, while increasing strain rate promotes it.
Welding of the pressure tubes is one of the critical steps during the manufacturing process. Zr-2.5Nb has shown good weldability but its susceptibility to hydrogen, nitrogen, oxygen and carbon contamination requires serious consideration, especially at temperatures above 370°C (Krueger, 2015). This is the reason why argon and helium are the only shielding gases recommended and thorough cleaning of the workpiece before welding is essential. Contamination causes embrittlement, which results in increase in hardness but loss of ductility. Adequately shielded welds should show bright silver weld beads. When contaminated, zirconium welds show a range of discolouration from dark straw to blue for light contamination to dark blue or grey for severe contamination (Krueger, 2015).
In this study, autogenous welding was done where no filler metal is added and the fusion zone is formed by the melting and resolidification of the base metal. Laser beam welding (LBW) and gas tungsten arc welding (GTAW) were used. Laser beam welding allows precision, high-quality weld joints to be produced with a low heat input (HI). This results in a small heat-affected zone (HAZ), fast cooling rate with very little distortion and a high depth-to-width ratio. GTAW produces acceptable quality with wider welds due to an inherently higher heat input. The microstructural change that occurs due to thermal treatment can have a negative bearing on the performance of zirconium alloys (Rudling, 2007). The aim of this study is to characterise the complex microstructure that results from autogenous welding and compare the results of the two welding processes. In addition, tensile and micro-Vickers hardness tests were done to quantify the mechanical behaviour of the various weld beads.
Experimental procedure
Base metal
Zr705 alloy sheet of 1.5 mm thickness supplied by ATI Specialty Alloys & Components was used for all experiments. The chemical composition of the alloy as provided by the supplier is shown in Table I. The sheet was sectioned into 100x50 mm rectangular samples for autogenous bead on plate welding. The samples were cleaned with ethanol before welding to limit contamination
Laser beam welding
An IPG YLR fibre laser was used with maximum power output of 3 kW, an emission wavelength of 1.07 urn and a spot focus diameter of 250 um with a focal length of 200 mm. The welding head was mounted on an articulated robotic arm. The samples were assembled on a welding table with a root purge incorporated. Helium was used for root purging and shielding while a trailing weld shoe using argon was utilised for the top side of the weld bead. Visually, most welds were free of colouration, which suggests adequate shielding, except for two high heat input welds which were dark straw to light blue. These colours indicate surface oxidation, which can be removed using a wire brush. Table II shows the laser beam welding parameters that were chosen to ensure full penetration on both processes. The heat input, which is critical in determining the cooling rate, was calculated using Equation [1] (Weman, 2003).
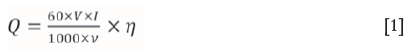
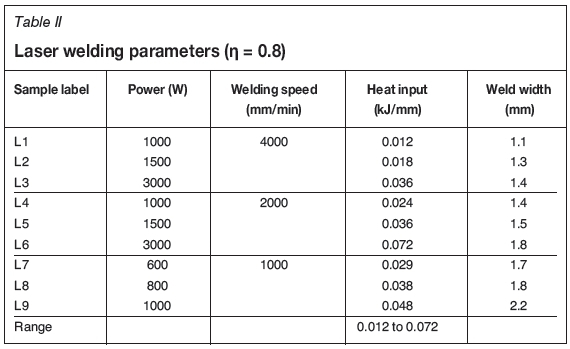
where Q is heat input (kJ/mm), V is voltage (V), I is current (A), v is welding speed (mm/min) and n is arc efficiency or power transfer efficiency. For laser beam welding, the arc efficiency was taken to be n = 0.8 (Fuerschbach, 1996). The reported weld widths in Table II were the average width of the top and the root of the fusion zone.
Gas tungsten arc welding
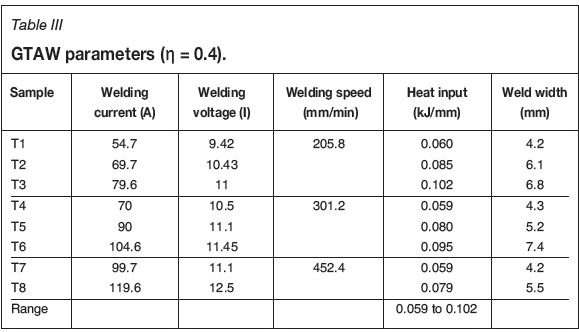
DCEN polarity was used with an EWTh 2.4 mm diameter electrode on the semi-automated GTAW machine. The electrode tip was ground to a 45° angle and arc length of 2 mm. The welding arc was initiated through the touch-start procedure. Argon was used for purging and shielding through the backing plate, torch nozzle and trailing weld shoe. No discolouration was observed on the welds visually, which suggested adequate shielding. Table III shows the gas tungsten arc welding parameters. The heat input was calculated as noted for laser beam welding, except that the arc efficiency was taken as n=0.4 (Smartt, Stewart and Einerson, 1985).
Dilatometry
Continuous cooling transformation behaviour was studied using varying thermal cycles in the dilatometer. A Bahr dilatometer was used with helium gas for better cooling control. An S-type thermocouple was spot-welded on the samples. The samples were heated at a constant rate of 10°C/s to a peak temperature of 1050°C and held for 10 minutes before cooling at different rates of 0.5, 1, 10, 25, 50, 150, 300 and 600°C/s. The data obtained was used to plot the continuous cooling curves and temperature transformation and time diagram. Dilatometry samples were subjected to metallography and hardness testing.
Metallography
Samples were prepared for microstructure examination by first grinding with SiC paper to 1200 grit. Chemical polishing, which simultaneously remove scratches and etches, was then performed using 10HF-45HNO3-45H2O2 (vol.%) solution. The microstructure was characterised using stereoscopic, optical and scanning electron microscopy (SEM).
Mechanical testing
Hardness testing was performed using a micro-Vickers machine with a load of 500 g force and dwell time of 10 seconds. The welded samples were tested on the transverse section (top welded side) across the whole profile from base metal, heat affected zone, to the weld with the indents 0.5 mm apart. Five measurements were done on the dilatometry and as-received samples.
To evaluate and compare the mechanical properties of the welds, sub-size tensile samples with 25 mm gauge length and 6 mm width were prepared according to ASTM E8/E8M.
The samples were machined parallel to the weld line. Conventionally, the tensile properties of a welded joint characterised using a tensile test coupon that is machined transverse to the weld (AWS B4). It will be shown later that the hardness of the weld metal and of the heat affected zone was higher than the hardness of the base metal. A transverse tensile test coupon would therefore have failed in the unaffected base metal and the tensile behaviour of the weld metal would not have been characterised. Given the coupon width (6 mm) and the width of the weld bead (Tables II and III), the tensile test results therefore reflect the combined mechanical behaviour of the weld metal and the heat affected zone. The samples were deformed with a constant cross-head speed of 2 mm/min and all tests were carried out at room temperature. Five samples were tested in total, including two samples of laser beam welds, two of GTAW welds and one of as-received sheet. The welding of all tensile samples was performed to ensure heat input between 0.065-0.070 kJ/mm.
Results and discussion
Dilatometry
Microstructural examination of the dilatometry samples cooled at a rate below 50°C/s showed mainly a basketweave structure in the interior of the parent beta grain with a parallel alpha plate structure on the grain boundary. These parallel plates nucleate from the grain boundary and grow into the prior beta grain. The beta (ßNb) niobium phase is observed mainly on the grain boundary. Figures 1a and 1b shows the microstructure at 1°C/s cooling rate. As the cooling rate increases, intragranular alpha plates nucleate from the interior of the beta grain and become progressively finer in size. At high cooling rates (> 50°C/s) a martensitic reaction occur which results in acicular (oc') plates forming. The change in microstructure with increasing cooling rate is shown in Figure 2.
The temperature-time transformation curves during cooling are shown in Figure 3. The highest transformation temperature of ßa( αZr+ ßzr) is 856°C at 0.5°C/s cooling rate. The transformation start temperature was measured as 775°C where (ßaa') bcc beta transforms to hcp alpha martensite at 50°C/s. The (ßaa') transformation start temperature decreased to 650°C at 600°C/s cooling rate. At higher cooling rates, the transformation start and transformation end temperatures generally decreased, consistent with a previously published continuous cooling transformation diagram (Saibaba, 2012). The current study showed that, at a cooling rate of below 50 C/s, the transformation product was a mixture of basketweave, parallel plate and beta niobium (Figure 1 and Figure 2). At a cooling rate higher than 50°C/s, martensitic phase was the dominant transformation product (see, for example, Figure 2). The change in transformation product was not associated with an abrupt change in transformation start or transformation end temperatures (Figure 3). The reason for the gradual and consistent change in transformation temperatures, while the transformation products changed markedly, is not clear.
Welding metal geometry and structure
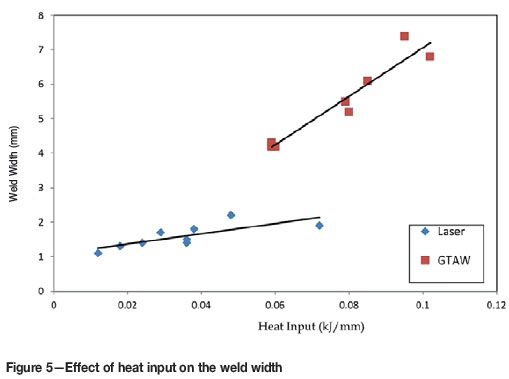
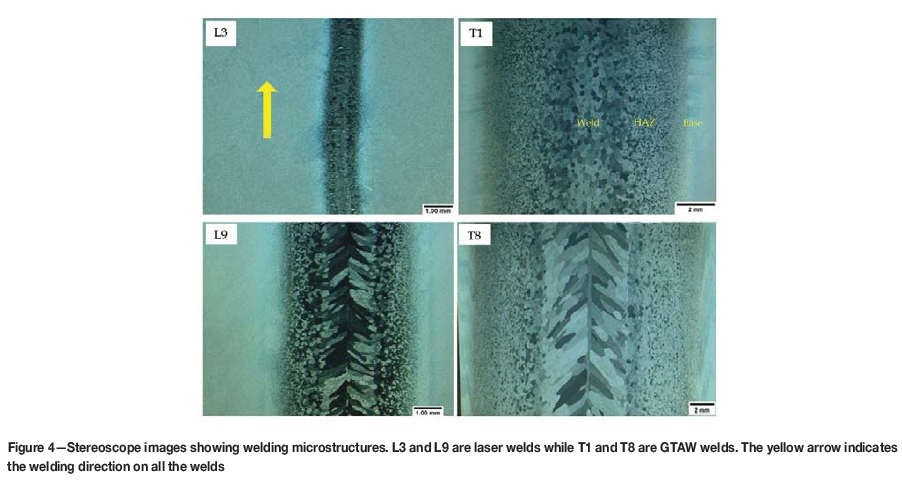
Both laser and GTAW processes display similar weld microstructure constituents and characteristics, as shown in Figure 4 (the L9 microstructure shows an uneven weld surface due to unintended over-etching). The main difference is the much larger width size of GTAW welds and HAZ as compared to those of laser welds (take note of the varying magnification used between the microstructures). The difference in weld bead size and morphology between L3 and L9 is mainly attributed to the varying heat input from 0.012 to 0.072 kJ/mm. Similarly, the width of the GTAW welds increased with heat input (Figure 5). The base metal microstructure was a fine cold-worked structure of alpha (αZr) phase with very small volume fraction of ßNb phase. The heat affected zone has recrystallised fine equiaxed grains of alpha with beta phases on the grain boundaries. The grain size increases toward the fusion line due to grain growth. The weld microstructure is dependent on the heat input and welding speed, but dominated by ß grains that have transformed to martensite. At low heat input the microstructure is characterised by equiaxed grains. As the heat input increases, the structure initially consists of large equiaxed grains and the morphology changes to columnar grains towards the centre. In GTAW welds with high heat input, the weld grains are mainly large and columnar due to the slow welding speed.
Mechanical properties
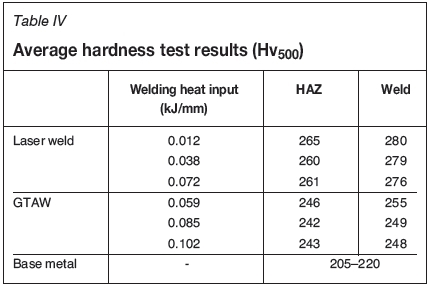
Hardness values for dilatometry at slow cooling rate averaged 210 Hv500 (mixture of basketweave and parallel plate structure) and increase steadily to 242 Hv500 at 25°C/s (fine basketweave microstructure). The hardness of martensitic structure ranged between 270 and 280 Hv500 for cooling rates of 50°C/s and above. Hardness and cooling rate have a positive linear relationship until the martensitic transformation, as seen in Figure 6.
Laser welds have superior strength to GTAW welds, as shown by the hardness results in Table IV, where the results for three welds of each welding process are presented. These were chosen from the low, medium and high heat input welds. The laser weld and HAZ hardness are 20-25 Hv500 higher than for GTAW.
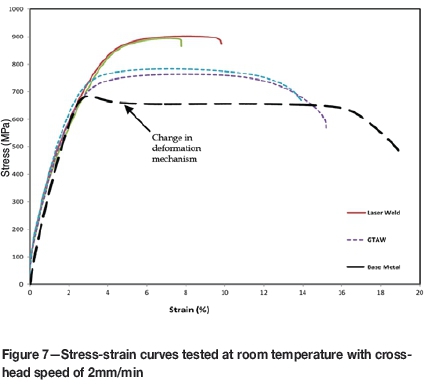
The tensile curves in Figure 7 are typical in zirconium deformation at RT, where initially yielding is smooth and the flow curve gradually plateaus, leading to a point in which the rate of dynamic recovery is equal to the hardening rate. As explained in the introduction, deformation in hcp zirconium alloys is accommodated by the activation of either the slip or twinning systems. At room temperature, zirconium initially deforms dominantly through slip until a transition (critical) point is reached, where the onset of uniform twinning deformation occurs. The transition point can be clearly seen in the 'no weld' curve. After the onset of plastic deformation, some strain softening occurred (at an engineering strain of about 3.5%), followed by a constant flow stress (up to a strain of about 15%). The laser beam welds had a higher strength, due to the faster cooling rate and a much finer martensitic structure. The weld metal tensile strength exceeded the strength of the base metal (Figure 7) and exceeded the minimum tensile strength for this alloy in the annealed condition (450 MPa, ASTM B352).
Conclusions
► The microstructure morphology responded to heat input. Equiaxed grains of martensite were observed at low heat input, but columnar grains that grew in size developed as heat input increased
► There was good agreement between dilatometry and the weld microstructure constituents and strength results. Increased heat input resulted in a slower cooling rate and consequently a decrease in tensile strength and hardness. The weld microstructures also behaved in a similar way to the dilatometry microstructural response to change in cooling rate
► Laser beam welding results in stronger welds due to the fast welding speed and lower heat inputs. Finer martensite from laser welds imparts higher strengths but reduced ductility
► For nuclear application, laser beam welding would be more desirable because of the high welding speed, smaller weld bead size and higher strength.
Acknowledgements
The CSIR is acknowledged, especially Mr Herman Burger for his assistance and advice on laser beam welding. NECSA and AMI are thanked for their continued support.
References
Banerjee, S. and Mukhopadhyay, P. 2010. Phase Transformations: Examples from Titanium and Zirconium, vol. 12. Chapter 1. Elsevier. [ Links ]
Cochrane, C.J. 2013. Effect of process parameters on deformation of Zr- 2.5wt%oNballoy. Masters thesis, Queen's University, Canada [ Links ]
Cox, B. 2004. Development of Zr-Nb alloys. ZIRAT-9 Special Topic Report on Corrosion of Zr-Nb Alloys. Advanced Nuclear Technology International, Sweden. [ Links ]
Douglass, D.L. 1971. The metallurgy of zirconium. Atomic Energy Review Supplement. [ Links ]
Fuerschbach, P.W. 1996. Measurement and prediction of energy transfer efficiency in laser beam welding. Welding Journal, vol. 75. pp. 24-34. [ Links ]
Holt, R.A. 1969. The beta to alpha to phase transformation in Zircaloy-4. Journal of Nuclear Materials, vol. 3. pp. 322-334. [ Links ]
Krishnan, R. and Asundi, M.K. 1981. Zirconium alloy in nuclear industry. Proceedings of the Indian Academy of Sciences Section C: Engineering Sciences, vol. 4, no. 1. pp. 41-56. [ Links ]
Krueger, B.R. 2015. Reactive refractory and precious metals and alloys. Welding Handbook. American Welding Society. Chapter 7, pp. 449-482. [ Links ]
Lancaster, J.F. 1993. Metallurgy of Welding. 5th edn. Chapman & Hall. [ Links ]
Lustman, B. and Kerze, F. 1955. The Metallurgy of Zirconium, McGraw-Hill, New York. [ Links ]
Oslon, D.L. (ed.). 1993. ASM handbook: welding, brazing and soldering, vol. 6. ASM International, West Conshohocken, PA. [ Links ]
Rudling, P., Strasser, A. and Garzarolli, F. 2007. Welding of zirconium alloys. Special report, Advanced Nuclear Technology International. [ Links ]
Saibaba, N., Jha, S., Tonpe, S., Vaibhaw, K., Deshmukh, V., Rao, S.R., Krishna, K.M., Neogy, S., Srivastava, D., Dey, G. and Kulkarni, R. 2012. Microstructural studies of heat treated Zr-2.5 Nb alloy for pressure tube applications. Zirconium in the Nuclear Industry: Proceedings of the 16th International Symposium. ASTM International, West Conshohocken, PA. [ Links ]
Smartt, H.B., Stewart, J.A. and Einerson, C.J. 1985. Heat transfer in gas tungsten arc welding. Proceedings of the ASM International Welding Congress, Canada. ASM International, West Conshohocken, PA. [ Links ]
Song, S.G. and Gray, G.T. 1995. Influence of temperature and strain rate on slip and twinning behaviour of Zr. Metallurgical and Materials Transactions, 26A. pp. 2665-2675. [ Links ]
Srivastava, D., Mukhopadhyay, P., Banerjee, S. and Ranganathan, S. 2000. Morphology and substructure of lath martensite in dilute Zr-Nb alloys, Materials Science and Engineering, vol. A288. pp. 101-110. [ Links ]
Weman, K. 2003. Welding Processes Handbook. Woodhead Publishing, UK. [ Links ]
Williams, C.D. and Gilbert, R.W. 1966. Tempered structures of a Zr-2.5 wt %Nb alloy. Journal of Nuclear Materials, vol. 18. pp.161-166. [ Links ] ♦
This paper was first presented at the AMI Precious Metals 2017 Conference 'The Precious Metals Development Network' 17-20 October 2017, Protea Hotel Ranch Resort, Polokwane, South Africa.

