


Services on Demand
Article
 English (pdf)
 Article in xml format
 Article references
Indicators

Related links
-
 Cited by Google
 -
 Similars in Google
Share

 Permalink
Journal of the Southern African Institute of Mining and Metallurgy
On-line version ISSN 2411-9717
Print version ISSN 2225-6253
J. S. Afr. Inst. Min. Metall. vol.117 n.7 Johannesburg Jul. 2017
http://dx.doi.org/10.17159/2411-9717/2017/v117n7a9
PAPERS OF GENERAL INTEREST
A analytical model for cover stress re-establishment in the goaf after longwall caving mining
W. Wang; T. Jiang*; Z. Wang; M. Ren
North China University of Water Resources and Electric Powetr, Zhengzhou, China
SYNOPSIS
Cover stress re-establishment has a significant influence on the deformation and development of permeability in the fractured rock mass, which control the surface subsidence and water inflow after longwall caving mining. This paper reviews previous studies on cover stress re-establishment in the goaf after coal mining, and proposes a new analytical model based on the stress-strain characteristics of the caved rock mass and the voussoir beam theory. A scale model test is also conducted to study the cover stress re-establishment based on a coal mining case. A function was derived for cover stress re-establishment in the goaf, which can be approximately described as a logarithmic function and which agreed well with two completely re-established monitoring sites from the scale model test. The scale model test also indicated that cover stress reestablishment presents a hysteresis phenomenon. A 'stress balance' model was built for calculating the distance of cover stress re-establishment in the goaf, and the result from the model was lower than the results from the previous two methods. The cover stress re-establishment function and the 'stress balance' model will be of great significance for a better understanding of the stress distribution in the goaf.
Keywords: longwall mining, goaf, caving, fracturing, cover stress re-establishment, calculation model.
Introduction
The excavation of an underground coal seam by longwall caving or longwall top caving coal mining (LTCC) causes strata movement and fracture, and forms caving, fractured, and continuous deformation zones (Peng and Chiang,1984; Sui et al., 2015). The voids and fractures in the caved and fractured rock mass provide seepage channels for water and coalbed gas. Cover stress re-establishment has a significant influence on the deformation and development of permeability in the fractured rock mass, which control the surface subsidence and minewater inflow after longwall caving mining. The groundwater level always subsides due to the fractures that develop after coal mining; however, stress reestablishment in the cover can reduce the size of the fractures, which reduces the flow rate and helps the groundwater level to recover (Zhang et al., 2010; Wang et al., 2016). The stress increment distribution on pillars, which is also affected by the destressed zone distribution in the goaf, is also the primary factor for coal pillar design. Thus, an understanding of the cover stress reestablishment characteristics in the goaf is required.
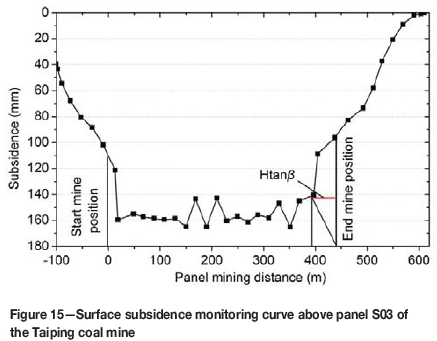
The original stress equilibrium conditions in the rock strata are disturbed after longwall caving mining (Figure 1). The load previously supported by the extracted material is transferred to the surrounding gates and pillars (abutments). This creates zones of increased stress on the surrounding coal and rock mass, and zones of decreased stress in the goaf, so that the stress balance is maintained (Yavuz, 2004). As the extracted distance and the subsidence of the upper fractured rock mass increase, the caved material in the goaf is re-loaded by the weight of the overburden and undergoes compaction, which causes the supported load in the caved roof rock strata to be re-established to almost the original cover stress within a certain mining distance ( Xa, as shown in Figure 1).
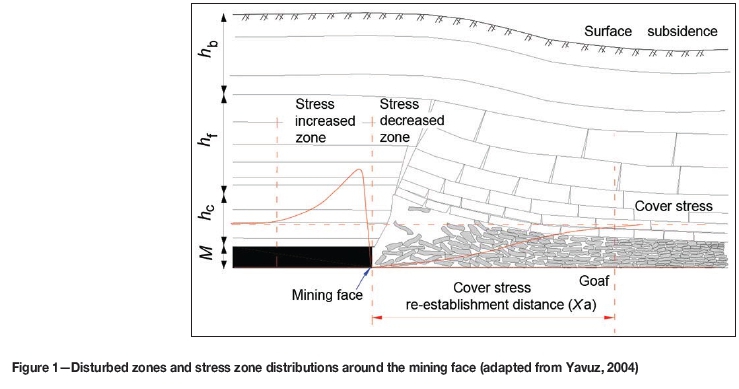
Much research has been done in previous studies on the zone of increased stress. Seventy-five in-situ monitoring data points show that the load transfer distance generally increases with cover depth (Figure 2). There is no obvious relationship between excavation height and load transfer distance (Abel, 1988; Singh et al., 2011; Zhang et al., 2012; Ouyang et al., 2009; Karacan and Goodman, 2009; Shen, King, and Guo, 2008). The maximum stress increases with decreasing mining thickness according to an elastic foundation approach (Majumder and Chakrabarty, 1991). The maximum stress decreases with increasing excavation thickness, and the distance of the maximum stress to the mining face increases, based on numerical simulation and analytical modelling (Xie, Yang, and Liu, 2006; Xie, Yang, and Chan, 2007). The stress concentration factors around a longwall panel change in different conditions, ranging from 1.08 to 6 (Sheorey, 1993; Xie et al., 2011; Khanal, Adhikary, and Balusu, 2012). After considerable effort to determine the coal pillar strength, some important formulae for calculating the abutment stress distribution were proposed and are listed in Table I.
Little research has been done on the zone of decreased stress in the goaf due to the inaccessibility of the goaf and potential danger (Wilson 1983; Yavuz, 2004; Suchowerska, Merifield, and Carter, 2013). An estimation method based on the concept of a shear angle, which is the angle between the vertical line at the panel edge and the inclined line to the strata over the caved zone, proposed by King and Whittaker (1970) and modified by Choi and McCain (1980) was considered. The shear angle might be equal to the angle of draw used in subsidence analysis as accepted by King and Whittaker (1970), who also suggested the value of the angle as 31° for British conditions. Choi and McCain (1971) proposed that the shear angle was between the vertical line at the panel edge and the line connecting the panel edge to the starting point of the complete vertical displacement zone. A value of 18° was accepted by Choi and McCain (1971), while Mark (1990) modified this value to 21°. Wilson (1983) proposed that the roof sagging in the goaf behind the mining face usually fitted a logarithmic or exponential type of equation. Furthermore, the compaction of broken material in the caved waste also fitted a logarithmic-type equation. Through comprehensive analysis, Wilson proposed that the relationship between the cover stress re-establishment and the distance from the mining face fits a linear form. A value of 0.3H was adopted as the cover stress re-establishment distance, where H is the working depth. Based on the investigations, the stress-strain relationship of the broken material in the goaf was assumed to be the same as a very large stone-built pack, and the cover stress would be reached at a distance of 0.12H (Smart and Haley, 1987). These researchers mostly assumed that the stress in the goaf increased linearly. Wade and Conroy (1980) conducted in-situ measurements of cover stress re-establishment in the goaf and subsidence of the ground surface above the goaf. The results indicated that the surface subsidence shows a good corresponding relationship with cover stress reestablishment in the goaf. An estimation function for cover stress re-establishment with the independent variables of depth, excavation height, bulking factor, and compressive strength of the rock fragments was proposed by Yavuz (2004) based on previous field and laboratory investigations. Considering the broken materials in the goaf with a strain-hardening characteristic (Pappas and Mark, 1993), 'double-yield' elements were applied to numerical simulation to analyse the characteristics of the cover stress reestablishment and stress-strain in the goaf, and some effective results were obtained (Yavuz, 2004; Esterhuizen, Mark, and Murphy, 2010; Saeedi et al., 2010; Shabanimashcool and Li, 2012).
According to the above summaries, two available analytical methods for estimation the re-establishment of cover stress in the goaf can be concluded, as follows.
Abutment angle model
In this concept, the abutment load is the weight of the wedge of the overburden material defined by the abutment angle β and a vertical line at the edge of the panel (see Figure 3). This weight, which should load on the goaf, is carried by the coal bed in front of the mining face, thus causing a zone of decreased stress in the goaf. This angle is almost equal to the angle of draw used in subsidence analysis, as shown in Figure 3.
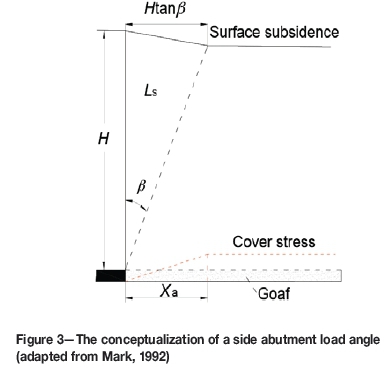
The weight of the wedge of the overburden can be expressed as Equation [1].

The re-establishment of cover stress following a linear function is assumed in this model, so the cover stress reestablishment distance is presented by Equation [2]:

where Ls is the weight of the wedge of the overburden, β is the abutment angle, γ is the unit weight of the overburden, H is the depth of the coal bed, and Xais the cover stress reestablishment distance.
Estimation method (Yavuz, 2004)
Yavuz (2004) discussed the stress-strain behaviour of the caved rock pile, bending of the lowest strata without caving depending on seam thickness, and residual expansion of fractured strata vertically over the caved zone from previous field and laboratory investigations, and established the relationships between these parameters and surface subsidence. Finally, Yavuz (2004) proposed two functions, one being a three-parameter power function for the distance of cover stress re-establishment, and the other an estimation with a six-parameter Taylor series polynomial function for the development of cover stress in sufficiently wide panels, as shown in Equation [3]:

where Sm is the surface subsidence above the cover stress re-establishment position in the goaf, M is the mining thickness, Xa is the distance of cover stress re-establishment, X is the distance to the mining face in the goaf, σv(X) is the cover stress re-establishment at the distance of X, and σv is the cover stress when the original stress is totally reestablished.
Much more work has been done on the stress increase zone than on the stress decrease zone (cover stress re-establishment). It is an appropriate method to study factors governing cover stress re-establishment based on the results of existing research on the stress increased zone, through establishing the relationship between them.
Methodology
In most cases, the distribution of cover stress reestablishment in the goaf is assumed to follow a linear function in order to simplify the calculation. The corresponding distance of cover stress re-establishment is generally described in terms of the cover depth of the coalbed modified with a coefficient (King and Whittaker, 1970; Choi and McCain, 1980; Wilson, 1983; Smart and Haley, 1987; Mark, 1990). However, due to the complex process of compression deformation of the caved materials in the goaf, it is proposed here that the cover stress re-establishment may follow a more complex rule than that of a linear function.
Theoretical analysis
The sagging function of the fractured rock mass
The stress increment characteristics depend on the characteristics of the roof sagging and the stress-strain relationship of the broken material in the goaf. Wilson (1983) proposed that the roof sagging curve usually fits a logarithmic- or exponential-type equation according to the in-situ measurements. The curve can be described by Equation [4]:
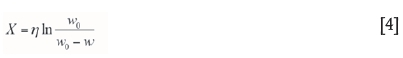
where X is the distance from the mining face, w is the amount of roof sagging, η is a constant required to give a close approximation to the measured values, and w0 is the ultimate amount of roof sagging.
From Equation [4], the parameter w can be expressed as:

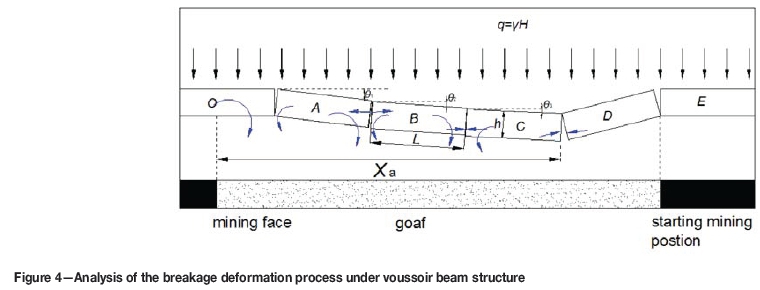
The model of voussoir beam theory was proposed by Qian, Shi, and Xu (2003) based on a previous study and a large number of results from in-situ observations and laboratory experiments. This theory was widely used in China to interpret the deformation and stress distribution in the rock strata above the extracted coal bed. The voussoir beam structure is always formed in the key stratum, which controls the overall deformation of the overburden. Failure of the key stratum will cause failure of the superincumbent overburden and generate subsidence of the ground surface. The voussior beam structure is illustrated in Figure 4. The key stratum breaks at a periodic fracture length L, and several broken rock blocks comprise the voussior structure, which supports the load from the overburden temporarily. These broken rock blocks remain stable for a short time, due to the frictional force between them, which is caused by the horizontal compression force. As the mining distance increases, the broken block in the key stratum (block C) tends to be stable, with a new broken block being generated (block O), and block C is supported by the caved rock mass in the goaf. The development of fracture between rock blocks and the rotational deformations of rock blocks are shown in Figure 4. The distance of the stable process of the broken rock blocks in the key stratum is equal to the distance of cover stress re-establishment in the goaf.
Miao and Qian (1995) proposed that the sagging curve of the broken key stratum approximately fitted an exponential function based on this mechanical analysis model, as shown in Equations [6] to [8]:
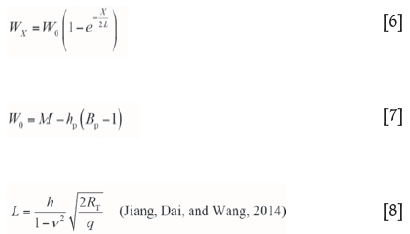
where WXis the sagging displacement at the distance X from the mining face, W0 is the maximum sagging displacement when the voussoir beam tends to be stable, Xis the distance from the mining face, L is the periodic fracture length, h and RTare the thickness and tensile strength of the key stratum respectively, q is the total weight of the key stratum and superincumbent strata. Bp is the remnant bulking factor of the broken strata below the key stratum, hp is the distance from the key stratum to the coalbed, and ν is the Poisson's ratio.
It is seen that Equations [5] and [6] are of the same form in describing the sagging curve of the roof above the caved zone. Here, Equation [6] is chosen as the function of the roof sagging form.
The stress-strain characteristics of the broken materials in the goaf
Pappas and Mark (1993) investigated strain hardening behaviour in the goaf as the material becomes stiffer and the elastic modulus increases under increasing compaction. With the increase in the size of fragments, the strain decreases under high-stress conditions. They also found that the stress-strain characteristics have little relation to the rock type.
According to the characteristics of the caved rocks, Salamon (1990) suggested the following equation for the backfill material to describe the stress-strain behaviour of goaf material:

where
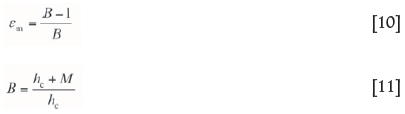
According to Equations [9] to [11], Bpin Equation [7] can be calculated by:

Yavuz (2004) proposed the following formula for E0:

where
σc is the uniaxial compressive strength of the rock
ε is the strain occurring under the applied stress
E0 is the initial tangent modulus σ is the applied stress
em is the maximum possible strain of bulked rock material
hc is the height of the caved zone
m is the excavation thickness
B is the bulking factor of the caved zone.
By substituting Equations [10], [11], and [13] into Equation [9], we obtain Equation [14]:

According to Equation [14], if the strain of caved rock in the cover stress re-establishment range was obtained, the stress change (cover stress re-establishment) can be calculated.
The sagging of the fractured rock mass will compress the caved rock mass, and the amount of sagging is equal to the vertical compression displacement of the caved rock mass.
The sagging amount of the fractured rock mass can be calculated using Equation [6], thus the corresponding strain can be calculated using Equation [15]:

Scale model test
Scale model testing is one of the common methods used in investigations of cover stress re-establishment in the goaf. A scale model test was conducted based on the Taiping coal mine.
Background geology and mining environment of scale model test
The Taiping coal mine is located in the southwestern part of the Yanzhou Coalfield, Shangdong, China, in the margin of the Western Shandong Block of the North China Platform.
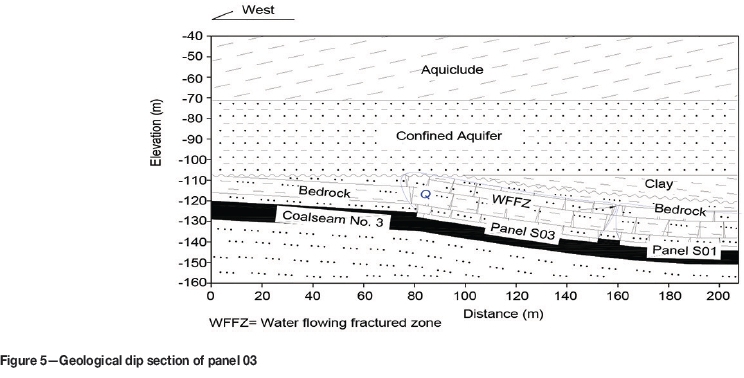
The thickness of the primary coal seam, No. 3, is approximately 8.85 m with the overburden bedrock consisting of clayey sandstone, siltstone, and fine- and medium-grained sandstones. The coal measure stratum dips at an angle of 5° to 15°. The strike directions of normal faults are usually in a north-south direction, while those of reverse faults are usually east-to-west. One of the geological dip sections is shown in Figure 5. The surface elevation is about 41.0 m; however, only the elevation from -40.0 m to -160.0 m is shown in this figure. Panel S03, with a width of 67.8 m and length of 428.7 m, belongs to the southern part of the 6th district in the Taiping coal mine. This area is located in the rising end of a syncline, as the coal measure stratum has a dip angle of 8° on average. A large area of the coal seam is directly covered by the Quaternary unconsolidated formations with a thickness from 133.0 m to 194.0 m and an average thickness of about 160.0 m. According to the exploration borehole results, the overburden bedrock thickness is from 20.0 to 32.6 m. The coal seam is designed to be excavated in four slices, each with a thickness of 2.2 m. When the top slice is excavated, the roof strata behind the longwall face are allowed to collapse, forming a water-flowing fractured zone (WFFZ) with a maximum height of 20.8 m, as shown in Figure 5. The lower three slices are excavated using backfilling methods. The cover stress re-establishment rule in the goaf when the top slice is excavated was studied by a scale model test.
Model building and stress monitoring
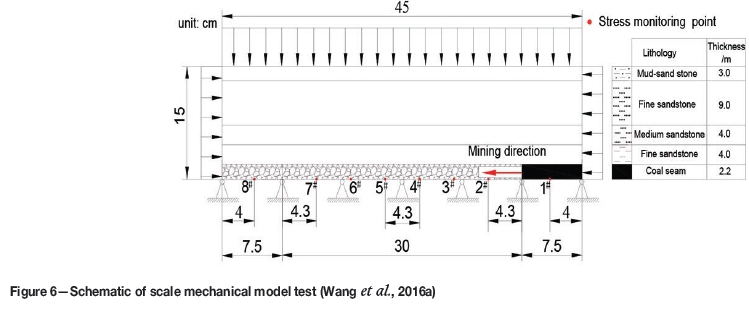
The dimensions of the scale model test rig are 45 χ 15 χ 10 cm (length χ height χ thickness). The model parameter scales are as follows:
► 1:200 for geometry (was set based on scale model frame size)
► 1:1.8 for gravity (according to the density ratio of the similar material to the real rock)
► 1:360 for uniaxial compressive strength (UCS) (calculated based on the similarity ratios of geometry and gravity).
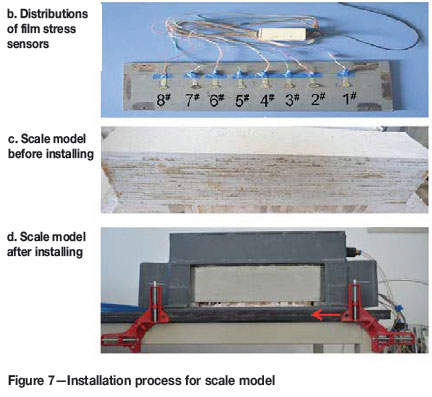
Materials used for modelling comprised a combination of quartz powder (particle size < 0.075 mm) and gypsum. Mica powder was well distributed between the rock layers to simulate bedding. This model included only the bedrock parts and 2.2 m coalbed, and the weight of upper unconsolidated formations was compensated for by a uniformly distributed load from above. Corresponding compensatory horizontal stresses calculated according to lateral pressure coefficient were applied on both sides of this model. The schematic mechanical scale model is shown in Figure 6, indicating the mining direction, the starting cut, and the positions of stress monitoring. The stratigraphic column of the proximate geology is also shown in Figure 6, and the mechanical properties of the coal measures and bedrock strata are listed in Table II. Some model test equipment, distribution of the film stress sensors, and the installation process of the scale model are shown in Figure 7. The toughened glasses were installed in the front and back sides for monitoring fracture evolution during the mining process. Airbags were installed above and on both sides for adding compensative load. On both sides of this model, 7.5 cm pillars were set. The coal bed was excavated at a distance of 7.5 cm from the right-hand side in the model in steps of 1 cm, and the time interval between succeeding steps was 20 minutes. The stress changes at the bottom of the coal-bed were monitored using eight film stress sensors, the positions of which can be seen in Figure 6 and Figure 7b.

Results and analysis
Cover stress re-establishment function in the goaf
By substituting Equation [15] into Equation [14], the cover stress re-establishment function g(x) can be expressed as:
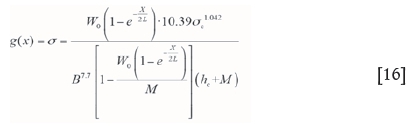
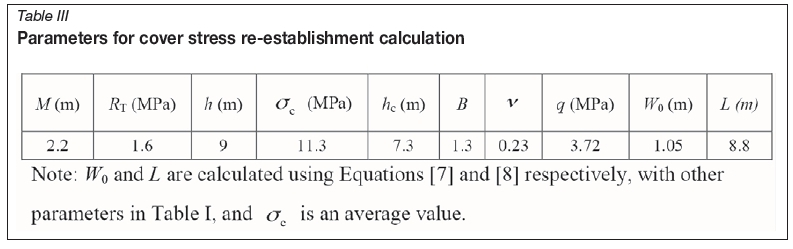
In order to better understand the shape of the cover stress re-establishment curve, the parameters from the Taiping coal mine, which are listed in Table III, were substituted into Equation [16].
Figure 8 is the cover stress re-establishment curve as the distance from the mining face increases in the goaf. The cover stress re-establishment rate decreases as the distance from the mining face increases. A logarithmic function was used to fit the curve to simplify the expression, and is well matched with R2 = 0.97 at a distance of 100.0 m. It can be seen that the fitting curve fits well in the early stage of cover stress reestablishment, however, the fitting curve presenting a discrete phenomenon in the later stage because the cover stress keeps stable in this stage. A logarithmic function with a form like y = a*ln(x+b)-c can be used to describe most of the cover stress re-establishment process generally.

Stress monitoring results from scale model test
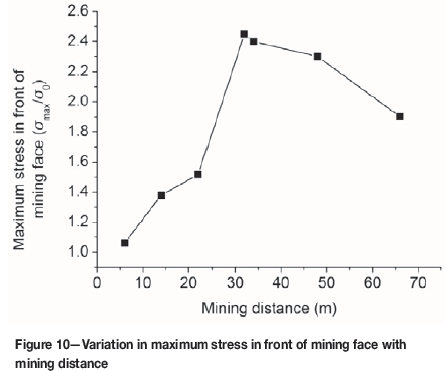
In order to simulate a complete stress re-establishment process, the left 7.5 cm pillar was excavated at the end. The stress monitoring (Figure 9) indicate that excavation of the coal bed caused the stress in front of the mining face and in the back pillar to increase. The nearer the monitoring site to the mining face, the greater the stress increase. However, the stress under the excavated coal bed decreased to nearly zero immediately, until the key stratum failed and compressed the broken materials, upon which the stress began to increase generally. This indicates that the cover stress reestablishment presents a hysteresis phenomenon due to the periodic fracture of the key stratum. The maximum stress in front of the mining face increases with mining distance before the key stratum generates the initial breakage. When the key stratum generates the periodic breakage, the maximum stress in front of mining face is a little lower than the maximum stress at the initial breakage, as shown in Figure 10. It is also seen that the mining influence distance is about 35 m (from stress monitoring points 1 and 8), the initial and periodic roof weighting lengths are about 30 m and 12 m respectively, and the cover stress re-establishment distance is about 40 m (including the periodic roof weighting length).
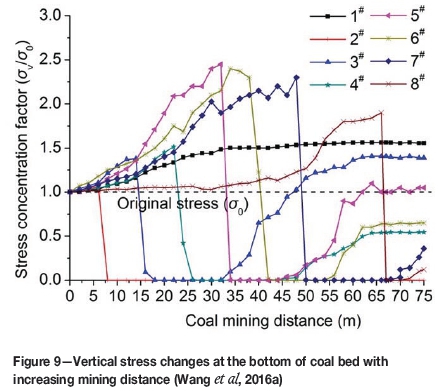
From the results of the scale model test in Figure 9, it can be seen that the extent of cover stress re-establishment differs greatly between different monitoring sites. The cover stress re-establishes in most of the stress monitoring sites, except at site 2. In some positions, the re-established cover stress is greater than the original stress; however, at some monitoring sites the re-established stress is lower than the original stress, or there may even be no re-establishment. However, on the whole, the cover stresses generally reestablish to the original stress. The size of the film stress sensors and the small inner structures of the broken rock mass in the goaf are the main reasons for this phenomenon. Some film stress sensors do not load the weight of the overburden, or do so only partly, although some sensors load a greater weight. Despite the differences in the weight of the overburden registered by the film stress sensors, the cover stress re-establishment processes are nearly the same. In this investigation, we assumed that the stress re-establishment processes at monitoring points 3 and 5, which are comparatively complete, could represent the cover stress reestablishment rule in the goaf after mining. In order to analyse the cover stress re-establishment rule, the relationships between the normalization results of cover stress and mining distance at these stress monitoring points are shown in Figure 11. A logarithmic function is used to fit these curves, which matched well with the R2 values of 0.97 and 0.85 respectively. These results show that the cover stress re-establishment in the goaf can be expressed using a logarithmic function with the form ofy = a*ln(x)-c. These two results coincide well with theoretical results presented previously.

Calculation of the distance of cover stress re-establishment based on the 'stress balance' model
'Stress balance' model
A hypothesis on the vertical stress distribution after a longwall panel mined was first proposed by Whittaker and Potts (1974), who presented the redistribution of stress in the form of 'high' and 'low' pressure zones. Wilson (1983) proposed that since the total downward force remains that of the cover load, any increase in stress over the rib-side must be compensated for by an equivalent stress reduction over the waste, and vice versa. Knowledge of one enables an estimate of the other, hence the term 'stress balance' for this approach, as shown in Figure 12. Compoli et al. (1993) conducted in-situ monitoring of stress changes in a coal-bed pillar and floor rock using a stainless steel borehole platened flat jack (BPF). They found that the measured stress was almost exactly equal to the original equilibrium pressure distribution as a result of the load being applied symmetrically in three dimensions, which confirmed the reliability of the 'stress balance' method.
According to the 'stress balance' and referring to Figure 12:

By adding A2 to both sides of Equation [17]:

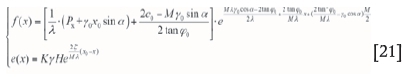
Therefore
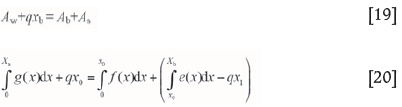
where x0is the width of yield zone, x1is the width of elastic zone, Xb = x0+x1; g(x) is the function of cover stress re-establishment,/(x) is the function of stress distribution in the yield zone, e(x) is the function of stress distribution in the elastic zone, op is the peak stress, A1, A2, A3, AW, AS are stress increased or decreased areas in different parts of the stress distribution, and Ab= A2+A3.
From Equation [20], if any side of the stress distribution function is known, the other side can be estimated.
The existing data on the zone of increased stress in front of the mining face is more abundant than that on the stress-decreased zone in the goaf, whether acquired by in-situ measurements or by analytical modelling. Figure 2 shows that there are abundant results from in-situ monitoring of the stress influence distance in front of the mining face, which increases with increasing mining depth. Thus, based on the in-situ measurements of stress distribution in front of the mining face, the distance of cover stress re-establishment in the goaf can be calculated from Equation [20].
Cover stress re-establishment distance
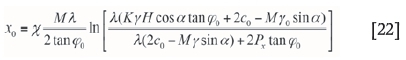
The functions describing stress distribution in front of the mining face are necessary for using the 'stress balance' model to calculate the cover stress re-establishment distance. The formulae from Xie, Yang, and Liu (2006) for the plastic zone and from Chen and Qian (1994) for the elastic zone, listed in Table I are substituted into Equation [20]:
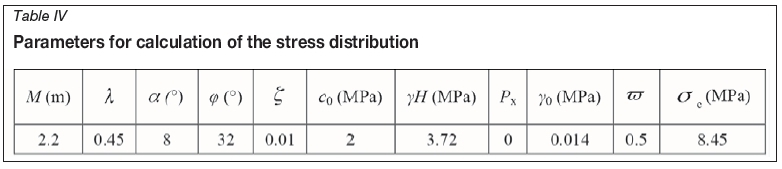
We applied this model to the Taiping coal mine to calculate the distance of cover stress re-establishment in panel S03. Some parameters for this calculation are listed in Table IV, and x0 can be calculated using Equation[22]. ( x1+x0) is always obtained from in-situ monitoring results.
The value of x is equal to the stress concentration factor K.
The maximum stress in front of the mining face can be calculated by Equation [23] (Xie, Yang, and Liu 2006)
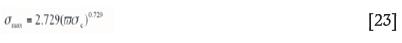
The maximum stress concentration factor K can be calculated using Equation [24]:

where  is the rheological coefficient of the coal bed, ocis the uniaxial compressive strength of the coalbed, and σ0is the original stress.
Taking the parameters in Table IV into Equations [23] and [24], we obtain:
The deformation of the tunnels on both sides of the panel can be monitored by displacement sensors. The deformation increases with increasing stress, thus the deformation monitoring results can also be used to determine the zone of increased stress in front of the mining face. When the coal bed was excavated in panel S03, the deformation of the surrounding rock was monitored at two sites (67 m and 95 m from the starting position) in the tunnels in front of the mining face. The results indicate that the tunnel displacements are close to zero when the mining face is far from the monitored sites; however, when the mining face advances to about 35 m from the monitoring sites, the displacement begins to increase markedly, as shown in Figure 13. The values in the vertical coordinate represent the relative displacement: positive numbers represent an increase and negative numbers a decrease. These results indicate that the stress increase influence range is about 35 m in front of mining face, thus, x0+x1= 35 m.
From x0, x0+x1, and the parameters listed in Tables II and IV, by substituting Equation [16] and Equation [21] into Equation [20], the cover stress re-establishment distance was calculated as 39 m. According to the hysteresis phenomenon of the cover stress re-establishment in the goaf, a periodic fracture length (L = 8.8 m) should be added for the whole distance of cover stress re-establishment, thus the total cover stress re-establishment distance should be 47.8 m. The stress distribution around the mining face in panel S03, based on 'stress balance' model, is shown in Figure 14.

Discussion
The scale model test results show that the maximum height of the water flowing fractured zone is 19.0 m, and the initial and periodic roof weighting lengths are about 30.0 m and 12.0 m respectively. These results are similar to the in-situ monitoring values of 20.8 m, 28.0 m, and 10.8 m respectively. This indicates that this scale model test results are valid.
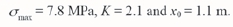
Cover stress re-establishment can also be calculated using the 'abutment angle' model and estimation method from Yavuz (2004). During the excavation of panel S03 at the Taiping coal mine, the surface subsidence was monitored along the vertical in the middle of the panel. As shown in Figure 15, the maximum surface subsidence ratio of 0.73 corresponds to the coal mining thickness of 2.2 m. Using the data shown in Figure 15, we calculated that the shear angle was 14.5°. The coal seam cover depth was 180 m, and the cover stress re-establishment distance was estimated to be 46.5 m using Equation [2] based on the 'abutment angle' model.
According to the estimation method from Yavuz (2004), the cover stress re-establishment distance was calculated to be 50.4 m using Equation [3]. However, the stress re-establishment function is applicable for X/Xa ratios between 0.2 and 0.8, since the data points between these ratios were used for the regression analysis. For X/Xa ratios of 0 and 1, ox/ovratios should be assigned as 0 and 1 respectively.
Combined with the 'stress balance' model, the results from the other two methods for calculating the cover stress re-establishment in the goaf are shown in Figure 16, from which it can be seen that the cover stress re-establishment distance calculated from the 'stress balance' model is similar to that obtained by the other two methods. However, the cover stress is assumed to re-establish from the mining face with consideration of the hysteresis phenomenon. The value of cover stress re-establishment at different distances, as calculated from 'stress balance' model, is lower than the results from the other two methods, which consider the hysteresis phenomenon. According to the stress balance conditions, the cover stress re-establishment results calculated from the 'abutment angle' model and estimation method from Yavuz (2004) are too large. The cover stress reestablishment generally decreases with increasing distance in the 'stress balance' model. The cover stresses obtained by the 'abutment angle' model and the estimation method from Yavuz (2004) are both assumed to re-establish to the original stress level. However, it is noted that the cover stress is reestablished to only 80% of the original stress based on the 'stress balance' model in this case. The main reasons for this are the stress-strain relationship of the caved materials in the goaf applied in Equation [14] and the stress distribution in front of the mining face. Actually, the increasing stress in the initial stage plays the primary role in control of deformation and permeability of the fractured rock mass, so the cover stress re-establishment calculated from the 'stress balance' model will be of great significance.

Conclusions
Previous studies of cover stress re-establishment in the goaf after underground coal mining suffer from weakness in that cover stress re-establishment calculation methods are generally simplified as linear functions. The voussoir beam theory, 'stress balance' model, and a scale model test were applied in this study of the cover stress re-establishment rule. The main results are as follows:
► The cover stress re-establishment rule in the goaf was derived as Equation [16], which can be approximatively described as a logarithmic function with a form like y = a*ln(x+b)-c
► The scale model test results indicate that cover stress re-establishment in the goaf presents a hysteresis phenomenon due to periodic fracture of the key stratum. The monitoring results of cover stress reestablishment from the scale model test agree well with the analytical result
► The cover stress re-establishment distance was calculated using the 'stress balance' model. This method was applied to the Taiping coal mine together with the other two previous methods, and a similar result was obtained by adding the hysteresis length (periodic fracture length). This method provides a new analytical technique for calculating the cover stress reestablishment distance.
Acknowledgements
The National Natural Science Foundation of China under Grant No. 41602298, and the Henan Institution of higher Education Key Scientific Research project (16A410004) are acknowledged. The authors also sincerely thank Gregory Weissmann at the University of the Pacific for his editorial help.
References
Abel, J.F. 1988. Soft rock pillars. Geotechnical and Geological Engineering, vol. 6, no. 3. pp. 215-248. [ Links ]
Chen, Y. and Qian, M. 1994. China's Coal Mining Strata Control. Coal Industry Press, Beijing (in Chinese). [ Links ]
Choi, D.S. and McCain, D.L. 1980. Design of longwall systems. Transactions of the Society of Mining Engineers of 'ABIE, vol. 268. pp. 1761-1764. [ Links ]
Compoli, A.A., Barton, T.M., Vandyke, F.C., and Gauna, M. 1993. Gob and gate road reaction to longwall mining in bump-prone strata. US Department of the Interior, Bureau of Mines. [ Links ]
Esterhuizen E., Mark, C., and Murphy, M.M. 2010. Numerical model calibration for simulating coal pillars, gob and overburden response. Proceedings of the 29th International Conference on Ground Control in Mining, Morgantown, WV. pp. 46-57. [ Links ]
Heasley, K.A. 1998. Numerical modeling of coal mines with a laminated displacement-discontinuity code. PhD thesis, Department. of Mining Engineering, Colorado School of Mines. [ Links ]
Jiang, J.Q., Dai J., and Wang, P. 2014. Overlying hard and thick strata breaking movement and broken-roof control. Rock and Soil Mechanics, vol. 35, supp.1. pp. 264-270 (in Chinese). [ Links ]
Karacan, C.Ö. and Goodman, G. 2009. Hydraulic conductivity changes and influencing factors in longwall overburden determined by slug tests in gobgas ventholes. International Journal of Rock Mechanics and Mining Sciences, vol. 46, no. 7. pp. 1162-1174. [ Links ]
Khanal, M., Adhikary, D., and Balusu, R. 2012. Numerical analysis and geotechnical assessment of mine scale model. International Journal of Mining Science and Technology, vol. 22, no. 5. pp. 693-698. [ Links ]
King, H.J. and Whittaker, B.N. 1970. A review of current knowledge on roadway behaviour, especially the problems on which further information is required. Proceedings of the Symposium on Strata Control in Roadways, Nottingham, UK. Institution of Mining Engineers, London. pp. 73-90. [ Links ]
Majumder, S. and Chakrabarty, S. 1991. The vertical stress distribution in a coal side of a roadway-an elastic foundation approach. Mining Science and Technology, vol. 12, no. 3. pp. 233-240. [ Links ]
Mark, C. 1990. Pillar design methods for longwall mining. US Department of the Interior, Bureau of Mines. [ Links ]
Miao, X.X. and Qian, M.G. 1995. Solid structure and model of voussoir beam of face surrounding rock. Ground Pressure and Strata Control, vol. 3. pp. 3-12 (in Chinese). [ Links ]
Ouyang, Z., Li, C., Xu, W., and Li, H.J. 2009. Measurements of in situ stress and mining-induced stress in Beiminghe Iron Mine of China. Journal of Central South University of Technology, vol. 16. pp. 85-90. [ Links ]
Pappas, D.M. and Mark, C. 1993. Behavior of simulated longwall gob material. US Department of the Interior, Bureau of Mines. [ Links ]
Peng, S.S. and Chiang, H.S. 1984. Longwall Mining. Wiley, New York. [ Links ]
Qian, M.G., Shi, P.W., and Xu, J.L. 2003. Rock pressure and strata control. China University of Mining and Technology Press, Xuzhou (in Chinese). [ Links ]
Saeedi G., Shahriar, K., Rrezai, B., and Karpuz, C. 2010. Numerical modelling of out-of-seam dilution in longwall retreat mining. International Journal of Rock Mechanics and Mining Sciences, vol. 47, no. 4. pp. 533-543. [ Links ]
Salamon, M.D.G. 1963. Elastic analysis of displacements and stresses induced by the mining of seam or reef deposits Part 1: fundamental principles and basic solutions as derived from idealized models. Journal of the South African Institute of Mining Metallurgy, vol. 64. pp. 128-149. [ Links ]
Salamon, M.D.G.. 1990. Mechanism of caving in longwall coal mining. Rock Mechanics Contribution and Challenges: Proceedings of the 31st US Symposium on Rock Mechanics, Golden, CO. CRC Press, Boca Raton, FL. pp. 161-168. [ Links ]
Shabanimashcool, M. and Li, C.C. 2012. Numerical modelling of longwall mining and stability analysis of the gates in a coal mine. International Journal of Rock Mechanics and Mining Sciences, vol. 51. pp. 24-34. [ Links ]
Shen, B., King A., and Guo, H. 2008. Displacement, stress and seismicity in roadway roofs during mining-induced failure. International Journal of Rock Mechanics and Mining Sciences, vol. 45, no. 5. pp. 672-688. [ Links ]
Sheorey, P.R. 1993. Design of coal pillar arrays and chain pillars. Comprehensive Rock Engineering. Pergamon Press, Oxford, vol. 2. pp. 631-70. [ Links ]
Singh A.K., Singh, R., Maitj J, Kumar, R., and Mandal, P. K. 2011. Assessment of mining induced stress development over coal pillars during depillaring. International Journal of Rock Mechanics and Mining Sciences, vol. 48, no. 5. pp. 805-818. [ Links ]
Singh, R., Singh, T.N., and Dhar, B.B. 1996. Coal pillar loading in shallow mining conditions. International Journal of Rock Mechanics and Mining Sciences & Geomechanics Abstracts, vol. 33, no. 8. pp. 757-768. [ Links ]
Smart, B. and Haley, S.M. 1987. Further development of the roof strata tilt concept for pack design and the estimation of stress development in a caved waste. Mining Science and Technology, vol. 5, no. 2. pp. 121-130. [ Links ]
Suchowerska, A.M., Merifield, R.S., Carter, J.P., and Clausen, J. 2012. Prediction of underground cavity roof collapse using the Hoek-Brown failure criterion. Computers and Geotechnics, vol. 44. pp. 93-103 [ Links ]
Suchowerska, A.M., Merifield, R.S., Carter, J.P. 2013.Vertical stress changes in multi-seam mining under supercritical longwall panels. International Journal of Rock Mechanics and Mining Sciences, vol. 61. pp. 306-320. [ Links ]
Sui, W.H., Hang Y., Ma, L.X., Zhou, Y. J., Long, G.Q., and Wei, L.B. 2015. interactions of overburden failure zones due to multiple-seam mining using longwall caving. Bulletin of Engineering Geology and the Environment, vol. 74, no. 3. pp. 1019-1035. [ Links ]
Wang, W.X., Jiang T., Faybishenko, B., Wang, Z.F., Hu W., and Zhao, Q.J. 2016a. Closure of fracture due to cover stress re-establishment after coal mining. Geotechnical and Geological Engineering, vol. 34, no. 5. pp. 1525-1537. [ Links ]
Wang, W.X., Sui, W.H., Faybishenko, B., and William, T.S. 2016b. Permeability variations within mining-induced fractured rock mass and its influence on groundwater inrush. Environmental Earth Sciences, vol. 75, no. 4. pp. 1-15. [ Links ]
Whittaker, B.N. and Potts, E.L. 1974. Appraisal of strata control practice: Discussion on by B.N. Whittaker, and authors' reply. 22F, 19R. Transactions of the Institution of Mining and Metallurgy, vol. 83. pp. A95-A109. International Journal of Rock Mechanics and Mining Sciences & Geomechanics Abstracts, vol. 11, no. 11. p. A225. [ Links ]
Wilson, A.H. 1983. The stability of underground workings in the soft rocks of the coal measures. International Journal of Mining Engineering, vol. 1, no. 2. pp. 91-187. [ Links ]
Xie, G.X., Yang, K., and Liu Q.M. 2006. Study on distribution laws of stress in inclined coal pillar for fully-mechanized top-coal caving face. Chinese Journal of Rock Mechanics and Engineering, vol. 25, no. 3. pp. 545-549 (in Chinese). [ Links ]
Xie, G.X., Yang, K., and Chang, J. 2007. Study on distribution characteristics of 3D stress and thickness effects of coal-seam in unsymmetrical disposal and fully-mechanized top-coal caving. Chinese Journal of Rock Mechanics and Engineering, vol. 26, no. 4. pp. 775-779 (in Chinese). [ Links ]
Xie, X.Z., Fan, Z.Z., Huang, Z.Z., and Xu G. 2011. Research on unsymmetrical loading effect induced by the secondary mining in the coal pillar. Procedia Engineering, vol. 26. pp. 725-730. [ Links ]
Yavuz. H. 2004. An estimation method for cover pressure re-establishment distance and pressure distribution in the goaf of longwall coal mines. International Journal of Rock Mechanics and Mining Sciences, vol. 41, no. 2. pp. 193-205. [ Links ]
Zhang, D.S., Fan, G.W., Liu, Y.D., and Ma, L.Q. 2010. Field trials of aquifer protection in longwall mining of shallow coal seams in China. International Journal of Rock Mechanics and Mining Sciences, vol. 47, no. 6. pp. 908-914. [ Links ]
Zhang, R., Wang, Z., and Chen, J. 2012. Experimental research on the variational characteristics of vertical stress of soft coal seam in front of mining face. Safety Science, vol. 50, no. 4. pp. 723-727. [ Links ]
Paper received Dec. 2015
Revised paper received Mar. 2017
* Corresponding Author.

