


Serviços Personalizados
Artigo
 Inglês (pdf)
 Artigo em XML
 Referências do artigo
Indicadores

Links relacionados
-
 Citado por Google
 -
 Similares em Google
Compartilhar

 Permalink
Journal of the Southern African Institute of Mining and Metallurgy
versão On-line ISSN 2411-9717
versão impressa ISSN 2225-6253
J. S. Afr. Inst. Min. Metall. vol.117 no.6 Johannesburg Jun. 2017
http://dx.doi.org/10.17159/2411-9717/2017/v117n6a8
PAPERS OF GENERAL INTEREST
Direct block-support simulation of grades in multi-element deposits: application to recoverable mineral resource estimation at Sungun porphyry copper-molybdenum deposit
S.A. HosseiniI; O. AsghariI; X. EmeryII
ISimulation and Data Processing Laboratory, School of Mining Engineering, University College of Engineering, University of Tehran, Tehran, Iran
IIUniversity of Chile, Chile
SYNOPSIS
Recoverable mineral resources assessment has become a standard geostatistical application in the mining industry, with various geostatistical techniques currently available. This investigation aimed to improve the prediction at the Sungun deposit and to obtain mineral resource models capable of handling (i) the change of support from drill-hole composites to selective mining units (SMUs), (ii) the multivariate nature of the ore control selection criteria that involves both copper and molybdenum grades; and (iii) the local uncertainty on the true (unknown) grades. The solution presented in this paper is to use direct block-support sequential cosimulation in order to construct a set of alternative outcomes of the copper and molybdenum grades on block support over the deposit, with no need for storing point-support values, hence with a considerable gain in memory management and CPU time. The grade realizations so obtained are then processed to calculate the uncertainty in the mineral resources that can be recovered above given cut-off grades, both globally and on a block-by-block basis.
Keywords: direct block support cosimulation, recoverable resources estimation, local uncertainty, Sungun porphyry copper-molybdenum deposit.
Introduction
Geostatistical methods are widely used by mining companies to determine a resource model of the tonnage and head grade of a potential orebody, which is one of the first and most critical inputs underpinning any mining project. The prediction of the grade, tonnage, and recoverable metal for a particular mining plan and the corresponding financial forecast constitute the main technical risks in mineral resource evaluation. The conventional approach to this problem is to predict the mineral grade for constant volumes relevant to the mining plan and to base the recoverable mineral resource calculations on those predictions. Alternatively, one can directly predict the local variability in the mining block grades based on a spatial distribution model (David 1988; Rossi and Deutsch 2014). Multiple realizations can also be constructed by conditional simulation, providing a more complete representation of block grade uncertainty, as well as the uncertainty over multiple blocks. Simulation methods allow quantification of the uncertainty of the mineral resource prediction risks in downstream studies such as mine design, mine planning, or operational optimization studies; the risk assessment is achieved after applying transfer functions to the conditional simulation models (Dimitrakopoulos 2012; Rossi and Deutsch 2014).
Recoverable mineral resource prediction and simulation models should be capable of handling: (1) a change of volumetric support, which is a common and critical issue in modelling regionalized variables such as mineral grades as, invariably, the volumetric support of the available data ( e.g., drill-hole composites) is much smaller than the blocks on which the model is based (Emery and Ortiz, 2011); (2) the multivariate nature of the ore control selection criteria (Montoya et al., 2012); (3) the local uncertainty, which refers to the probability distributions of the actual values at specific locations (Khan and Deutsch 2015). The solution is therefore to construct a multivariate block-support simulation and a post-processing aimed at producing a multivariate recoverable mineral resource evaluation.
The usual approach used for simulating grade values onto a block support consists in performing point-support simulation on a dense grid that covers the region of interest, and then averaging within relevant selective mining units (SMUs) or blocks in order to develop a simulated block-support (Boucher and Dimitrakopoulos, 2009; Emery, 2009; Emery and Ortiz, 2011). This procedure has two computational disadvantages: it is time-consuming and requires a significant amount of computer memory. An alternative is direct block-support simulation, which avoids simulating onto a grid that discretizes the blocks. This idea, as originally proposed by Journel and Huijbregts (1978), is based on separate simulation and conditioning steps. Boucher and Dimitrakopoulos (2009) expanded on direct block simulation by adding a decollation method (minimum/maximum autocorrelation factors), which allows reproduction of the spatial relationships between cross-correlated variables. Emery (2009) presented a computer program for direct block simulation that also accounts for the 'information effect', produced by misclassifications when selecting blocks as ore or waste, based on whether or not the predicted grade values exceed a threshold (Chilès and Delfiner 2012). Two algorithms for the direct block cosimulation of cross-correlated random fields are also presented by Emery and Ortiz (2011): the first one is a variation of sequential Gaussian cosimulation, with no need for storing point-support values; the second is a direct block simulation algorithm based on a spectral approach that incorporates a change-of-support model into the simulation process. In this study, the direct block sequential Gaussian cosimulation is applied to the Sungun copper-molybdenum data-set, and a practical implementation of direct block-support simulation for multi-element deposits is presented.
Principle of block-support sequential Gaussian cosimulation
The sequential algorithm proposed by Emery and Ortiz (2011) uses a change-of-support model to directly simulate block-support values. It is versatile enough to incorporate several coregionalized variables and to handle heterotopic data-sets, i.e., data-sets for which not all the variables are measured at all the data locations. It consists of the following steps:
1. For each variable of interest, transform the original point-support grade data into normal scores values with a mean of 0 and variance of 1
2. Fit a linear model of coregionalization (Wackernagel 2003) for the spatial structure of the normal scores data. In multi-element deposits for which the grades of K elements are of interest, the set of K(K + 1)/2 direct and cross-variograms must be calculated, then fitted by the linear model of coregionalization (LMC). This leads us to model all direct and cross-variograms from the same pool of basic variogram modelsλn(h) (n = 1,..., nst) with a unit sill:
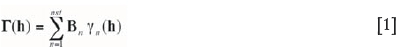
where h stands for a lag separation vector, Γ (h) for the K x K matrix of direct and cross-variograms at lag h, and each Bnis a real-valued, symmetric, positive semidefinite coregionalization matrix. The anisotropy and range parameters are fitted in the specification of each constituent nested structure λn(h). Automated or semi-automated procedures are often used for fitting of a linear model of coregionalization to ensure that the requirements of positivity of the coregionalization matrices are met
3. Divide the simulation domain into non-overlapping blocks
4. Select a block v in the domain among the blocks not yet simulated. Selection can be made according to a regular sequence or randomly
5. At a set of nodes (x1,...,xM) discretizing the block v, simulate Gaussian random fields that follow the linear model of coregionalization fitted at step (2), conditionally to the original point-support normal scores data and to the previously simulated block-support data located in and around this block (see next step for detail). The conditioning can be based on simple or ordinary cokriging, the latter being less sensitive to departures from ideal stationarity conditions than the former (Emery, 2007, 2009)
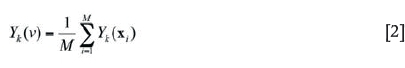
6. Average the simulated point-support Gaussian values (Yk(x) with k = 1... Kand i = 1... M) within the block, which provides block-support data to be used for further conditioning along the simulation path (step 5):
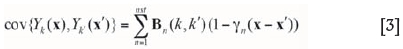
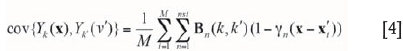
The direct and cross-covariance functions of the point- and block-support Gaussian random fields can be derived from the linear model of coregionalization fitted at step (2). Indeed, for any pair of indices k, k Є {1,..., K}, one has the following:
• Point-to-point covariance:
• Point-to-block covariance:
where {x1,...,xM} are a set of nodes discretizing block V.
• Block-to-block covariance:
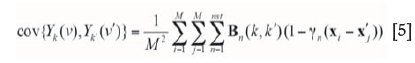
where {x1,...,xM} and {x1,...,x'M} discretize blocks v and v´, respectively.
Provided with these covariance functions between the Gaussian random fields at both point and block supports, it is straightforward to write the cokriging equations needed for the conditioning stage at step (5)
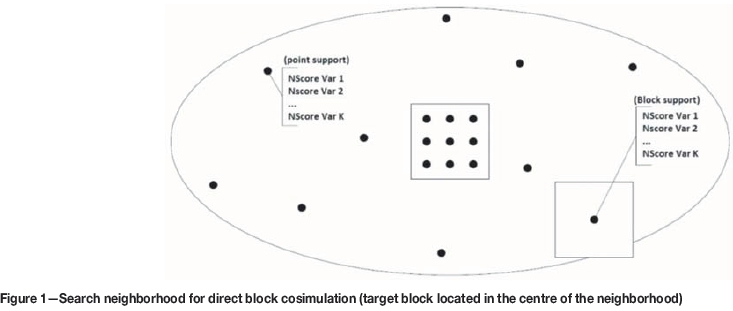
7. Back-transform the simulated point-support Gaussian values within the block and average them to obtain simulated block-support values for the original grade variables:
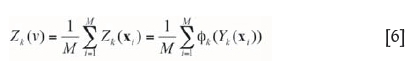
where is Gaussian transformation function associated with the k-th grade variable, i.e., the function that converts the Gaussian values into grade values. Note that the block-support grade data is not used in the conditioning stage at step (5) and that the block-support Gaussian data (Equation [2]) is used instead
8. Go back to step (4) until all the blocks are simulated.
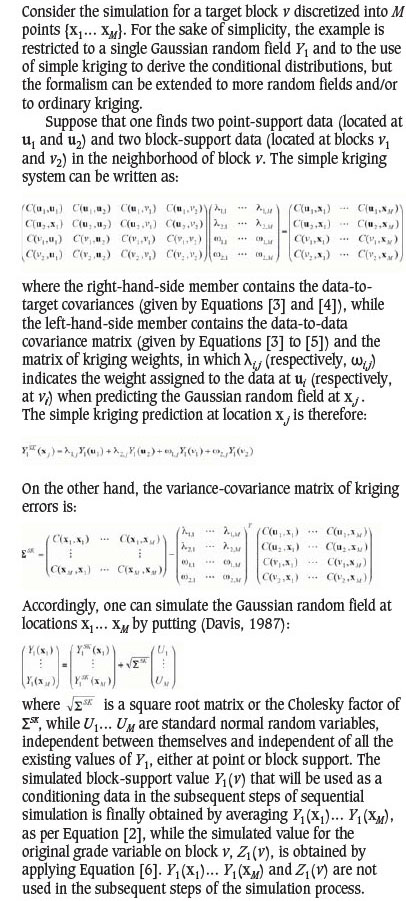
Because the simulated point-support Gaussian values are not stored and only block-support information is retained at steps (6) and (7), the above algorithm reduces the memory storage requirements of traditional sequential simulation. Also, the search for nearby conditioning data at step (5) is faster, as the number of previously simulated data is considerably fewer when using block-support data instead of point-support data. A graphical summary of the process for searching data and for simulating Gaussian and grade values is given in Figures 1 and 2, and a schematic example is provided in the Appendix.
Sungun copper deposit
Geological description
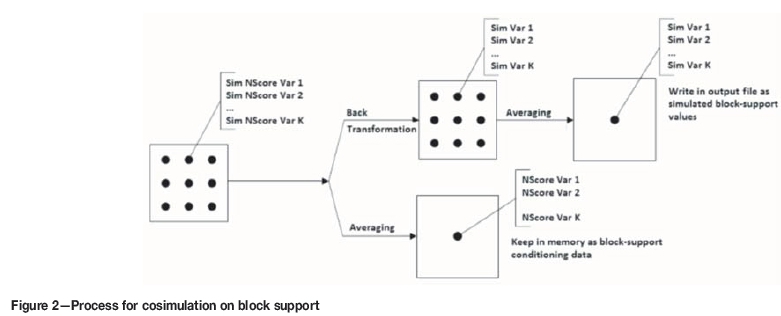
The Sungun porphyry copper-molybdenum deposit is located in the Eastern Azarbaijan Province, NW Iran, in the northwestern part of a NW-SE trending Cenozoic magmatic belt (the Sahand-Bazman Belt). The Sungun porphyries occur as calc-alkaline stocks and andesitic to dacitic dikes. Sungun is actually a skarn-porphyry deposit, and is called the Sungun porphyry copper-molybdenum deposit due to the large metal content in its porphyry section and the presence of molybdenum. This deposit is composed of quartz monzonite (major intrusive bodies) and diorite-granodiorite, which have been injected into Eocene volcano-sedimentary and Cretaceous carbonate rocks. The emplacement of the Sungun stock took place in several intrusive pulses associated with hydrothermal activity (Hezarkhani, 2006). The arrangement of alteration and mineralization domains is complicated and does not conform to the simple models of porphyry systems. (Asghari and Hezarkhani, 2008; Soltani, Afzal, and Asghari, 2014; Talebi, Asghari, and Emery, 2015). During the alteration and mineralization in Sungun, three different hydrothermal fluids were present: (1) hydrothermal fluids that were derived magmatically and were characterized by high temperatures and moderate to high salinities caused potassic alteration and Cu ± Mo mineralization, (2) a mixture of magmatic fluid with a predominantly meteoric fluid, resulting in lower temperatures and salinities, that was responsible for sericitization at higher levels and transition alteration at depth, and (3) a relatively oxidized meteoric water which produced a peripheral propylitic alteration zone outside the core of potassically altered rock. (Hezarkhani and Williams-Jones, 1998; Tahmasebi, Hezarkhani, and Mortazavi, 2010). Four alteration zones can be identified Sungun: (1) potassic, (2) propylitic, (3) phyllic, and (4) argillic (Hezarkhani and Williams-Jones, 1998). Two elements are of interest for resource modelling: copper (Cu) as the main product, and molybdenum (Mo) as a by-product.
Data-set
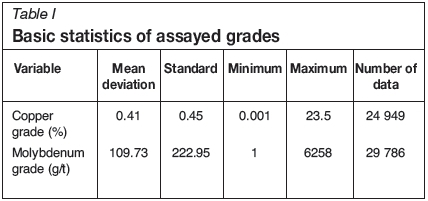
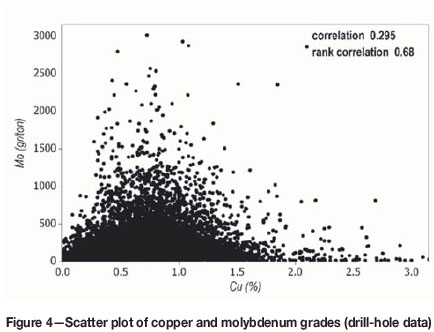
A set of 31 533 diamond drill-hole samples, distributed in a volume of about 1200 m x 1100 m x 1000 m, were available for the study (Figure 1). Copper and molybdenum grades have been analysed with a proper QA/QC process in order to ensure data accuracy, and composited to 2 m lengths. Table I indicates the basic statistics of the composited data. It is seen that the two grades have not been measured for all the samples and the data-set is therefore partially heterotopic. The linear coefficient of correlation between copper and molybdenum grades is 0.30, but this correlation rises to 0.53 after transforming the grades into normal scores. Also, the Spearman rank correlation coefficient is equal to 0.68, indicating a significant dependence between copper and molybdenum grades (Figure 4). These correlation coefficients can be explained by the minerals associations present in the Sungun deposit, especially in the potassic alteration zone. Several main vein groups have been identified, for instance quartz + molybdenite + anhydrite + K-feldspars + pyrite + chalcopyrite and quartz + chalcopyrite + pyrite ± molybdenite (Hezarkhani and Williams-Jones, 1988).
Cosimulation ofgrades at a block support
In the following analyses, it is of interest to construct a set of realizations of the copper and molybdenum grades over the deposit that match the known values at the sample locations, mimic the spatial variability of the true unknown values at unsampled locations, and reproduce the spatial dependence between the grades, as described by their cross-variogram (Chilès and Delfiner, 2012; Wackernagel 2003). The steps for constructing the realizations using block-support sequential Gaussian cosimulation are as follows:
► Declustering of the original data to obtain representative distributions of the grade variables
► Normal scores transformation of copper and molybdenum grades
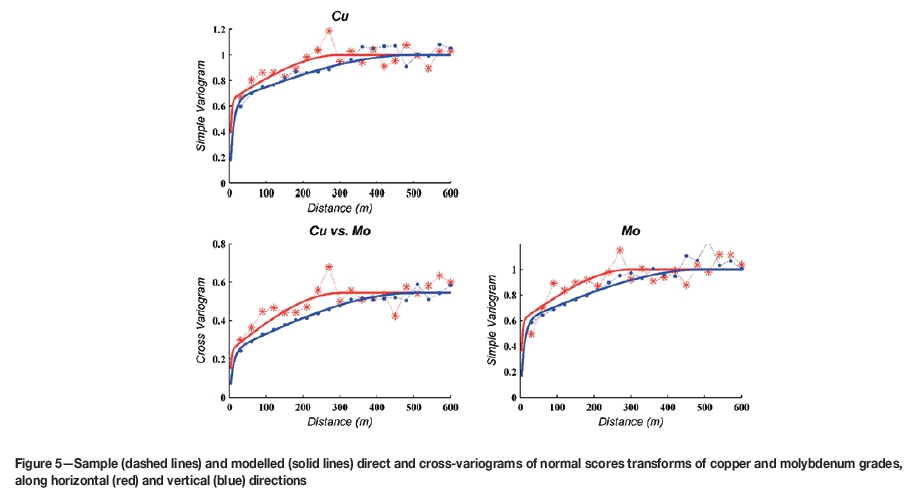
► Calculation of the sample variograms of the normal scores data along the recognized directions of anisotropy (horizontal plane and vertical direction)
► Fitting of a linear model of coregionalization, using nugget, exponential, and spherical structures (Figure 5). The fitted model is presented in Equation [7], where the horizontal and vertical ranges are indicated in brackets
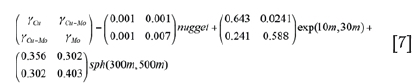
This is a licit model of coregionalization, insofar as the three coregionalization matrices are symmetric and positive semidefinite. For practicality, a semi-automated technique has been used to fit the sill matrices of each nested structure based on the calculated sample variograms (Goulard and Voltz, 1992; Emery, 2010)
► Definition of a regular grid covering the domain, with 48 x 47 x 100 blocks of size 25 m x 25 m x 10 m, which represent the size of the SMUs. Each grid block is furthermore discretized into 5 x 5 x 2 points
► Construction of 100 conditional realizations of the copper and molybdenum grades using direct block-support sequential Gaussian cosimulation, as explained in the previous section.
Since each block is discretized into M = 50 points, the direct simulation approach reduces the size of the problem (storing of simulated values and search for nearby data) by a factor of 50 with respect to the traditional point-support simulation followed by block averaging. The gain is thus very attractive from a computational point of view in order to account for the change of support from the point-support samples to the SMU support. No information effect is taken into account in this work, but it could be incorporated if a pattern of production data were available to predict the block-support grade for ore/waste classification (Emery and Ortiz, 2011).
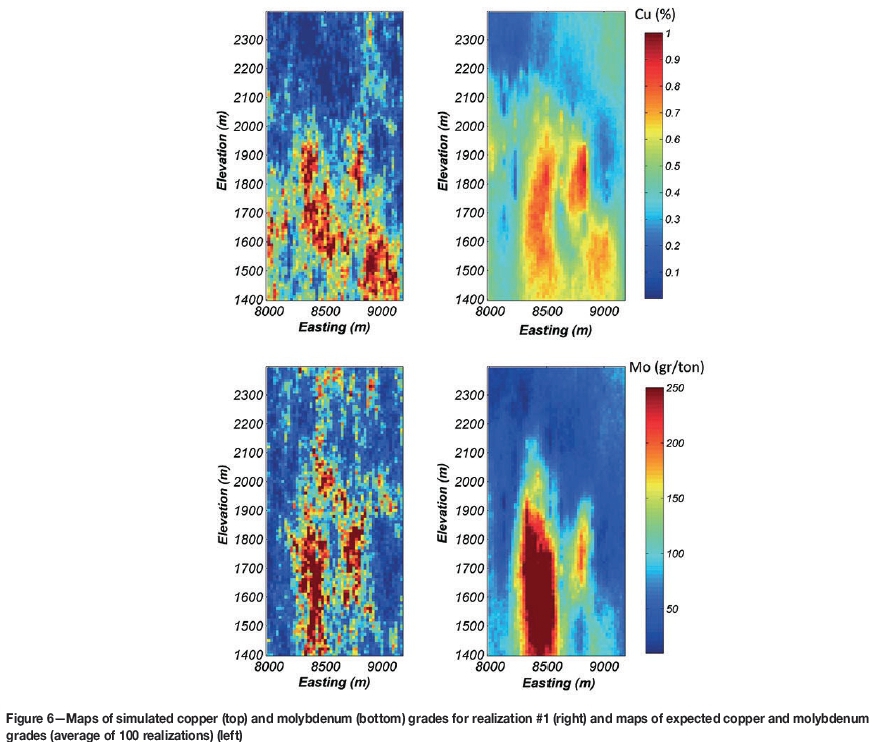
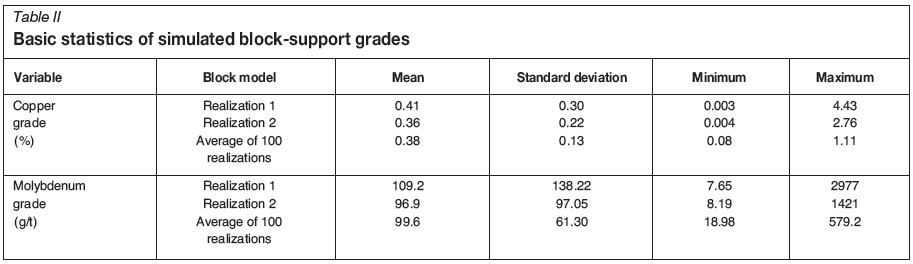
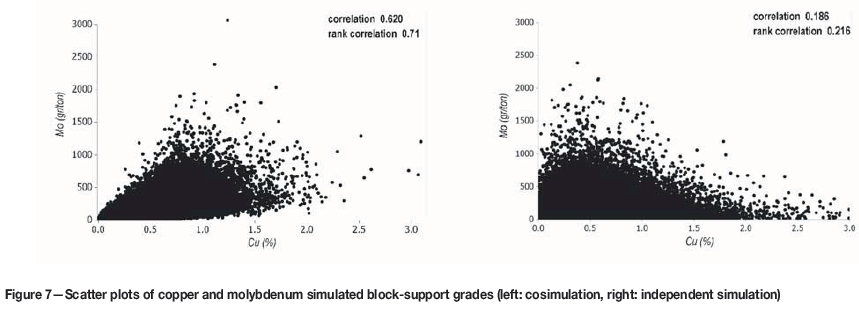
For both elements of interest (copper and molybdenum grades), the maps of the first realization and of the average of 100 realizations for a selected section at northing 4800 m are displayed in Figure 6. As can be expected, the latter maps smooth the variability and display much smaller contrasts and fluctuations than the former, which are intended to reproduce the 'true' SMU grade variability at all spatial scales. This fact can be corroborated by examining the statistics of the simulated block-support grades (Table II), which show a higher dispersion and larger range of the simulated grades for the individual realizations than for the average of 100 realizations. However, due to the support effect (Chilès and Delfiner, 2012), the variability of the simulated grades is smaller than that of the original point-support data (Table I). Likewise, the linear correlation coefficient between the simulated copper and molybdenum grades (0.62) is higher than that of the original data (0.30), which is also a consequence of the support effect that smooths small-scale variability and therefore enhances the correlation between both variables (Figure 7, left). It is noteworthy that the rank correlation coefficient of the point-support data does not change significantly with the simulated block-support grades (0.71 vs. 0.68). For comparison, if copper and molybdenum grades are simulated separately, as if these two variables were independent, the rank correlation coefficient between the simulated block-support grades would drop to 0.22, much lower than that of the original data (Figure 7, right), hence the importance of jointly simulating both variables to reproduce their dependence relationships.
Assessing global uncertainty on recoverable resources
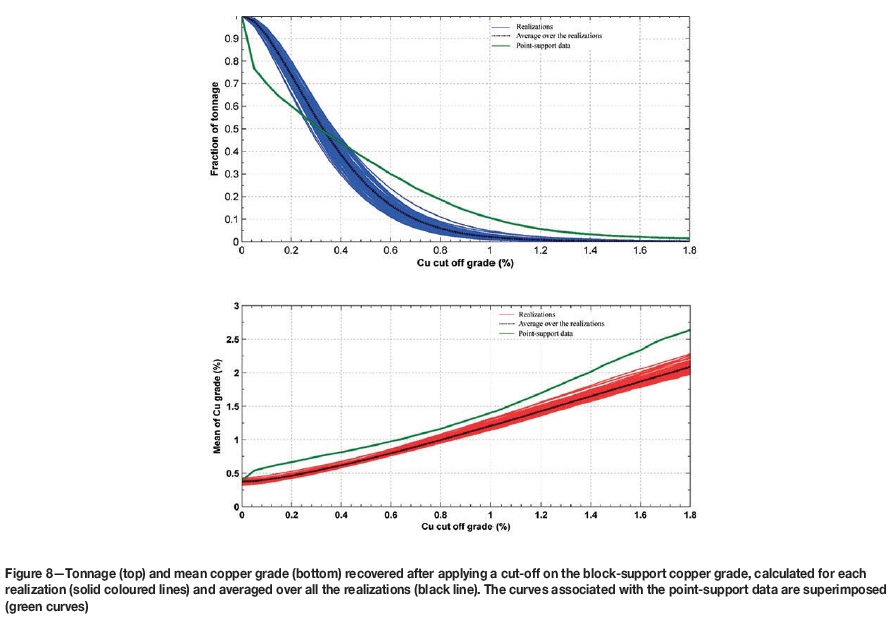
For each realization, the recoverable copper and molybdenum mineral resources above given cut-off grades are calculated. The expected recoverable mineral resources are then defined by an average over the realizations. The analysis of uncertainty of grade, tonnage, and metal curves by long-term planning engineers can be carried out to understand the recoverable mineral resource scenarios at different cut-offs. The tonnages and mean copper grades above different cutoffs for all realizations and their averages are shown in Figure 8, together with the curves associated with the original copper data at the sample support. It can be seen that the tonnage curve of the data decreases faster at low cut-offs, and slower at high cut-offs, than that of the block-support realizations, and that, at a zero cut-off, the mean grades for both the point-support data and the block-support realizations are comparable. These results are consistent with the change-of-support theory, as the point-support and block-support distributions of the copper grade should have the same mean value and the former should be more selective than the latter (Chilès and Delfiner, 2012), and demonstrate that the realizations are unbiased and correctly reproduce the support effect.
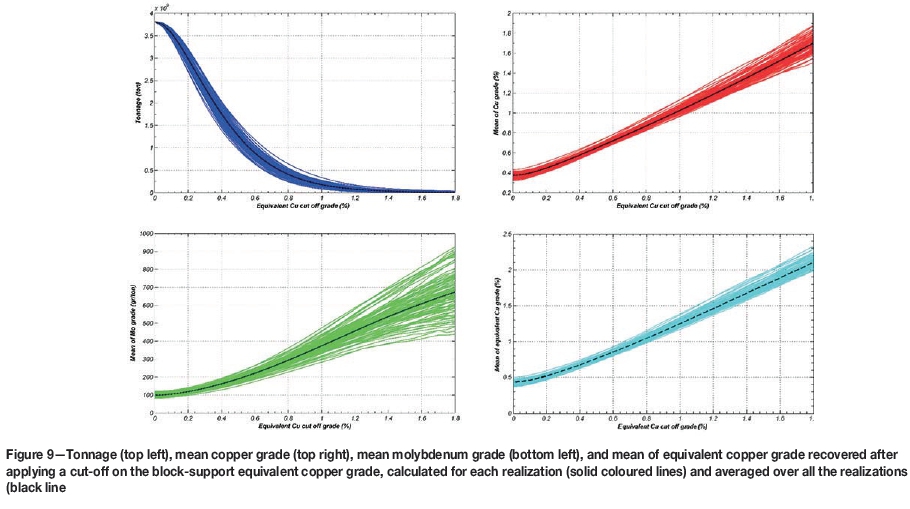
Since the mineralization comprises more than one metal of economic value (copper and molybdenum), the two grades can be converted to a single value or 'equivalent grade'. Typically the minor metals are converted and added to the grade of the major metal. In the present case, the equivalent copper grade is defined as

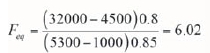
where ZCuis copper grade, ZMomolybdenum grade, and the equivalent factor is equal to
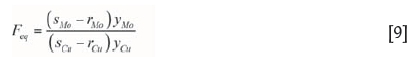
with s the selling price, r the refinery cost, and y the recovery for each metal, i.e.
The grade-tonnage curves based on different cut-offs on the equivalent copper grade are calculated for all the realizations (Figure 9). These curves can be used for ore/waste selection and for finding the optimum cut-off grade (Osanloo and Ataei, 2003; Ataei and Osanloo, 2003).
A complete mineral resources model should include a predicted grade, tonnage, and metal above respective cut-offs and a detailed assessment of uncertainty and the consequences of such uncertainty (Dimitrakopoulos, 1997).
Now, since each realization constitutes a plausible outcome for the deposit, the 'true' tonnage and grade curves should lie within the set of simulated curves (although uncertainty with regard to model parameters, including uncertainty on inferred variograms, used as inputs to the simulation remains additional unquantified uncertainty). The realizations thus provide an image of the uncertainty on the mineral resources: a risk analysis can be performed with the simulated curves (Figures 8 and 9) in order to assess the worse and the best scenarios, with no need for (or in addition to) the traditional classification of mineral resources into Measured, Indicated, or Inferred. Also, one can assess the uncertainty on the mineral resources after applying a cut-off without generating biased conclusions (Emery, Ortiz, and Rodriguez, 2006).
Assessing local uncertainty on recoverable resources
The results obtained from direct block conditional simulation can also be used for measuring uncertainty in the prepared models on a block-by-block basis, by providing cumulative distribution functions for the copper and molybdenum grades of each SMU. Important parameters extractable from such cumulative distribution functions include the conditional variance, the conditional coefficient of variation, the conditional interquartile range, and probability intervals (Dimitrakopoulos, Godoy, and Chou, 2009), which measure the level of uncertainty on the SMU grades.
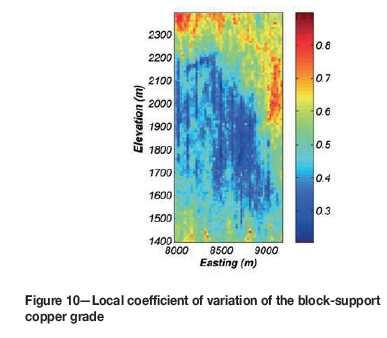
For instance, Figure 10 displays the conditional coefficient of variation at the support of SMUs, calculated with 100 realizations of the block-support copper grade for the selected section at northing 4800 m. This coefficient constitutes an appropriate measure for classifying the resources for a considered uncertainty level (Emery, Ortiz, and Rodriguez, 2006; Dimitrakopoulos, Godoy, and Chou, 2009). The areas located in the top and bottom parts of the region displayed in Figure 10 correspond to sparsely sampled areas, in which the uncertainty in the true grades turns out to be higher than in densely sampled areas (Figure 4).
Conclusions
The objective of the approach developed for Sungun was to remove current limitations of conventional techniques for determining the recoverable mineral resources and to ensure robust mineral resource models capable of handling (1) the change of support from the data support (drill-hole composite) to the target SMU block; (2) the multivariate nature of the ore control selection criteria, which involve not only copper but also molybdenum; and (3) the uncertainty in the actual (unknown) block grades. The solution presented in this paper is to construct a set of alternative block grade models using direct block-support cosimulation. Regarding the sought objectives, the proposed approach is remarkably simple, depending on a few key parameters (essentially, the transformation functions from grades to normal scores and the coregionalization model for the normal scores data).
Block-support cosimulation has interesting applications for predicting recoverable resources. It allows a full and proper characterization of the variability of the key elements at all spatial scales within the orebody. The post-processing of the realizations allows for measurement of the uncertainty in the resources recoverable above any cut-off, at both global and local scales, and provides a characterization of the risk attached to the mining project due to the uncertainty on the mineral resources. These are useful tools that can be incorporated into exploration, exploitation, and scheduling of the Sungun porphyry deposit.
Acknowledgements
The authors are grateful to Sungun copper mine for providing the data-set used in this work. This work was partially supported by the Chilean Commission for Scientific and Technological Research, through Projects CONICYT / FONDECYT / REGULAR / N°1130085 and CONICYT PIA Anillo ACT 1407.
References
Asghari, O. and Hezarkhani, A. 2008. Applying discriminant analysis to separate the alteration zones within the Sungun porphyry copper deposit. Journal of Applied Sciences, vol. 8, no. 24. pp. 4472-4486. [ Links ]
Ataei, M. and Osanloo, M. 2003. Determination of optimum cutoff grades of multiple metal deposits by using the golden section search method. Journal of the South African Institute of Mining and Metallurgy, vol. 103, no. 8. pp. 493-499. [ Links ]
Boucher, A. and Dimitrakopoulos, R. 2009. Block simulation of multiple correlated variables Mathematical Geosciences, vol. 41. pp. 215-237 [ Links ]
Chilès, J.P. and Delfiner, P. 2012. Geostatistics: Modeling Spatial Uncertainty. 2nd edn. Wiley, New York [ Links ]
David, M. 1988. Handbook of Applied Advanced Geostatistical Ore Reserve Estimation. Elsevier, Amsterdam. [ Links ]
Davis, M.W. 1987. Production of conditional simulations via the LU triangular decomposition of the covariance matrix. Mathematical geology, vol. 19, no. 2. pp. 91-98 [ Links ]
Dimitrakopoulos, R. 1997. Conditional simulations: tools for modelling uncertainty in open pit optimisation. Optimizing with Whittle. Whittle Programming (Pty) Ltd, Perth. pp 31-42. [ Links ]
Dimitrakopoulos, R. 2012. Advances in orebody modelling and strategic mine planning. Spectrum Series 17. Australasian Iinstitute of Mining and Metallurgy, Melbourne. 345 pp. [ Links ]
Dimitrakopoulos, R., Godoy, M., and Chou, C.L. 2009. Resource/reserve classification with integrated geometric and local grade variability measures. Proceedings of Orebody Modelling and Strategic Mine Planning 2009. Australasian Institute of Mining and Metallurgy, Melbourne. pp. 207-214. [ Links ]
Emery, X. 2007. Conditioning simulations of Gaussian random fields by ordinary kriging. Mathematical Geology, vol. 39, no. 6. pp. 607-623. [ Links ]
EMERY, X. 2009. Change-of-support models and computer programs for direct block-support simulation. Computers and Geosciences, vol. 35, no. 10. pp. 2047-2056. [ Links ]
Emery, X. 2010. Iterative algorithms for fitting a linear model of coregionalization. Computers and Geosciences, vol. 36, no. 9. pp. 1150-1160. [ Links ]
Emery, X. and Ortiz, J.M. 2011. Two approaches to direct block-support conditional co-simulation. Computers and Geosciences, vol. 37, no. 8. pp. 1015-1025. [ Links ]
Emery, X., Ortiz, J.M., and Rodriguez, J.J. 2006. Quantifying uncertainty in mineral resources by use of classification schemes and conditional simulations. Mathematical Geology, vol. 38, no. 4. pp. 445-464. [ Links ]
Goulard, M. and Voltz, M. 1992. Linear coregionalization model: tools for estimation and choice of cross-variogram matrix. Mathematical Geology, vol. 24, no. 3. pp. 269-286. [ Links ]
Hezarkhani, A. 2006. Petrology of intrusive rocks within the sungun porphyry copper deposit, Azarbaijan, Iran. Journal of Asian Earth Sciences, vol. 27, no. 3. pp. 326-340. [ Links ]
Hezarkhani, A. and Williams-Jones, A.E. 1998. Controls of alteration and mineralization in the sungun porphyry copper deposit, Iran: evidence from fluid inclusions and stable isotopes. Economic Geology, vol. 93. pp. 651-670. [ Links ]
Journel, A.G. and Huijbregts, C.J. 1978. Mining Geostatistics. Academic Press, New York. [ Links ]
Khan, K.D. and Deutsch C.V. 2015. Practical incorporation of multivariate parameter uncertainty in geostatistical resource modeling. Natural Resources Research. pp. 1-20. [ Links ]
Montoya, C., Emery, X., Rubio, E., and Wiertz, J. 2012. Multivariate resource modelling for assessing uncertainty in mine design and mine planning, Journal of the Southern African Institute of Mining and Metallurgy, vol. 112. pp. 353-363. [ Links ]
Osanloo, M., and Ataei, M. 2003. Using equivalent grade factors to find the optimum cut-off grades of multiple metal deposits. Minerals Engineering, vol. 16, no. 8. pp. 771-776. [ Links ]
Rossi, M.E. and Deutsch, C.V. 2014. Mineral Resource Estimation. Springer, New York. [ Links ]
Soltani, F., Afzal, P., and Asghari, O. 2014. Delineation of alteration zones based on Sequential Gaussian Simulation and concentration-volume fractal modeling in the hypogene zone of Sungun copper deposit NW Iran. Journal of Geochemical Exploration, vol. 140. pp. 64-76. [ Links ]
Tahmasebi, P., Hezarkhani, A., and Mortazavi, M. 2010. Application of discriminant analysis for alteration separation; Sungun copper deposit, East Azerbaijan, Iran. Australian Journal of Basic and Applied Sciences, vol. 6, no. 4. pp. 564-576. [ Links ]
Talebi, H., Asghari, O., and Emery, X. 2015. Stochastic rock type modeling in a porphyry copper deposit and its application to copper grade evaluation. Journal of Geochemical Exploration, vol. 157. pp. 162-168. [ Links ]
Wackernagel, H. 2003. Multivariate Geostatistics-An Introduction with Applications. Springer, Berlin. [ Links ] ♦
Paper received Dec. 2015
Revised paper received Mar. 2017

