


Services on Demand
Article
 English (pdf)
 Article in xml format
 Article references
Indicators

Related links
-
 Cited by Google
 -
 Similars in Google
Share

 Permalink
Journal of the Southern African Institute of Mining and Metallurgy
On-line version ISSN 2411-9717
Print version ISSN 2225-6253
J. S. Afr. Inst. Min. Metall. vol.117 n.6 Johannesburg Jun. 2017
http://dx.doi.org/10.17159/2411-9717/2017/v117n6a5
PAPERS OF GENERAL INTEREST
Determination of magnitude completeness from convex Gutenberg-Richter graphs in the central portion of the Kiirunavaara mine
M. Svartsjaern; A. Eitzenberger
Division of Mining and Rock Engineering, Department of Civil, Environmental and Natural Resources Engineering, Luled University of Technology, Sweden
SYNOPSIS
This paper describes a study of seismic records from the Kiirunavaara mine footwall which were interpreted in relation with numerical models developed outside the study. Seismic data was retrieved from a portion of the mine and filtered with respect to the ratio between energy carried by an event's P (primary) and S (secondary) waves (Es/Ep ratio), local magnitude, and active mining depth. The data was analysed using Es/Ep ratios and Gutenberg-Richter graphs to determine the event origin, mechanisms, and minimum magnitude cut-off. The magnitude completeness was identified by studying the A-value stability and A-value differentiation between origin sets. It was shown that, by separating seismic events into the origin components shear, complex, and tensile based on Es/Ep ratios, a representative value for the magnitude completeness can be identified for a catalogue with a convex cumulative log curve. The majority of the events were shown to be of shear-slip origin based on the recorded Es/Ep ratios, with pure tensile events constituting only about 10% of the recorded data. Spatial and temporal event location patterns were studied and compared with numerical modelling results. The comparison showed a correlation between shear-slip seismic events and volumes experiencing high differential stresses in the lower part of the footwall. In the upper part of the footwall the results did not reveal any clear correlation between observed damage in drifts and seismic event locations. The concentration of seismic events in the lower portion of the footwall is discussed in the context of rock mass displacements. The results indicate a possible connection between mine seismicity at depth and damage observations in the drifts in higher non-seismic areas by seismic softening and subsequent lateral expansion of the rock mass.
Keywords: mine seismicity, event origin, failure mode, Gutenberg-Richter relationship, Es/Ep ratio.
Introduction
The general trend of increasing mining depths throughout the world implies an increase in mining-induced seismicity. Advances in monitoring techniques have allowed more seismic data to be collected and recorded, and its importance is generally accepted across various disciplines. This data has assisted in predicting the origin of seismic events and explaining the plausible underlying causes, and in so doing, aiding strategic mine planning.
The link between mining and recorded seismicity has been a focus of research for many years. Notable recent works include McKinnon (2006), who showed how even small stress changes from mining activities could activate seismic faults in volumes proportionally much larger than the mining area itself. These remote fault-slip events were also recognized by Richardson and Jordan (2002) as 'type B' events activated by long-term mining. The 'type B' events described by Richardson and Jordan (2002) were recognized primarily as originating from shear-type events which are commonly associated with mining-induced seismicity (Ortlepp, 2000). Shear-type and non-shear events are most typically distinguished by studying the ratios of energy carried by an event's P (primary) and S (secondary) waves. This relation is referred to as the Es/Ep ratio (Richardson and Jordan, 2002, Snelling, Godin, McKinnon, 2013; Xu et al., 2014).
Separating seismic events by types and categories allows for detailed analysis on what are often otherwise significantly large data-sets. Simplification and analysis by filtering and clustering of seismic data is a common first step when analysing located events, as demonstrated by Lynch and Malovichko (2006), Richardson and Jordan (2002), Orlecka-Sikora et al. (2012), Xu et al. (2014), and Cesca, Sen, and Dahm (2014).
The basis for these analyses is the fact that a seismic or acoustic event is an indication of changes in rock mass properties due to fracture slip and growth (Shen et al., 1995). Cai, Kaiser, and Martin (2001) and Shen et al. (1995) noted this fracture growth as a reduction of the rock mass matrix stiffness. This effect was also demonstrated by Young et al. (2004), who observed a reduction in the Young s modulus following recorded micro-seismicity. The correlation between fracture growth and subsequent stiffness reduction was used by Agliardi et al. (2013) to track progressive fracture growth leading up to rock mass failure by measuring changes in GSI (Geological Strength Index). Cai, Kaiser, and Martin (2001) used seismic data to directly characterize the rock mass damage. The potential of using seismic data for rock mechanical back-analysis was also explicitly recognized by Mendecki, Lynch, and Malovichko (2010).
The current study comprises a micro-seismic event database from the Kiirunavaara mine footwall which was filtered and analysed with respect to temporal and spatial distributions, as well as in the context of numerically calculated stress difference concentrations and displacements. A possible correlation between stress difference concentrations and seismic event clustering was earlier shown for the Creighton mine by Snelling, Godin, and McKinnon (2013), while Moss, Diachenko, and Townsend (2006) indicated an increase in seismicity near mobilized rock mass volumes in the Palabora mine pit slopes. The use of seismic data to track general rock mass damage is well documented and a variation of techniques for doing so can be found in a number of published studies (e.g. Cai, Kaiser, and Martin, 2001; Young et al., 2004; Lynch and Malovichko, 2006; Xu et al. 2014; Abdul-Wahed, Al Heib, and Senfaute, 2006; Liang et al., 2013; Ma et al., 2013).
The state of the rock mass at the Kiirunavaara mine, particularly in the footwall, has previously been investigated by Singh, Stephansson, and Herdocia (1993), Lupo (1996), Sjõberg (1999), Henry and Dahner-Lindquist (2000), Villegas and Nordlund (2008, 2013), and Svartsjaern (2015). However, none of these studies have incorporated the mine's seismic event data. The mine started recording seismic events on a larger scale in 2008, after previously installing a minor system in 2003 following a trial system in 2000 (Henry et al., 2001). Even though data was sparse, Henry et al. (2001) indicated the possibility of using a larger seismic system to track failure in the footwall rock mass. The study by Svartsjaern (2015) concentrated on rock mass response in the upper part of the footwall (0-600 m depth), while most of the seismic events have been located at depths greater than 600 m. The predominant mechanisms suggested by Henry et al. (2001) and Svartsjaern (2015) are closely related to the theory of rock mass softening through seismic events. Part of the seismic event database for the mine was therefore extracted for this study in an attempt to relate it to the footwall rock mass response described by Svartsjaern (2015) and ultimately connect it to plausible large-scale fracturing in this region. This is done by studying the location of seismic shear events with magnitudes above a reliable minimum magnitude cut-off.
The Kiirunavaara mine
The LKAB (Luossavaara-Kiirunavaara Aktiebolag) Kiirunavaara mine's orebody dips approximately 60 degrees to the east. The mine's infrastructure is located inside the footwall rock mass, as are the majority of the geophones constituting the current seismic monitoring system. Ore is currently extracted through sublevel caving (SLC) after transitioning from an open pit in the 1950s. The current main haulage level is located on level 1365 m, which corresponds to an actual depth below the ground surface of roughly 1100 m. The main orebody is mined from blocks designated with lead digits of 16 to 45, which correspond to Y-coordinates of 1600 to 4500 m. Mining of these blocks is currently performed between the (Z) levels 993 and 1051 m. For modelling purposes a mine section within the middle two-thirds of the strike length is commonly approximated as a 2D plane strain profile as seen in the north-south direction.
Underground mine seismic system
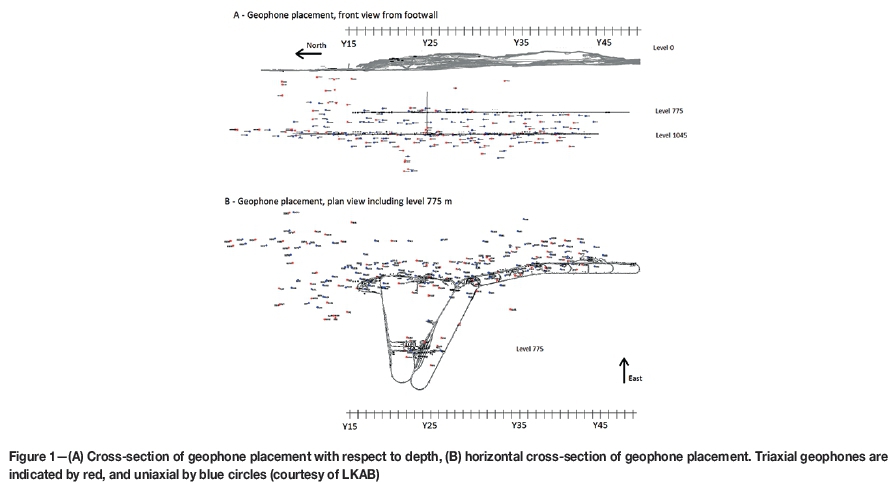
The primary objective of the seismic system is to track events that might be related to rockfalls and rockbursts in active production areas to gain insight into the mine seismicity. This has resulted in the bulk of the geophones being installed in close proximity to the mining areas, with fewer geophones in the upper 600 m of the rock mass. The arrangement of geophones with respect to depth is shown in Figure 1.
The first set of geophones at Kiirunavaara was installed as a small test set-up in 2000 in an attempt to confirm field observations of footwall rock mass movements in the upper footwall and near the production level (Henry et al., 2001). The data retrieved from this system was limited and the principles differed from subsequent systems as a transition was made from macro-seismic to micro-seismic sensors. Installation of the current (micro-seismic) system began in 2003. Since then, the number of geophones has been increased on a regular basis. A second large installation was performed in 2008 due to increased seismic risks, which made the system coverage mine-wide (relative to the production areas); the system was later significantly extended during 2012 and 2013. The current seismic system includes more than 210 geophones by which the mine strives to achieve a location accuracy of less than 20 m for -1.5 local magnitude events (Stõckel, Mäkitaavola, Sjõberg, 2013). Because of the different installation periods, the seismic data pre-dating 2008 was judged to be less reliable as it was recorded by much fewer devices. Data acquired from the earliest arrays (installed in 2000) was collected using only a few geophones and different principles. Consequently, co-analysis of old and new data is discouraged. Only data collected after 14 November 2008 was included in the current study.
Footwall rock mass deformation
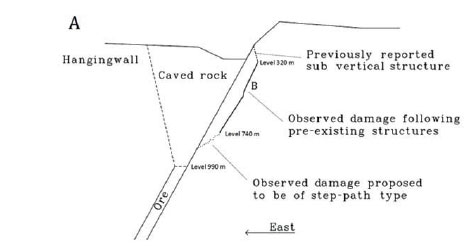
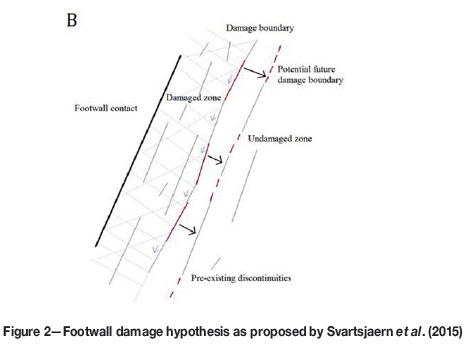
The main footwall host rock is Precambrian-aged trachyandesite with UCS ranging from 140-300 MPa and RMR values in the range of 49-68 (Sandström, 2003). Despite the rock being relatively competent, damage on the decommissioned open pit footwall crest, as well as within the footwall rock mass, has been observed since the late 1980s. The current state of this large-scale damage pattern is described in Svartsjaern et al., (2015), where it is proposed that the mappable damage in the footwall involves three stages as visualized in Figure 2A:
► Rock mass weaknesses formed near the production level are activated, resulting in mappable damage. The degree of visual damage and extent of the damaged volume depend on the confinement, resulting in a step-path-like extent boundary that travels outwards relative to the footwall contact with decreasing confinement
► Further up in the footwall, currently above level 740 m, the reduction in confinement has reached a magnitude which allows the damage extent boundary to reach the outer edge of the mining-induced rock mass weaknesses. Deformation in the de-stressed rock mass below level 740 m facilitates slip of natural ore-parallel structures on overlying levels, which results in fallouts related to these structures. The mappable damage in this fallout zone is caused mainly by activation of zones of weakness formed earlier within 'the damaged zone' and damage associated with structure contacts. Fresh fracture propagation is limited and the damage extent boundary moves away from the footwall contact by stepping from one structure group to the next (Figure 2B). The shear movement in these structure groups is observable up to around level 300 m, where the displacement seems to be absorbed by subvertical structures that daylight at the open pit footwall slope face (Figure 2A).
Seismic data
Data-set
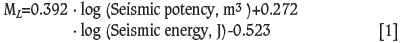
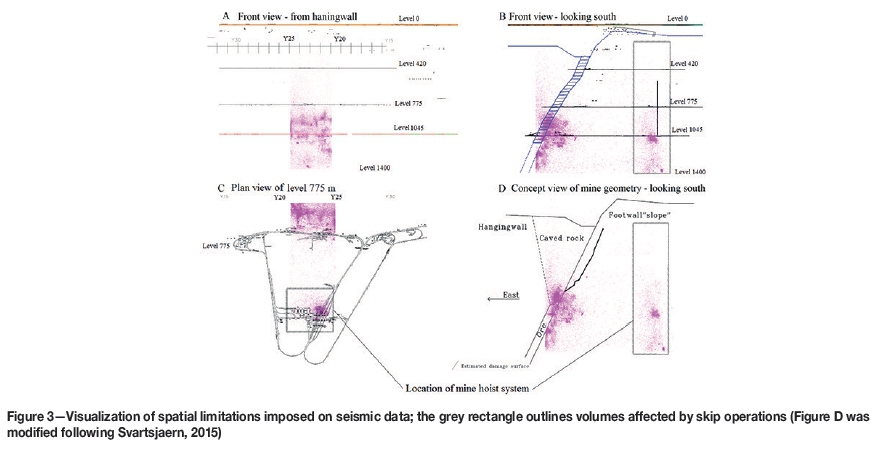
Due to the large quantity of seismic recordings collected throughout the mine, a limited volume was selected for detailed analysis. As it was opted to connect the study of the seismic data to on-site failure observations, the mine profile Y23 (refer to Figure 3) was chosen as the centre line of the studied block, which also coincides with the location of the central infrastructure. The mine infrastructure is relatively dense at these coordinates, which allows access to the rock mass on several levels. Seismic data was extracted for a polygonal volume incorporating the footwall and footwall/ore contact (including part of the hangingwall) covering depths between level zero (initial ground surface before mining) and the mine level 1400 m. The width was set to 400 m centred on the profile Y23, resulting in a 200 m data collection zone on the north and south sides of the model profile. With the imposed limitation, the data constituted 35 119 localized events with local magnitudes, according to Equation [1], of between -2.8 and 1.7 for the period 14 November 2008 to 13 February 2014.
As can be noted from Figure 3, two distinct areas of seismic activity are apparent; one near the production and footwall-ore contact and the other, shown as a vertical column, far into the footwall. The location of the far field column corresponds to the location of the mine skip shafts. Due to the likelihood of the far field data being generated by skip operations and not mining-induced seismic events it was decided to further spatially constrain the data by excluding the column location from the sets. The remaining events are referred to as 'the full catalogue' to differentiate between the entire studied volume and any data subsets within the sample. There are no orepasses located within the studied volume.
The source parameters of the seismic events were calculated by the Institute of Mine Seismology (IMS) based on the seismic records and accessed in a standardized text format supplied by LKAB. Production and development blasts were filtered from the data by IMS. Subsequent filtering and event analysis was performed using the IMS software Vantage (IMS, 2014).
Estimating the magnitude completeness and minimum magnitude cut-off
Larger magnitude events are more likely to be detected by a seismic system than small events due to the system sensitivity and wave attenuation. Thus for each seismic catalogue there is a limiting magnitude below which events might have occurred in the monitored area without being recorded. This limiting magnitude is called the minimum magnitude cut-off or critical magnitude (Mc or M0). Mc is defined as the magnitude at which the slope of a cumulative Gutenberg-Richter graph (Gutenberg and Richter, 1949) first deviates from linearity. The slope at any M in the cumulative Gutenberg-Richter graph is defined by the Gutenberg-Richter power law, log N(M > Mc) = a - bM, where a and b are seismic parameters and the slope is ultimately given by b. Naylor, Orfanogiannaki, and Harte (2010) describe procedures to identify Mc by studying the variation in b for different choices of M = Mc following the assumption that b will exhibit an incremental increase while stepping through the cumulative Gutenberg-Richter graph for M<Mc and stabilizing for M>Mc.
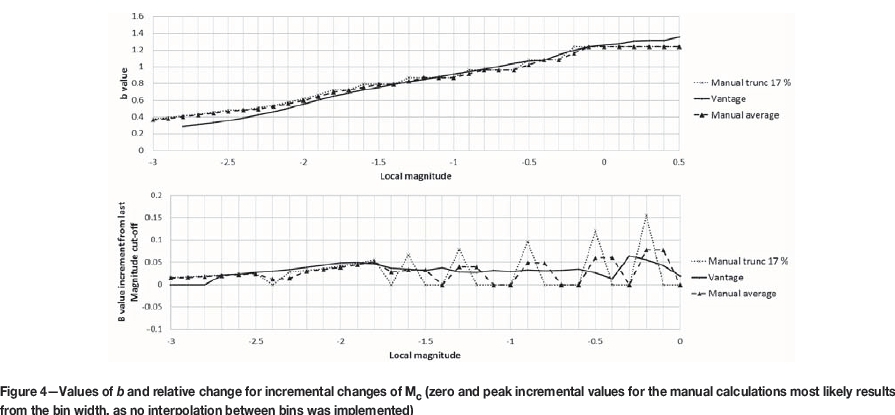
Following the recommendations by Naylor, Orfanogiannaki, and Harte (2010), b is estimated using the maximum likelihood technique where 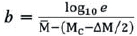 and MM is the mean magnitude in the examined set and AM equals the binning width (in this case 0.1). The values of b are calculated both for the full magnitude range M>Mc and a truncated set where the bins containing less than 17% of the events fulfilling M>Mc are ignored to minimize the influence from chance large-magnitude events. The calculated values of b are also compared to the automatically calculated b from Vantage for the same seismic catalogue. To further reduce ambiguity in the estimate of b the truncated values for b are also averaged over two adjacent bins to account for any large frequency changes between the bins. The values of b for incremental steps from low to high magnitudes are shown in Figure 4 together with the b value increment for each step.
Based on the assumption of b-value stabilization at M>Mc, the b increment diagram in Figure 4 indicates an initial change in behaviour to relative stability at about M = -1.7, where the increment changes from a steadily increasing rise to a relatively stable constant increase. Setting Mc = -1.7 and applying the Gutenberg-Richter power law with the corresponding values for b results in fitted lines that overshoot the log-linear portion of the cumulative graph in all cases (manual and Vantage calculations). In effect, the occurrence of larger magnitude events is not realistically represented. No plateau in the absolute b value vs. Mc can be found in Figure 4. Instead, b increases incrementally for the entire magnitude range M<0, only to show a stabilization of the magnitude increment.
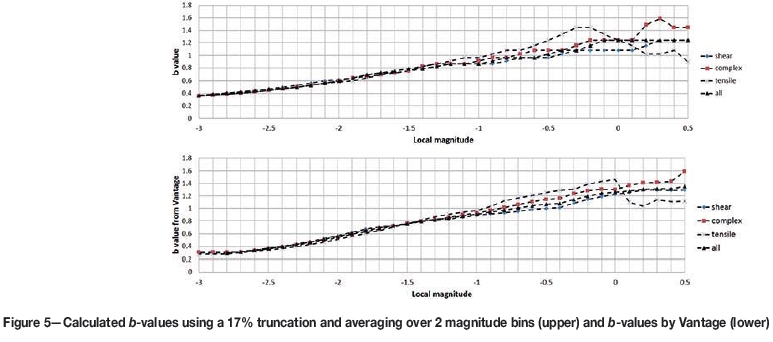
To investigate the possible influence of origin mechanisms on the b-value stability the data was filtered into three subsets; shear-slip component events with a Es/Ep ratio above 10 (Snelling, Godin, and McKinnon, 2013; Xu et al., 2014), complex events containing both shear-slip and tensile/volumetric components with Es/Ep ratios between 3 and 10, and tensile-component-only events with Es/Ep ratios less than 3 (Hudyma and Potvin, 2010; Xu et al., 2014). As evident in Figure 5, the calculated value for b does not differ significantly between the subsets for M < -1.0 and there is no arguable stabilization for any subset until Mc = 0. At Mc > -0.8 the different origin sets return clearly different b-values with a stable internal distance. At M = -1.0 the trend for the tensile events is to return a higher b-value for the same M than the other sets, followed by the complex set (less pronounced) containing both shear-slip and tensile components. This would be consistent with the indications by Hudyma (2008a) that events with tensile/volumetric origin will return higher b-values than shear-slip events. The trend is lost at M = 0. This is most likely due to the small number of tensile events in the remaining bins (68 out of 2513 total).
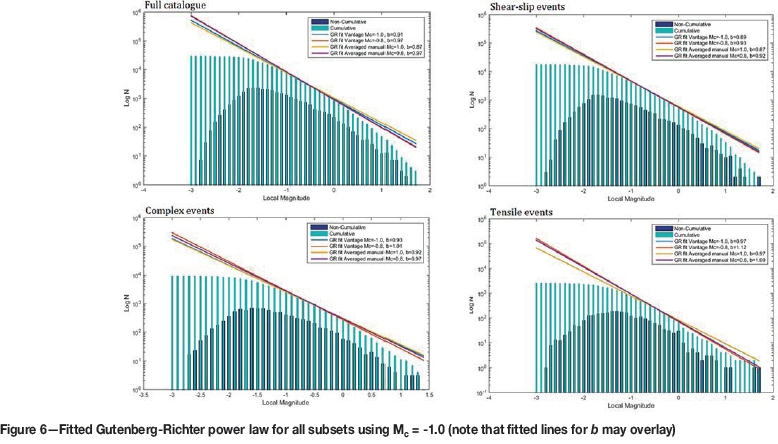
Two potential Mc values are studied further: M = -1.0 where the b-value for the different subsets start to diverge, and M = -0.8 where the differentiation between the b-values for the sets is significant and stable. The resulting fits for Mc = -1.0 and -0.8 are shown in Figure 6. As can be seen, the b-value adequately fits the log-linear portion of the cumulative graph, but there is still a tendency in all the subsets to over-represent the largest magnitudes.
In general, the calculated b-value fits well to the cumulative data plot. However, the representation is more weighted towards low-magnitude events, with some overrepresentation of higher magnitude events. The averaged truncated calculation, in which the bins containing less than 17% of the events with M < Mc were ignored, results in virtually the same magnitude values as those automatically returned from Vantage (Figure 4 for M > -2) and shows a good fit to the plotted data. As evident from Figure 5, the value of b becomes unstable at M > 0. This break in trend is almost certainly due to undersampling of the events, since a complete catalogue of the potential large-magnitude events in the studied area is unlikely to be adequately recorded during the relatively short data collection period (approx. 5 years).
As discussed earlier, the resulting b-values differ between the subsets based on the inferred origin mechanism. As shown in Figure 6, when sorted by ascending b-value (manual average) the subsets are ordered shear component (0.87/0.92), complex (0.92/0.97), and tensile (0.97/1.09) for Mc =-1.0 and -0.8 respectively. The corresponding b-values from Vantage calculated using the same Mc are for the shear events (0.89/0.93), complex events (0.93/1.01), and tensile events (0.97/1.12) respectively. These results are in line with the expected outcome given the findings of Hudyma (2008a) that sets of shear-slip events will produce lower b-values than sets of tensile/volumetric origin. The order of the subsets represented in Figure 6 is reasonable as the complex events with Es/Ep ratios between 3 and 10 are assumed to contain both shear-slip and tensile components, thus this subset should, with adequate sampling, result in a b-value lying between the shear and tensile sets. This would indicate that the Mc < -0.8 for this case leads to an undersampling of the catalogue as no additional information becomes evident at the higher cut-off, and that Mc = -1.0 is the best estimate for the minimum magnitude cut-off and represents the magnitude completeness. At Mc = -1.0 the subsets are represented by 4465 (shear), 2536 (complex), and 781 (tensile) events.
Location error
Location error is a semi-fictitious number based on the difference between measured and theoretical arrival times (based on the velocity model used) for an event multiplied by a scaling number that is unique for each geophone. A combination of the values from the geophones that registered the event is then used to estimate an error for the estimated event location (defining the size of the sphere in which the event is likely to be located). As such, the location error is not a true and absolute measurement in metres but rather indicates the relative size of the volume of the 'event location sphere'. In this study the location error is automatically calculated and given as an output by the mine's seismic system.
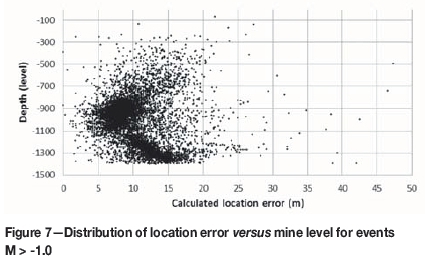
The layout of the seismic recording system at the Kiirunavaara mine results in low azimuthal coverage of events located above level 700 m and beneath level 1200 m. In Figure 7 the individual events with M > -1.0 are plotted with respect to the calculated location error and depth. Error locations larger than 50 m were removed from the plot for visualization purposes (12 events). To further illustrate the depth-location error relationship the events are sorted with respect to the mine level and shown in Figure 8 as box-plot distributions (based on standard deviations). The box plots are based on first and third quartiles, median values, and on error standard deviations. Very few events are located within a calculated location error larger than 15 m, which is lower than the 20 m indicated as the mine accuracy threshold (Stõckel, Mäkitaavola, and Sjõberg, 2013). About 50% of the events have a calculated location error of less than 10 m. As evident in Figure 8, the most well-located data is found around level 950 m, which corresponds to the relative centre of the mine seismic system. Beneath the system the relative location error again increases to magnitudes similar to those above the system as fewer wave paths are intersected. The few events recorded in the footwall above level 300 m (floor of the decommissioned open pit) are poorly located.
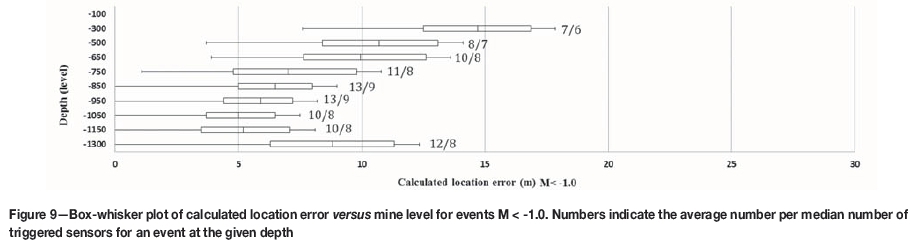
A comparison of the calculated location error for events above and below the estimated cut-off magnitude, Mc = -1.0, shows the need to accurately determine the minimum magnitude cut-off. The event subset below the cut-off magnitude, as indicated in Figure 9, is reported as better located than the event subset with M > Mc (compare with Figure 8). As the recording of low-magnitude events is more sensitive to distance attenuation it is not surprising that the M < Mc events are more concentrated at the system installation levels (700-1200 m), as short travel distance is a prerequisite for the wave energy to be recorded. This is also apparent when comparing Figure 8 and Figure 9 with respect to the average number of triggered sensors for each event with respect to depth. Even though the low-magnitude events are more abundant, each event is (on average) picked up by fewer sensors. The representation of the low-magnitude events in space therefore becomes skewed to potentially form artificial clusters close to the sensor positions. As shown in Figure 8 and Figure 9, an event of M > -1.0 at level 950 m is on average picked up by 51 (median 30) sensors, while an event at the same level with M < -1.0 is picked up by only 13 (median 9) sensors. For both subsets the number of triggered sensors is likely to rise with an increase in magnitude, and events close to M = -1.0 will have similar statistics for both subsets. The location accuracy calculated from residuals can thus not be used to decide which event locations to use for analysis in place of the magnitude completeness.
Analysis ofseismic parameters
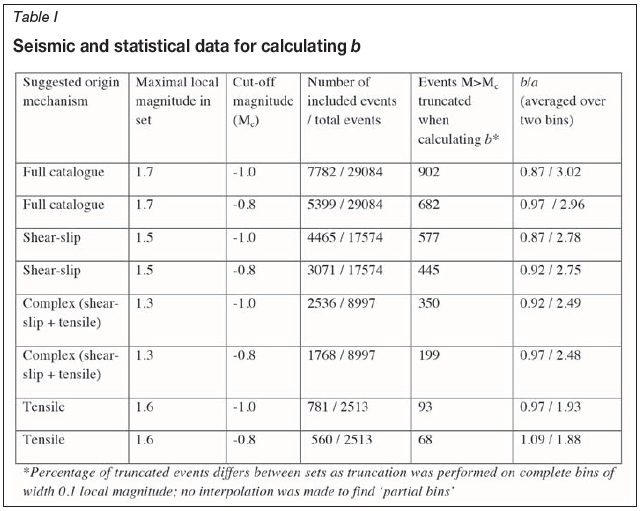
As previously indicated, the events where the Es/Ep ratio suggests a shear-slip origin vastly outnumber the events where the Es/Ep ratio suggests a pure tensile origin. Taking into account the number of total events with M > -1.0, the predominant failure mechanism in the studied area could be argued to be shear failure as events, with indicated shear-slip origin corresponding to 57% (4465 out of 7782), complex origin 33% (2536 out of 7782), and tensile origin 10% (781 out of 7782) of the recorded events. It should be noted that the relative distribution might be influenced by the sensitivity of the seismic system, as shear origin events in general tend to be of larger magnitudes than tensile origin events. However, performing this simple origin analysis, based on the Es/Ep ratio only, on the full set of events without application of the lower minimum magnitude cut-off at -1.0 local magnitude did not affect the relative distribution between the sets by more than a few units of percentage. Without the minimum magnitude cut-off, events with indicated shear-slip origin correspond to 60% (17574 out of 29084), complex origin 31% (8997 out of 29084), and tensile origin 9% (2513 out of 29084) of the entire catalogue.
The calculated values for the seismic Gutenberg-Richter parameters (b and a) are presented for the estimated cut-off magnitudes in Table I. As can be noted, the b-value changes when a larger minimum magnitude cut-off is applied for the sets. This behaviour was explicitly shown also in Figure 6. The b-values calculated for Mc = -1.0 fit reasonably well to both large- and medium-to small-magnitude events but overestimate the occurrence of the largest events. The reason is that the 'linear' of the log cumulative graph of the studied catalogue is in fact not linear as assumed by the power law, which is most evident for the well-populated sets. This could be caused by either the b-value changing in time or by the analysed catalogue containing two or more 'seismic areas' with different parameters.
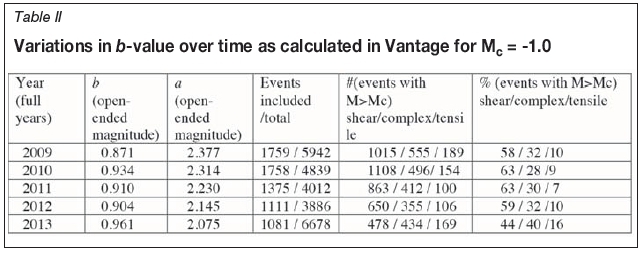
In Table II, the b- and corresponding a-values were calculated for the full catalogue with Mc = -1.0. With the applied Mc the b-value remains stable over the years 20102012 (note: only data for full years was studied). The seismic activity, indicated by a, however, decreases steadily from 2009 to 2013. The same trend can also be seen in the (total) number of events registered for each year as the numbers reduce from 2009 (with the most events) to 2012 (with the fewest events) followed by an apparent increase in events again in 2013. Note that it is the total number of events recorded that is on the rise, not the number of registered events with M > Mc. It is also indicated that the ratio of event origin type (given by the Es/Ep ratio) remains similar for 2009-2012, while the ratio between indicated shear and complex event origins significantly changed during 2013. It is likely that this is the result of the geophone installation campaign conducted during 2012 and 2013, with the new system fully operational in late 2013.
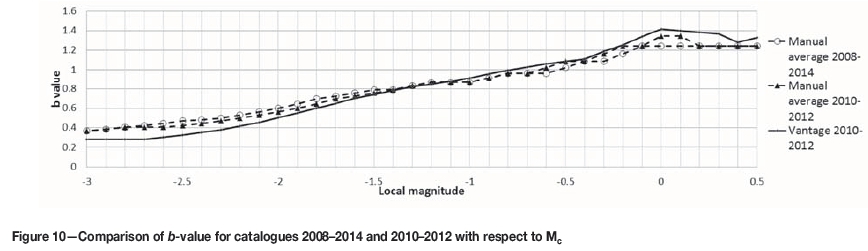
To investigate the influence of the 'extreme' years on the b-value the years 2009 and 2013 (refer to Table II) were filtered from the catalogue and the b-value was re-calculated. As shown in Figure 10, this action has no discernible effect on the calculated b-value with respect to Mc. The manually calculated b-value averaged over two bins stabilizes around M = -0.2 to 0, aligning with the Vantage calculation at -1.7 < M > -0.2 (deviation between returned values for the two calculation procedures is overall insignificant). The Vantage calculation again shows a stabilizing trend after M = -0.2. This is an indication that the convex decline of the cumulative log plot in the Gutenberg-Richter graph is not caused by variations of b-value in time, and that even though the seismic activity in the area studied is seemingly reducing, the magnitude distribution remains stable.
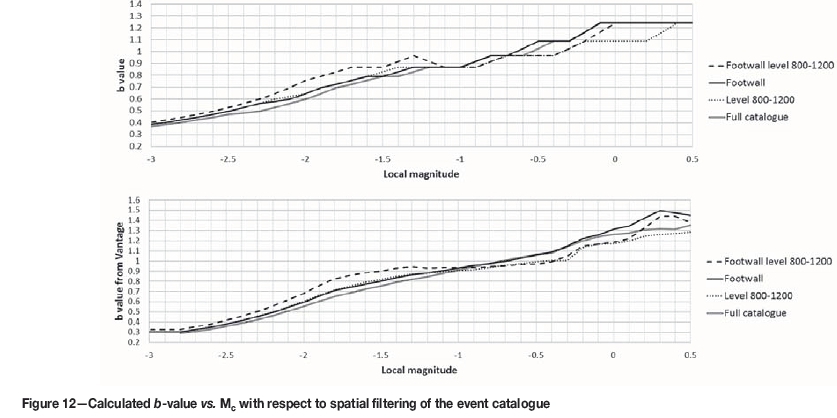
In an attempt to identify any spatial variations in the b-value, the event catalogue without any magnitude restriction (Figure 11A) was filtered to include only specific regions in the studied volume. The regions studied were the depth intervals with small calculated location errors (Figure 11B, inside the seismic system boundaries), level 800-1200 m (see Figure 8), and events located in the footwall (Figure 11C, defined using the general orebody dip). Both spatial limits contain a majority of the catalogue but the data that is likely to have different properties has been omitted. In Figure 11B the events located outside the system, i.e., the far field data, has been removed, while in Figure 11C the events originating in the caving hangingwall and flowing cave rock were excluded. In all cases (Figures 11A-D) the sharp line on the left indicates the boundary of the studied catalogue. As evident in Figure 12, on the b-value stability there is an apparent pivot point at M = -1.0, around which the filtered data seems to rotate compared to the unfiltered catalogue. For both spatial filters the difference with respect to the unfiltered catalogue at M < -1.0 is notable as both sets return nearly identical b-values which are both slightly higher than for the full catalogue. At M > -1.0 the 'footwall' filter (Figure 11C) does not seem to have any effect as the returned b is virtually identical to that of the full catalogue. However there is a noticeable effect from the depth filter (Figure 11B) as the corresponding b -alue does not increase as fast as for the full catalogue and for the 'footwall' filter. In fact, the increase in b value for the depth filter groups is negligible between M = -1.0 and -0.3. Combining both filters, i.e. evaluating only events located in the footwall and between levels 800 and 1200 m (Figure 11D) returns a b-value that is arguable stable between M = -1.7 and -0.4, whereafter it becomes unstable again, likely due to undersampling. The fitted power-law and the events from the combined filters are shown in Figure 13; the deviation from linearity due to undersampling shows as a 'drop' at M = 0.5.
The convex shape of the cumulative Gutenberg-Richter graph for the full event catalogue is concluded to be system-induced. By eliminating the events located outside the seismic array the convexity of the graph is eliminated and the remaining set fits the log-linear power law. The spatial filtering allowed for 13 608 out of 29 084 events to be analysed as one set with stable seismic parameters. The indicated Mc for the spatially filtered set is -1.7, while for the full set the b-value stability indicates Mc = -1.0. The significant difference is unsurprising given the apparent sensitivity of the calculated b-value with respect to the system spatial proximity. The b-values calculated for the spatially filtered set, 0.87-0.93, are in fair agreement with the b-values calculated for the full catalogue when considering also the event origin, i.e. Mc = -1.0, 0.87-0.91. The origin distribution within the double set is similar to the full catalogue with shear-slip, complex, and tensile events making up 68%, 26%, and 6% of the events with M > -1.0 respectively. Evaluating the b-value for each set at Mc = -1.0 returns (from Vantage) 0.94, 0.92, and 0.88 for shear, complex, and tensile events. As for the full catalogue, this is argued to be unreasonable due to the different origins.
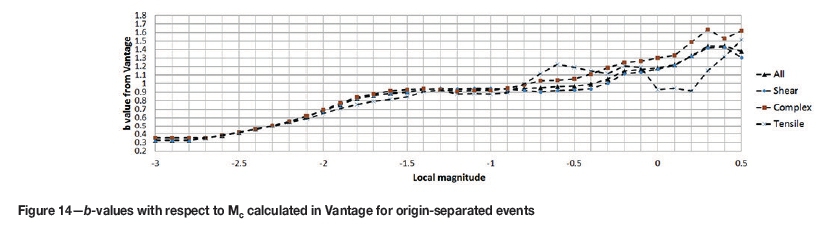
As shown in Figure 14, the calculated b-values (for the double-filtered set with respect to the different event origins) do not start to differentiate significantly until Mc = -0.8, just as for the full catalogue (see Figure 5). Calculating for Mc = -0.8 again returns b = 0.92-0.94 for the full set, while the components from the different origins are sorted as; 0.870.92 (manual-Vantage), 0.97-0.99, and 1.00-1.02 for shear, complex, and tensile events respectively, with tensile events returning a higher value than shear-slip events as expected. The change in Mc from -1.0 to -0.8 has no significant effect on the origin distribution. The distribution of the origin mechanisms for the double-filtered set shows the same trend as the full catalogue (based on Es/Ep ratio), both showing a predominance of shear-slip component events.
The calculated value for the full catalogue based on the b- value stability alone was in this study subjective as the Gutenberg-Richter graph was convex. The convexity is shown to be system-dependent as different b-values are returned for the events located inside the confines of the seismic system than for the events located outside. The events located inside the systems fit well to the log-linear assumption of the Gutenberg-Richter power law as the graph shows negligible convexity. The b-value is common for all sets at a minimum magnitude cut-off of -1.0, which also results in fitted log-linear parameters that adequately represent the events located inside the system for events with M > -2.0. Identifying the magnitude at which the individual origin sets (shear, complex, and tensile events) can be separated by studying the individual b-values also suggests the magnitude completeness at M = -1.0. At M < -1.0 the different origin sets cannot be positively distinguished from each other, regardless of whether the studied volume contains the full catalogue or only the inside system events are studied. At M > -1.0 the events are sorted in ascending order of tensile, complex, and shear events by the returned b-value, as expected from literature experience. Moving the cutoff further to Mc = -0.8 does not reveal any additional seismic information but indicates the same trends as shown already at Mc = -1.0 for both the full catalogue and the subsets. The use of b-value differentiation based on origin mechanisms to identify the magnitude completeness thus seems to eliminate some of the system location dependency indicated for the b-value stability approach.
Analysis of event locations
The event catalogue was filtered with respect to a cut-off magnitude of -1.0 local magnitude. Events of lower magnitude were not incorporated as the non-differential b-values for M < -1.0 indicate that the events with lower magnitudes are not accurately represented in the studied catalogue. The event locations are analysed with respect to the footwall damage hypothesis proposed by Svartsjaern et al. (2015).
In Figure 15 the tensile event locations are coloured with respect to the main active production level at the time the event was recorded. Also shown in the figure is the simplified geometry of the mine at profile Y23, finalized production levels, and the conceptual boundary of the mappable damage to the infrastructure by Svartsjaern et al. (2015). The event locations show a significant scatter with little or no clustering above level 1200 m. Most of the events occur far below the production area and thus remote from the boundary of the systematically mappable damage. The far field scatter indicates general large-scale stress redistribution from the mining but no significant direct reaction to the excavation of each respective level. It is not possible to trace the outlines of the damage extent boundary from the tensile event locations. This result is in line with the proposed damage hypothesis, where mappable failure above the production level is proposed to be caused primarily by activation of previously formed zones of weakness, not by fresh fracture propagation.
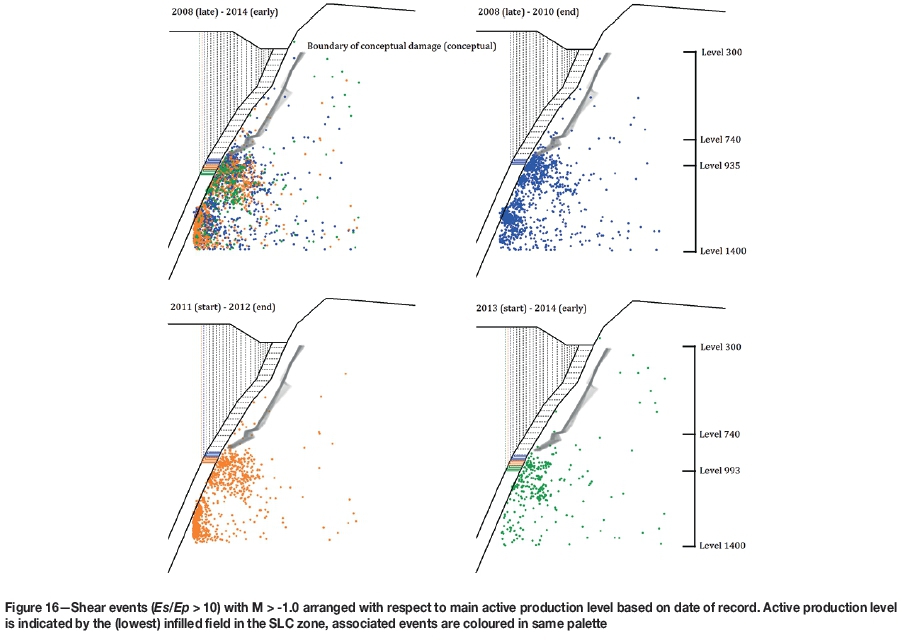
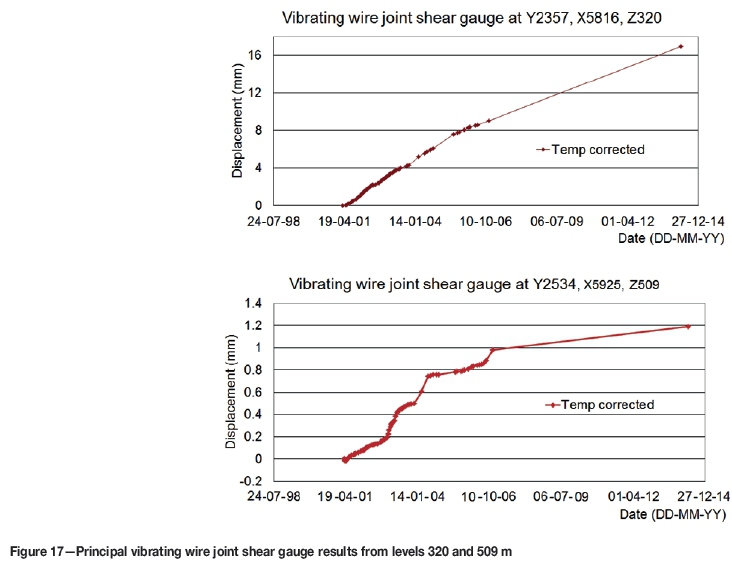
Plotting only the shear events shows clear clustering; firstly near the active production level and secondly close to the footwall contact at level 1200-1400 m (Figure 16). There is no correlation between the shear event locations and the postulated shearing structure groups in the upper footwall, i.e., above level 740 m. A likely reason would be that the structures are slipping continuously without any significant strain accumulation. Any energy released from continuous shearing along the natural structures in this area is then attenuated before being registered by the seismic system. The assumption of continuous slip is supported by a handful of vibrating wire joint shear gauges installed over individual joints in the upper footwall. The gauges indicate continuous subvertical shear of individual joints in the order of a few millimetres to fractions of a millimetre per year. Principal readings are shown in Figure 17.
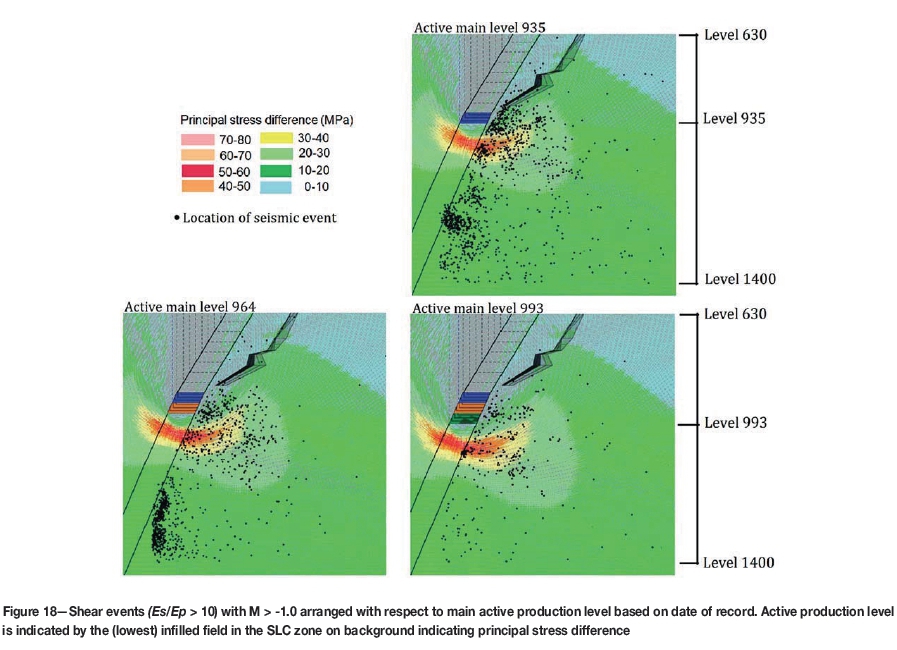
The upper 'shear cluster' surrounds the production area shown in the footwall as a 'half cylinder' with the long axis parallel to the orebody strike. The cluster centre position moves downwards with the mining and shows increased scatter with increasing distance from the footwall contact. The stress difference within the cluster volume is relatively high as it coincides with the footwall 'slope toe'. Large differential stresses are indicated at one to two sublevels below the main mining level, together with a de-stressing zone above the mining level (Figure 18). Several events are located outside the high stress difference zone, but apart from the second clustering at levels 1200-1400 these events show large scatter. The stress difference plots, which were produced from the UDEC (Itasca, 2011) model designed by Svartsjaern et al. (2015), give a simplified but robust picture of the stress redistribution during mining.
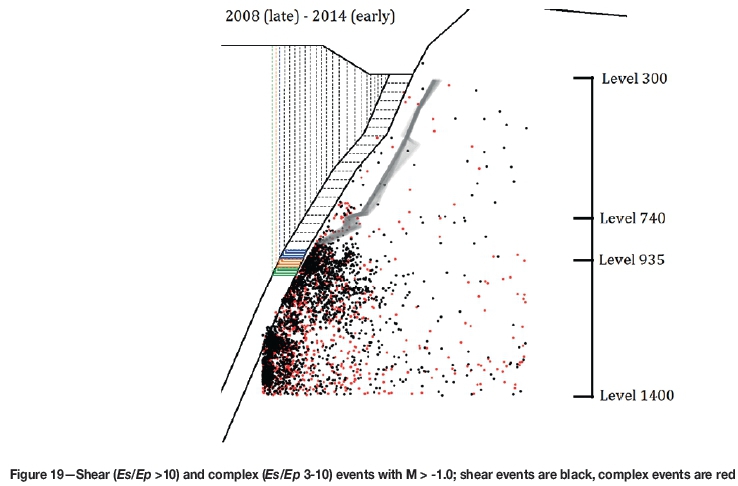
The clustering of shear events near the production level, together with the deviatory stress plots, indicates a region of active fracturing at the footwall 'slope toe'. This supports the failure theory where mappable damage in the upper part of the footwall is postulated to be a symptom of a confinement-dependent response to rock mass damage formed earlier close to the production level. The event origin based on Es/Ep ratios suggests that the rock mass response to the stress redistribution is shear-dominated, since events with only shear-slip component follow the same pattern as events containing both shear-slip and tensile components (see Figure 19), while events with pure tensile components show significant scatter with no apparent clustering (Figure 15).
The numerical model does not explain the origin of the lower cluster. The apparent 'disappearance' of the cluster for the mining step 964^993 is caused by the imposed spatial limit on the studied seismic catalogue as the cluster simply 'migrates' out of the studied volume. The origin and migration path of this cluster warrants further study, but possible explanations include footwall-ore contact interactions, development work connected to level 1365 (new haulage level commissioned in part during 2013), or possible activation of seismically significant structures.
Discussion
The analysed seismic event locations do not form explicit bridging patterns that could be directly linked to observed damage. Even so, the concentrations of seismic event locations close to the mining level could be considered in the context of seismic softening of the rock mass as described for the Creighton mine by Snelling, Godin, and McKinnon (2013). Seismic softening was earlier indicated for the Kiirunavaara mine by Henry et al. (2001) and a general reduction in rock mass integrity below the excavation level was anticipated by Svartsjaern (2015). The earlier damaged rock mass (Svartsjaern, 2015) is postulated to mobilize as the mining front passes the studied level due to loss of horizontal confinement resulting from replacing relatively stiff ore with low-stiffness cave rock from the hangingwall.
Stress analyses show that clustering of seismic events could indicate areas of high differential stresses. The formation of the deep-seated seismic cluster cannot be explained by the continuum numerical model utilized. It is, however, considered likely, based on the spatial location, that the cluster is related to some type of footwall-orebody interaction. Characteristic seismic sources related to formation of event clusters are described by Hudyma (2008b), including the activation of faults or similar brittle structures. Sandström (2003) describes the footwall-ore contact as containing a higher concentration of skarns and breccia and showing a lower RMR than the footwall in general. There is a potential for this contact zone to show a similar seismic response as a brittle fault with concentrated event localization. Some indications in this direction can be found in Henry et al. (2001), where the interpreted far field seismicity is proposed to originate from slip parallel to the orebody. Conclusive evidence of the influence of a footwall-ore contact fault-like zone is, however, currently not available. The fact that the indicated location of the deep-seated cluster (beneath level 1200 m) is well below the boundary of the seismic system, which reduces the location accuracy and entails a possible bias in event localization, should also be taken into account. Further analysis of the lower cluster, such as possible correlations with development drifting below the excavation level, was beyond the scope of this paper. This limitation was imposed for two major reasons; (i) the cluster was indicated at the spatial boundary of the data and it could not be tracked in full, and (ii) the cluster was indicated in a volume of low azimuthal coverage.
The tensile origin events recorded in the studied area indicate the occurrence of brittle failure in the form of fracture propagation through intact rock. The tensile events constituted only a minor portion of the event cloud and were scattered throughout a relatively large area. The location scatter indicates that brittle failure is not well confined to certain regions but is a sign of general stress changes in the footwall rock mass. Tendencies could be discerned for some clustering of tensile events at the intersection between the conceptual damage extent boundary proposed by Svartsjaern (2015) and the SLC area, but the low number of events makes the correlation uncertain. Instead, the direction of the major virgin principal stress (perpendicular to the orebody) entails significant stress-redistribution in the footwall from the mining advance (Sandström, 2003). Thus, brittle failures throughout the footwall rock mass with wide scattered tensile event locations would be expected.
The non-tensile origin events were analysed with respect to numerically calculated displacements. The results indicate that clustering of seismic events in a volume changes from heavily confined (high differential stress) to de-stressing, which suggests inhomogeneous movement and dilatation. The relationship between mobilized wall regions and concentrations of seismicity was indicated for the Palabora open pit by Moss, Diachenko, and Townsend (2006). Rock mass movements resulting in the observed damage in the upper parts of the footwall could not be clearly traced by the analysed seismic data. The baseline for tracking rock mass failure using seismic recordings is that fracture growth and slip is accompanied by distinct micro-seismicity which can be picked up by the seismic arrays. Intrinsic to this approach is that slip along a plane is discontinuous over time. Elastic strain energy accumulates over a slip surface until the surface yields and shears, accompanied by the release of energy in form of micro-seismicity. However, if the slip is constant and continuous over time then very small amounts of elastic strain energy will accumulate. The energy released from small elastic strain buildups will also be inherently small and likely to fall below the recording threshold of the seismic arrays. The few available measurements of individual shearing structures on levels 320 and 509 m indicate continuous shear displacements in the order of a few millimetres to fractions of a millimetre per year. In addition, owing to the relatively large distance from the seismic system, near the production level, to the upper part of the footwall, the low-magnitude micro-seismicity that would be generated by the described process will attenuate before reaching the system.
The separation of event origins in terms of shear, shear-component, and tensile events based only on Es/Ep ratio does impose some limitations compared to a more in-depth analysis of origin parameters. The indicated thresholds used to differentiate between event origins should be considered as conceptual and some overlap between the groups with respect to the true origin is likely.
Conclusions
Seismic data was extracted for the central portion of the mine and analysed with respect to event origin determined using Es/Ep ratios and b-values from Gutenberg-Richter graphs. The analyses indicate that the majority of the events originate from shear-slip-type failures. The predominance of shear-slip events below the main excavation level agrees with the arguments presented by Svartsjaern (2015) that a confinement-dependent large-scale damage extent boundary is actively developing between level 740 m and the current main excavation level. However, it should be noted that the purpose of this study was not to predict where seismic events are likely to occur. Rather, the purpose was to use the recorded seismicity to track regions of active fracturing and failure in the footwall rock mass by clustering of seismic events. Hence, seismic records have been analysed in relation to the spatial and temporal patterns as well as to numerically calculated stresses. The following are the major findings of this study.
► By separating the seismic catalogue based on the event origins into shear, complex, and tensile events a representative b-value indicating the magnitude completeness can be identified for a convex Gutenberg-Richter graph by finding the minimum magnitude cutoff at which the b-values differ between the sets
► Clustering of shear events near the production level together with the differential stress plots indicates a region of active fracturing at the footwall 'slope toe'
► A predominance of seismic events with Es/Ep ratios above 10 observed below level 700 m indicate that the main failure mode of the rock mass below this level is shear-dominated. The second largest group of events contains both shear-slip and volumetric failure components (complex set)
► Continuous sliding along the discontinuities in the upper part of the footwall, where mappable damage has been documented, has so far not resulted in micro-seismicity with magnitudes large enough to be recorded by the seismic system
► The analyses have not revealed a direct correlation between seismic location data and observed damage resulting from large-scale deformations. It is, however, postulated that the seismic events lead to a softening of the rock mass, which in turn allows increased rock mass deformation on the upper levels in response to decreasing confinement.
Acknowledgements
The authors acknowledge the funding and data access granted for this study by LKAB. Thanks are also due to Centre of Mining and Metallurgy (CAMM) at Luleâ University of Technology (LTU). The on-site contributions during data collection by the LKAB staff, in particular Karola Mäkitaavola and Mirjana Boskovic, are greatly appreciated. Finally, the authors wish to thank Adjunct Professor Jonny Sjõberg (Itasca Consultants AB), Professor Savka Dineva (LTU), as well as Associate Professor David Saiang (LTU) for valuable comments related to this paper.
References
Abdul-Wahed, M.K., Al Heib, M.A., and Senfaute, G. (2006. Mining-induced seismicity: Seismic measurement using multiplet approach and numerical modeling. International Journal of Coal Geology, vol. 66. pp. 137-147. [ Links ]
Agliardi, F., Crosta, G.B., Meloni, F., Valle, C., and Rivolta, C. 2013. Structurally-controlled instability, damage and slope failure in a porphyry rock mass. Tectonophysics, vol. 605. pp. 34-47. [ Links ]
Cai, M., Kaiser, P.K., and Martin, C.D. 2001. Quantification of rock mass damage in underground excavations from microseismic event monitoring. International Journal of Rock Mechanics and Mining Sciences, vol. 38. pp.1135-1145. [ Links ]
Cesca, S., Sen, T.A., and Dahm, T. 2014. Seismicity monitoring by cluster analysis of moment tensors. Geophysical Journal International, vol. 196. pp. 1813-1826. [ Links ]
Gutenberg, B. and Richter, C.F. 1949. Seismicity of the Earth. Princeton University Press, Princeton, NJ. [ Links ]
Henry, E. and Dahner-Lindqvist, C. 2000. Footwall stability at the LKAB's Kiruna sublevel caving operation, Sweden. Proceedings of Massmin 2000, Brisbane, Queensland, Australia. Australasian Institute of Mining and Metallurgy, Melbourne. pp. 527-532. [ Links ]
Henry, E., Plouffe, M., Côté, M., and Sandström, D. 2001. Rock mass response to mining induced over-stresses in a sublevel caving operation case study at the Kiruna mine, Sweden. Proceedings of MineSpace2001, Quebec City, Canada. CIM, Montreal. [ Links ]
Hudyma, M. 2008a. Appendix A: Mine seismology concepts. Generic Seismic Risk Management Plan for Underground Hardrock Mines. Australian Centre for Geomechanics, Nedlands, WA. [ Links ]
Hudyma, M. 2008b. Analysis and Interpretation of clusters of seismic events in mines. Doctoral thesis, University of Western Australia. [ Links ]
Hudyma, M., and Potvin, Y.H. 2010. An engineering approach to seismic risk management in hardrock mines. Rock Mechanics and Rock Engineering, vol. 43. pp. 891-906. [ Links ]
IMS. 2014. Vantage. Institute of Mine Seismology. [ Links ]
Liang, Z., Xu, N., Ma, K., Tang, S., and Tang, C. 2013. Microseismic monitoring and numerical simulation of rock slope failure. International Journal of Distributed Sensor Networks, vol. 2013, no. 5. http://journals.sagepub.com/doi/pdf/10.1155/2013/845191 [ Links ]
Lupo, J.F. 1996. Evaluation of deformations resulting from mass mining of an inclined orebody. Doctoral thesis, Colorado School of Mines. [ Links ]
Lynch, R.A., and Malovichko, D.A. 2006. Seismology and slope stability in open pit mines. Proceedings of the International Symposium on Stability of Rock Slopes in Open Pit Mining and Civil Engineering. South African Institute of Mining and Metallurgy, Johannesburg. pp. 375-390. [ Links ]
Ma, K., Tang, C-A., Xu, N-W., Liu, F., and Xu, J-W. 2013. Failure precursor of surrounding rock mass around cross tunnel in high-steep rock slope. Journal of Central South University, vol. 20. pp. 207-217. [ Links ]
McKinnon, S.D. 2006. Triggering of seismicity remote from active mining excavations. Rock Mechanics and Rock Engineering, vol. 39, no. 3. pp. 255-279. [ Links ]
Mendecki, A.J., Lynch, A.R., and Malovichko, D.A. 2010. Routine micro-seismic monitoring in mines. Proceedings of the Australian Earthquake Engineering Society 2010 Conference, Perth, Western Australia. pp. 33. [ Links ]
Moss, A., Diachenko, S., and Townsend, P. 2006. Interaction between the block cave and the pit slopes at Palabora mine. Journal of the South African Institute of Mining and Metallurgy, vol. 106. pp. 479-484. [ Links ]
Naylor, M., Orfanogiannaki, K., and Harte, D. 2010. Exploratory data analysis: magnitude, space and time. Community Online Resource for Statistical Seismicity Analysis. doi: 10.5078/corssa-92330203 [ Links ]
Orlecka-Sikora, B., Lasocki, S., Lizurek, G., and Rudzinski, t. 2012. Response of seismic activity in mines to the stress changes due to mining induced strong seismic events. International Journal of Rock Mechanics and Mining Sciences., vol. 53. pp. 151-158. [ Links ]
Ortlepp, W.D. 2000. Observation of mining-induced faults in an intact rock mass at depth. International Journal of Rock Mechanics and Mining Sciences, vol. 37. pp. 423-436. [ Links ]
Richardson, E., and Jordan, T. H. 2002. Seismicity in deep gold mines of South Africa: implications for tectonic earthquakes. Bulletin of the Seismological Society of America, vol. 92, no. 5. pp. 1766-1782. [ Links ]
Sandström, D. 2003. Analysis of the virgin state of stress at the Kiirunavaara mine. Licentiate thesis, Luleá University of Technology. [ Links ]
Shen, B., Stephansson, O., Einstein, H.H., and Ghahrema, B. 1995. Coalescence of fractures under shear stresses in experiments. Journal of Geophysical Research, vol. 100. pp. 5975-5990. [ Links ]
Singh, U.K., Stephansson, O.J., and Herdocia, A. 1993. Simulation of progressive failure in hangingwall and footwall for mining with sub-level caving. Transactions of the Institution of Mining and Metallurgy, vol A102. pp. A188-A194. [ Links ]
Sjöberg, J. 1999. Analysis of large scale rock slopes. Doctoral thesis, Luleá University of Technology. [ Links ]
Snelling, P.E., Godin, L., and McKinnon, S.D. 2013. The role of geologic structure and stress in triggering remote seismicity in Creighton mine, Sudbury, Canada. International Journal of Rock Mechanics and Mining Sciences, vol 58, February 2013. pp. 166-179. [ Links ]
Stöckel, B-M., Mäkitaavola, K., and Sjöberg, J. 2013. Hangingwall and footwall slope stability issues in sublevel caving. Proceedings of Slope Stability 2013, Brisbane, Australia. Australian Centre for Geomechanics, Perth, WA. pp. 1045-1060. [ Links ]
Svartsjaern, M. 2015. Predominant failure mechanisms at the kiirunavaara mine footwall. Licentiate thesis, Luleá University of Technology. [ Links ]
Svartsjaern, M., Eitzenberger, A., Saiang, D., and Nordlund, E. 2015. Conceptual numerical modeling of large scale footwall behavior at the Kiirunavaara mine, and implications for deformation monitoring. Rock Mechanics and Rock Engineering. DOI: 10.1007/s00603-015-0750-x [ Links ]
Villegas, T., and Nordlund, E. 2008. Numerical simulation of the hangingwall subsidence using PFC2D. Massmin 2008: Proceedings of the 5th International Conference and Exhibition on Mass Mining. Luleá University of Technology. pp. 907-916. [ Links ]
Villegas, T., and Nordlund, E. 2013. Numerical analyses of the hangingwall failure due to sublevel caving: study case. International Journal of Mining and Mineral Engineering, vol. 4, no. 3. pp. 201-223. [ Links ]
Xu, N.W., Dai, F., Liang, Z.Z., Zhou, Z., Sha, C., and Tang, C.A. 2014. The dynamic evaluation of rock slope stability considering the effects of microseismic damage. Rock Mechanics and Rock Engineering, vol. 47. pp. 621-642. [ Links ]
Young, R.P., Collins, D.S., Reyes-Montes, J.M., and Baker, C. 2004. Quantification and interpretation of seismicity. International Journal of Rock Mechanics and Mining Sciences, vol. 41. pp. 1317-1327. [ Links ]
Paper received Jan. 2016
Revised paper received Aug. 2016

