


Services on Demand
Article
 English (pdf)
 Article in xml format
 Article references
Indicators

Related links
-
 Cited by Google
 -
 Similars in Google
Share

 Permalink
Journal of the Southern African Institute of Mining and Metallurgy
On-line version ISSN 2411-9717
Print version ISSN 2225-6253
J. S. Afr. Inst. Min. Metall. vol.117 n.6 Johannesburg Jun. 2017
http://dx.doi.org/10.17159/2411-9717/2017/v117n6a2
PAPERS OF GENERAL INTEREST
Activity-based risk management for the acquisition of electronic mine safety equipment
G.P.R. van der MerweI; J.E.W. HolmII; A.J. HofmannII
IJericho Systems Pty Ltd, South Africa
IINorth-West University, University in Potchefstroom, South Africa
SYNOPSIS
A new approach is proposed to perform relativistic comparisons between alternative operational risk management solutions by taking into account the impact of each operational activity on overall system performance. A specific case study, to which this new approach is applied, involves the deployment of safety systems in underground mining operations. Conflicting objectives to be satisfied are the minimization of risk to human lives and the minimization of production losses. As the focus in this case is primarily on the mitigation of risk, the approach that was applied is referred to as activity-based risk (ABR) analysis. Existing development process and risk management methods used in the South African mining environment were analysed by means of observations, a case study, technical documentation, and literature review. It was evident from this analysis that a discontinuity existed between the acquisition and operational phases in terms of the management of safety risk in the acquisition of electronic safety equipment when viewed from a full life-cycle perspective. This discontinuity could be addressed by defining a risk perspective in the system development phase by employing ABR in the preliminary design phase of a system's engineering life-cycle. The focus of the ABR system development process is to find the functional definition and configuration of safety equipment that addresses both safety and productivity when taking into account human performance variability. In doing so, a balance between productivity and safety is found in a relativistic sense.
Keywords: activity-based risk, risk, modelling, acquisition, electronic safety equipment.
Introduction
In any system life-cycle, two major phases exist, namely system acquisition and operation (including maintenance). A distinction is made between acquisition and procurement, where acquisition includes system development and integration as specific engineering activities. In the development phase of a new system, conceptual design, preliminary design, and detail design phases follow in this order to define a complete system, after which the system is put into production and implemented in an operational environment-these activities chronologically define system acquisition in the context of this paper. It is not uncommon that differences exist between the risk management perspective during acquisition of a system and risk management perspective during operation, where nontechnical aspects are often ignored during acquisition, but are then encountered and found to be problematic during operation (Leveson, 2012). These differences also exist in the mining industry.
This research was initiated when a discontinuity was observed between engineering (mainly responsible for acquisition) and mining operations dependent on electronic equipment for safe operations. It was thus necessary to investigate and reduce the magnitude of this discontinuity as it could lead to loss of human lives. The two cultures within these two sections of the same organization can never be fully harmonized, as an acquisition culture usually focuses on the management of projects with clear start and end dates, while an operations culture is essentially focused on the management of events that are cyclic in nature.
A generic framework for the assessment and management of risk, which we will call activity-based risk (ABR), was developed to provide an abstract view of equipment and its relation to operational risk with a distinctly pragmatic focus. The aim of the ABR acquisition process model is to assist risk analysts, engineers, and operations managers by providing a full life-cycle view of risk during acquisition when the most important system and operational design decisions must be made.
There are different ways to demonstrate the value of risk modelling. The ABR approach provides decision support information in the form of relativistic risk comparisons to enable well-informed trade-off studies. A relativistic approach allows the engineer to decide on functionality and resource definitions in the development phase (a function-focused approach), and allows the manager to understand the impact of resource selection (a resource-focused approach) on the risk of a system in operation.
ABR, as such, provides a view of risks associated with specific activities forming part of a larger operation, with the aim of defining an equipment configuration (including a 'function set') that is optimally designed to support specific operations. The end result of ABR analysis is an equipment functional configuration that has been optimized based on the analysis of its expected behaviour in actual operations, as opposed to a configuration that has been defined in disregard of its interaction with the operational domain.
The following sections define challenges of existing acquisition processes, provide a solution to these challenges in the form of an ABR process, and demonstrate by means of simulation the advantages of using ABR management.
Challenges of existing processes for acquisition of mine safety equipment
Shortfalls in existing acquisition processes were determined from an analysis of available literature, observations from practical projects, and a specific case study (van der Merwe, 2014)
► Product /system requirements: From observations it was found that, when acquiring new equipment for mines, the preliminary design phase that follows the concept phase was neglected in many instances due to project time constraints and limited project resource capability. The preliminary design phase should include system behavioural analysis, architectural design, requirements allocation, and system synthesis and evaluation. Omission of any of these steps will result in major problems during the subsequent development, deployment and operational phases
► Sub-optimal safety technology: Through observations, it was established that sub-optimal safety technology could be deployed in operations due to limited effort in the preliminary design phase. It was found that either end-products did not fully address the initial problem or that the end-product reduced productivity-that is, initial requirements had not been properly validated. When safety systems have a negative impact on production they often tend not to be accepted by end-users and are often vandalized or bypassed. The result is that more than one development iteration may be required to determine a suitable solution, with budget, time, resource, and legal implications
► Focus on hazard exposure and expert input: Traditionally, risk analyses relied heavily on hazard analyses without taking into account the complexities of safety systems (Leveson, 2012). This was supported by observations. The result is that hazards to humans are identified, but the effects of production and technology risk are not always fully evaluated with regard to functionality, usability, and reliability in complex systems. While hazard analyses remain critical and must be performed for all products and systems, form should follow function, and not the other way round. It would normally be assumed that the integrity of such a risk assessment result is determined by the experience of the risk assessment team. Thus, regardless the level of experience of the assessment team, the lack of a systems engineering (SE) approach to system safety can still lead to invalid or suboptimal results (Aven, 2009; Leveson, 2012)
► Impact of technology: Due to the lack of independent assessment, risk assessment quality varies between different safety equipment suppliers, since suppliers are sometimes required to perform assessments on their own equipment. This makes it very hard to identify a safety product or system with the lowest risk score as a uniform measurement standard is not used across assessments (Backlund and Hannu, 2002). The technology supplier is, in many cases, not aware of the exact operating conditions under which a product will operate and often does not take productivity into account
► Human integration: Observations showed that consideration of human performance variability was not evident in risk analysis processes as a particular focus. The focus in a risk analysis is based on what the impact will be on the human, while the impact of humans on technology and the environment is often not considered formally. To arrive at valid results, human behaviour must be integrated in the evaluation of risk in an operational environment as variability in human operator performance has been shown to have the highest impact on risk (Oberholzer and Thorpe, 1995; Leveson, 2012; Dekker, 2001, Hallbert, 2006; Badenhorst and van Tonder, 2004).
Activity-based risk
An acquisition process based on ABR can address the shortfalls identified above, since ABR has the following characteristics:
► It is a relativistic approach for comparison of different technologies in an integrated operational environment
► It addresses risk and cost reduction by following an iterative design, simulation, and evaluation approach using a functional framework
► It incorporates the impact of human error using risk scores and profiles that define human performance (from which probability distributions are derived)
► It translates risk to understandable operational response measures determined from consistent, realistic simulations
► It provides a balanced solution that takes into account the abilities of technology (in terms of functional requirements) and human resources (in terms of risk performance)
► It provides a body of reference knowledge that is reusable and adaptable to accommodate system improvement over time
► It provides visual results from simulations for decision support
► As ABR follows an SE process, it brings together stakeholders from engineering and mining through a requirements management process
►The ABR acquisition process specifically addresses a discontinuity between acquisition and operations by focusing on a functional analysis performed in the preliminary design phase of the product life-cycle.
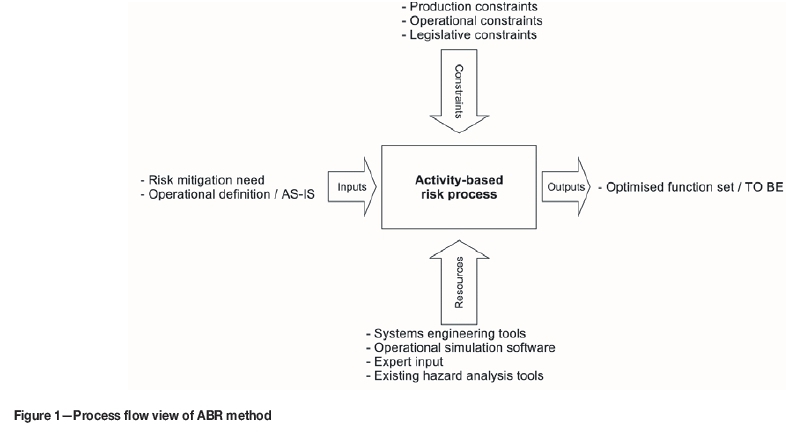
Figure 1 provides a process flow view of ABR as described in the sections to follow.
The most important objective of ABR is to provide a Junction set, selected by a scientifically sound evaluation process, where this resulting function set clearly defines the safety system's behaviour and architecture-that is, the resulting function set is an unambiguous functional specification.
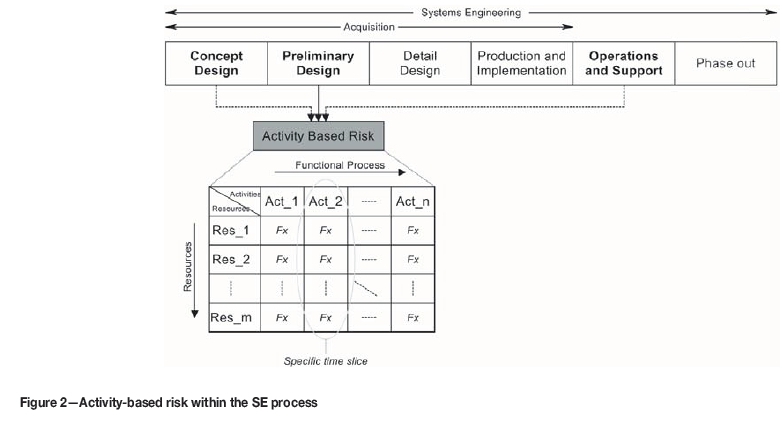
The ABR method thus makes use of a SE process with specific focus on preliminary design. Functional analysis forms an important part of this design activity. In the ABR process, system activities in the diagram in Figure 2 (indicated as Act_n) are identified as subsets of a full function set. This is done to allow focused analysis of individual activities and identification of high-risk activities and critical resources. Each system activity is a logical grouping of functions that draws together resources (Res_n) so that an integrated analysis is done when analysing individual activities. That is, smaller groupings of functions are analysed in such a way that all participating resources are taken into account, as opposed to considering failures of individual resources in isolation.
All system functions and resource operational states must be mapped to all system activities for modelling purposes in a form similar to a swim lane analysis as found in business process engineering literature (Jeyaraj and Sauter 2014). This is shown in Figure 2, with resource functions and states represented by 'Fx'. In the diagram, 'Fx' represents more than one function of a resource. The resource allocation table allows the designer to determine risks related to failures of resources and related system functions from the table. This approach enables 'optimization' of a system in terms of functional requirements and allows definition of desired characteristics of operators (and other human resources) that interact with the system.
ABR is thus a logical extension of the concept of baseline hazard identification. Baseline hazard assessment defines relative risk of high-level activities (for example, stoping) in terms of its baseline risk profile, which in turn is based on environmental factors and activities conducted in such hazardous environments (Boshoff, 2014; Paithankar, 2011). High-level activities can be broken down into smaller activity groupings that combine tasks in a logical way. This classifies ABR analysis-in this context-as a middle-out approach, as opposed to a top-down or bottom-up approach.
ABR relies heavily on the simulation of a system in operation in order to deal with complexity issues. A simulation is done instead of a pure mathematical analysis as it has the following advantages:
► A solid understanding of core operational activities (from a functional flow and architecture) is gained by engineering and operations when drawing up an understandable operational model. An understandable model is more pragmatic than purely mathematical and statistical models that require specialist knowledge and are difficult to understand
► Process blocks are defined (from a functional analysis) and used in simulations to implement complex functions, which assist with the understanding and modelling of a large number of resource functions, resources states, and interdependencies between resources and their states. This aligns well with the advantages of functional resonance accident modelling (FRAM) (Herrera, 2012)
► An integrated view of all relevant resources is obtained in the simulation model as the simulation does not focus on a single resource (as is usually the case in human factor analysis), but on the complete set of integrated resources that take part in that system activity
► A relativistic comparison can be made between candidate systems or products because a simulation model is drawn up for each candidate system. Variations between candidate systems are implemented fairly easily, as a basic simulation framework is constructed for the first model and then adapted for alternative models
► Information is preserved in the model for future adaptation to a selected system. This prevents reinvention of solutions and provides a body of knowledge for business continuity.
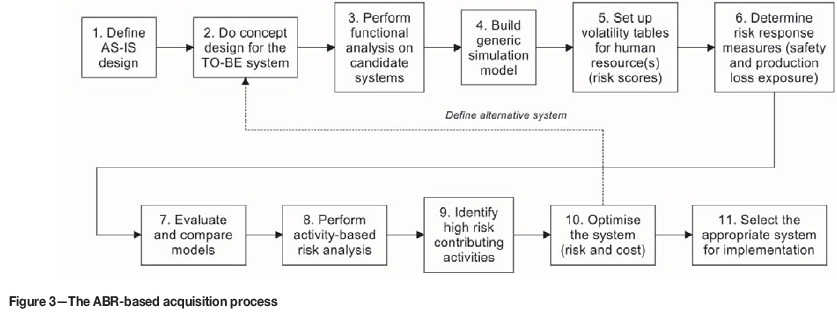
Implementation of ABR is shown in Figure 3. The sequence of steps is as follows.
Step 1: Define AS-IS design
The AS-IS design defines safety equipment currently in use. If no specific safety equipment exists and new technology is introduced, the AS-IS environment and operational functions are defined by a comprehensive operational analysis.
Step 2: Do concept design for the TO-BE system
The conceptual design of a safety system is typically defined by the mine in consultation with subject matter experts. This defines all required characteristics for the TO-BE system. From this conceptual design, operational requirements are used as inputs to the preliminary design step.
The feedback loop in Figure 3 allows a designer to improve the concept design iteratively by comparing simulated candidate systems, as opposed to physically implementing each system. It is imperative to consider more than one solution, or variations of a solution, as the focus of ABR is to provide a relativistic comparison of candidate systems.
Step 3: Perform functional analysis on candidate systems
The system AS-IS functional analyses (from the preliminary design) is adapted to address requirements of the TO-BE candidate systems. An adapted functional analysis is provided for each candidate system. Commonly, candidate systems are altered versions of the AS-IS or new concept system.
Step 3.1: Define system functional architecture
A functional architecture is drawn up for each candidate system to define a configuration of functional units for all candidate models, including performance and allocated nonfunctional characteristics. All physical resources linked to functional units of the system architecture must be identified.
Step 3.2: Define system interfaces
System interface definitions form part of the system architecture and define all interdependencies between architectural components. Interfaces between resources (humans/equipment/environment) must be clearly indicated and defined. These interfaces must include:
• Functional interfaces in the abstracted model, showing interdependencies that will affect functional flow for modelling purposes
• Physical interfaces, such as mechanical, electrical, IT-related, and user/ergonomic interfaces.
Step 3.3: Define functional flows/states for resources
All resource states and functions are defined, where resources typically include operators and other end-users of the system, as well as core operational equipment and safety system equipment operating within a specific environment.
Functional flows (from the preliminary design) are augmented by event trees to account for human resource variability and human-equipment interaction. An event tree exists for every candidate system, thus taking into account variability in technology. The flows include functions of all acting human resources. In an event tree, all possible routes are established by evaluating all possible decisions and actions taken by a human resource, given the operational flow and environment.
It is important to note that for the implementation of the ABR approach the outcomes of interactions between human functions, equipment, and the environment are presented as states in an event tree. This allows a designer to define system state diagrams that represent the interaction of all candidate safety systems with human operators, operational equipment, and the operational environments.
The definition and clear documentation of functional flows and states are critical to the ABR process, as these will directly assist with the implementation of a system model when a simulation model is constructed. State modelling requires specialist knowledge about the states that safety equipment can assume - therefore, safety equipment designers must be part of the functional modelling process.
Step 3.4: Define activities
A set of required system activities is defined for all candidate systems. System activities are subsets of the overall function set and are logical activities that form part of the operation of a system; for example, phases of a functional flow over time. A system activity is a logical grouping that draws together all participating resources in a subset of the overall functional flow.
A common set of activities must be used for all candidate systems for relativistic comparison, even though some activities may not be present in all candidate systems.
It is critical to identify transitions between activities, as risk conditions usually change during such transitions. For example, changing from a safe to an unsafe state requires coordination between resources; if this is not correctly implemented it may lead to transient effects.
Step 3.5: Allocate resources
A resource allocation is performed in a tabular format with system activities along columns and resources along rows.
The predefined states for each resource and the functions that may be performed within these states are also linked to each activity using this table. Resources that contribute to activities must be presented as primary or secondary: primary resources perform core functions, while all remaining resources perform secondary functions.
A resource allocation is the first step towards identification of resource risks of a system. This table allows identification of critical resources and the impact on system activities when resources fail. This is also a first step towards risk mitigation by identifying alternative functions and resources. A more detailed risk analysis is performed in the following steps.
Step 4: Build generic simulation model
A detailed comparison between the alternative safety systems requires an analysis of all processes and resource states for a representative set of scenarios. As manual analysis alone cannot deal with this level of complexity a simulation model is implemented for each candidate system within the defined operational environment. A simulation platform such as SIMIO® is employed to implement all candidate systems as a set of interconnected process blocks. Outputs from such simulations will be used to identify risks during later steps of the process.
Functional flows (translated to event trees) include human resource decisions and actions that can be implemented as process flows in simulation software, while states of equipment are used to model interactions between resources according to the functional flow. This approach simplifies the analysis of operationally complex models significantly. Visual representation of system elements and their interactions is also available to support design decisions.
Validation of operational performance parameters is important when constructing an operational model. Performance parameters define activities in functional flows and must be defined and allocated to represent real-world scenarios accurately. In many instances system performance is dependent on risk profiles / scores of human resources.
A design team defines candidate system models with their parameters and operational performance measures so that parameters and performance measures agree and align across different models. This is done to allow a relativistic comparison between candidate models.
Step 5: Set up volatility tables for human resources
Volatility tables introduce human error in a multidimensional operational context. Volatility tables are therefore set up for activities where humans may deviate or fail. Decisions and/or alternative actions at branches in the event tree are identified in the functional analysis where all possible branches in the system's functional flow are defined.
In order to draw up such tables, the design team must define risk scores for system operators. It is possible to use psychometric modelling for this purpose (Dekker, 2001, 2006; Embrey and Zaed, 2010), particularly for operators that work in high-risk environments.
A risk rating of a human resource is used in the simulation model to define the required parameters of a probability density distribution for failures at specific tasks in an operational workflow. These probability distributions will be implemented by the simulation software in order to generate realistic distributions of system outcomes that take into account the variability of human operator actions.
The operational model thus combines the realistically expected behaviour of humans and technology through operational workflows, event trees, and resource allocations for each activity. This is done in a multidimensional operational environment, taking into account all system resource states and interdependencies.
Although the estimation of human performance parameters introduces an element of uncertainty, the relativistic approach followed in the ABR method largely alleviates this issue. It must be taken into account that the ultimate aim is to identify the most appropriate safety equipment based on a realistic comparison of alternatives. As all candidate systems make use of the same human resources with the same estimated characteristics, the estimated accuracy of human performance parameters is important but not overly critical.
Step 6: Determine risk response measures/factors
Appropriate risk response measures must be identified for use in the simulation model to represent risk in an operational sense. These risk response measures are dependent on the type of risk being analysed and are selected to be semantically appropriate in an operational environment; they can typically be time of exposure to unsafe conditions and number of equipment or human failures.
Safety and production are juxtaposed and must be balanced in a production environment. For this reason two separate measures are required that relate directly to safety and production. Measures aligned with safety and production risk are hazardous exposure (time) and production loss (time), respectively. Hazardous exposure is the time a human operator spends in a hazardous environment when the system is in an unsafe state. Production loss time is production time lost due to suspension of operations for safety and other reasons.
One may argue that hazardous exposure does not always lead to an accident, and that time lost for production does not imply production would have taken place. However, the probability of an injury or fatality occurring when the system is in an unsafe state is proportional to the time operators spend in hazardous environments, and production time lost could have been used for production in a productive organization. Moreover, a safety culture may increase or decrease the probability of injuries and fatalities, and a production culture affects the probability of production in a similar fashion. As long as a realistic and consistent risk allocation method is followed, the result of the ABR process is a relativistic comparison between candidate systems as the same set of conditions apply to all candidate systems.
Step 7: Evaluate and compare models
In essence, candidate systems are compared by taking into consideration system sensitivity with respect to human variability in a predefined operational environment. Simulation response measures are evaluated for each candidate system to minimize the selected risk response measures, that is, to obtain the minimum hazardous exposure and minimum loss in production time.
Multiple simulation runs are executed for each alternative option in order to generate representative statistics for performance measures, due to the stochastic nature of human activity in process models. The number of simulation runs is selected to provide statistics within acceptable confidence intervals. From the response measures of simulations, trends and worst-case scenarios are determined.
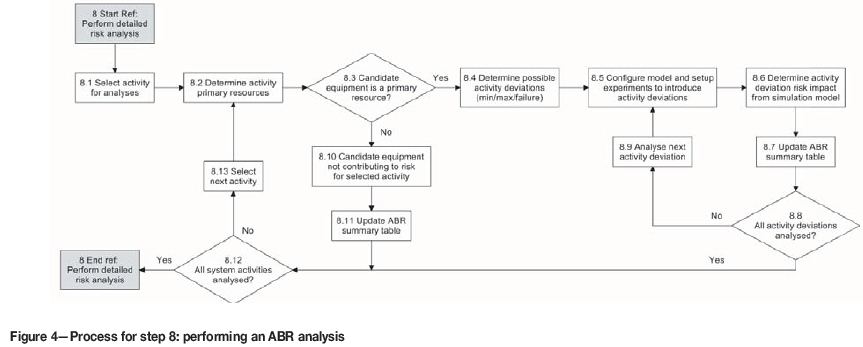
Step 8: Perform detailed risk analysis
A detailed risk analysis is imperative in the ABR process, as this is where risks associated with activities are identified. In this step, a table is constructed indicating the impact when deviations or failures are introduced into a specific activity. This allows identification of high-risk activities that are sensitive to human variation in the system. These activities are addressed when performing system optimization.
The process for performing a detailed risk analysis is shown in Figure 4.
All identified activities are analysed sequentially. Primary resources must be analysed specifically, but all activities are taken into account during simulation. When a candidate system's technology (equipment) does not act as a primary resource for an activity, the candidate system does not constitute a primary contributor to risk for that activity.
When the candidate system acts as a primary resource, all possible human variations/deviations for this activity are analysed. Typical deviations include time to execute a task or failure to execute a task. In many activities, failures result in activities not being performed. Once possible deviations have been determined, each deviation is implemented and simulations are run for the complete system, including all variations. Response measures from simulations are compared with response measures of the candidate system model without deviations. This comparison shows the impact of deviations on activities. Impacts are updated in an activity risk table. Once all activities have been analysed and the activity risk table has been completed, high-risk activities are identified for adaptation, replacement, or removal.
Step 9: Select high-risk activities
High-risk activities are summarized in an activity risk table. Activities that are sensitive to failure and performance deviation will show up in the table and are identified as critical. These activities are used in the optimization step.
Step 10: Optimize the system
A system can be optimized with respect to risk by addressing high-risk activities first. This is achieved by evaluating candidate system models where high-risk activities (or technologies) can be altered to reduce risk, or where risk controls can be added. Each candidate system is analysed to determine the impact on activities for all systems, until an optimized system is obtained either in terms of risk or cost, depending on the risk appetite of the mine.
The winning system is further optimized for cost by adapting or removing high-cost functions and activities. In the evaluation of a system, focus is maintained on the cost of the actual system hardware and its supporting elements only, excluding the cost of injuries or fatalities. This is achieved by reducing the functionality of the successful system by using results from the analysis. Throughout, inclusion of critical features and exclusion of redundant features are ensured. With every change, however small, the complete system must be re-evaluated.
This optimization cycle allows for risk reduction by adjusting or removing high-risk functions, but also provides valuable information on the sensitivity of the system with respect to human performance variation. A system can be optimized up to a point by altering technology, after which residual risk must be reduced by addressing human factors specifically. Human factors are changed by changing organizational policy and culture, which results in changes in support processes (training, safety awareness, etc.), operational measurement, and control processes and procedures.
When optimizing a system for cost, the design team and other stakeholders must perform a trade-off analysis between modifying system functions and modifying human procedures to reach a point that is regarded as optimal. This may include cases where it is more cost-effective to use a more affordable system with reduced functionality, and to address residual risk by modifying human procedures instead of investing in further technology. ABR analysis shows where the point of diminishing returns lies.
Step 11: Select the appropriate system for implementation
Once the system has been optimized for functionality and cost, specific system characteristics are used as inputs to the detail requirements for the detail design phase of the SE life-cycle, after which the system is implemented and evaluated in operation.
Results
The ABR process was validated by means of a real-world case study, in which the ABR process was applied to a winch signalling safety system for scraping operations in stopes. Four candidate systems were analysed and evaluated using the ABR process. The first system was a conventional air-whistle system (AWS) that represented the AS-IS system. The TO-BE system was an electronic signalling system (ESS), a concept proposed by a local mine (ESS1). The ABR analysis of these two systems identified high-cost and high-risk functions associated with ESS1, resulting in the identification of two further candidate systems, namely a risk-reduced system (ESS2) and a cost-reduced system (ESS3). The risk-reduced system focuses purely on reducing risk (that is, reducing hazardous exposure, for example), while the cost-reduced system focuses on a balance between risk and cost by considering both hazardous exposure and production loss.
In the ABR analysis of the winch signalling system, five risk levels for the human resources were defined, with 1 being low risk and 5 being high risk. In order to understand the effect of operator risk, a system designer has to adjust the risk level of an operator, followed by an analysis of the complete system (that is, including all system elements). The complete system analysis may then show an increase or decrease in production and, similarly, an increase or decrease in risk. This form of sensitivity analysis allows the designer to find an optimal risk level for an operator, or identify a point of diminishing returns where a decrease in risk level no longer yields dividends. The operator risk levels were incorporated into an operational simulation model developed and implemented in SIMIO®, an object-oriented software modelling tool (Pegden and Sturrock, 2013). Interesting results relating to hazardous exposure and production loss are presented in Figure 5 and Figure 6.
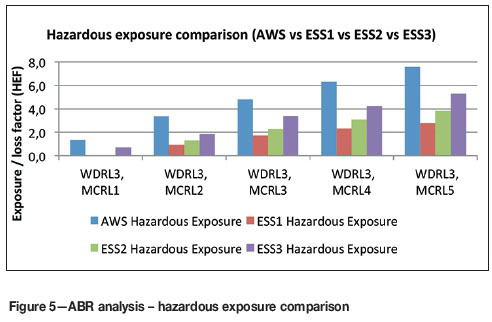
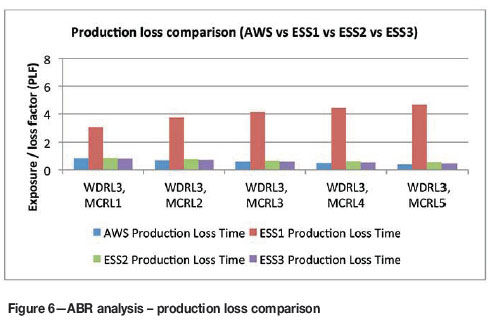
Figure 5 and Figure 6 show results for scenarios where the risk levels of miner crossing a gully (MCRL) varied between 1 and 5, coupled with a risk level of a winch driver (WDRL) at level 3 on the same risk scale-these risk values translated directly to decisions and actions at key points in the validated simulation model's work flow. An average risk of level 3 was assigned to the winch driver as the impact of the winch driver on risk was small compared to that of miners.
To compare the candidate systems in a relativistic sense, normalized risk-related factors were defined (not risk in strict definition, but rather a normalized score that fits the ontology of the mining environment). The production loss factor (PLF) represented possible production loss time on a scale of 1 to 10. For example, a PLF value of 3 implied that 30% of maximum possible production time was lost. A hazardous exposure factor (HEF) represented time during which a gully was used by miners while in an unsafe state. For example, an HEF value of 2 implied that a miner was in an unsafe gully 20% of the time.
A sufficient number of simulations runs were performed to obtain statistically significant, normalized results. Results for different scenarios (Figure 5 and Figure 6) show high hazardous exposure for the AWS and low production loss -this was also observed in practice. The ESS1 system directly addressed hazardous exposure by lowering this level, but showed a significant increase (as observed) in production loss. The results from the risk-reduced system (ESS2) show that production losses were significantly reduced, but with a slight increase in hazardous exposure. The ESS3 system with cost-reduced functionality showed a further increase in hazardous exposure while the production loss remained at a low level. Interestingly, both the AWS and ESS1 systems were rejected by the mines, while the ESS2 and ESS3 systems were retained. The decision to select the ESS2 and ESS3 systems was based on physical evaluation of all systems in controlled environments.
From Figure 5 it is noted that hazardous exposure increases significantly as the risk level (MCRLn) of the miner crossing the gully increases for an average-risk winch driver (WDRL3), which demonstrates the system's sensitivity with respect to the risk level of a miner crossing. The system was found to be significantly less sensitive with respect to the risk level of a winch driver when electronic winch signalling equipment was used to control the overall system states and state transitions (not shown, but determined from ABR analysis). It was also seen from ABR analysis that with the AWS system, the hazardous exposure increased significantly when the winch driver risk level increased; this is due to limited system state control when using an AWS system.
Figures 7 to 10 show the sensitivity of the change in risk level of the resources with respect to hazardous exposure and production loss. The analysis shows that hazardous exposure increases significantly as the risk level of the miner crossing the gully increases (Figure 7) while the system (except for the AWS) is less sensitive to a change in the risk level of a winch driver operating the signalling system (Figure 8). The main reason for the decrease in sensitivity of the electronic signalling systems with respect to the winch driver (ESS 1 -3) is that the system can be tripped from a gully and is not entirely dependent on a winch operator.
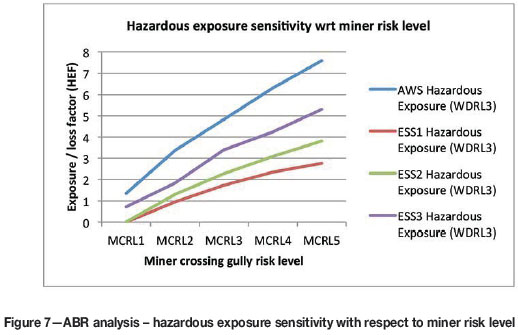
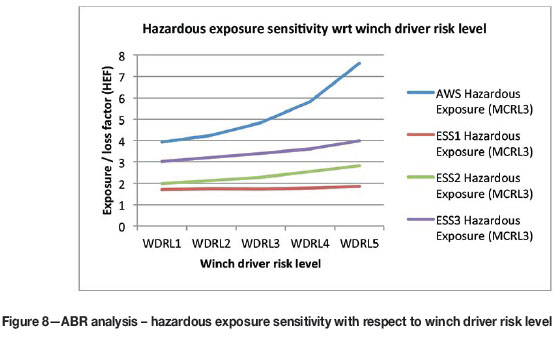
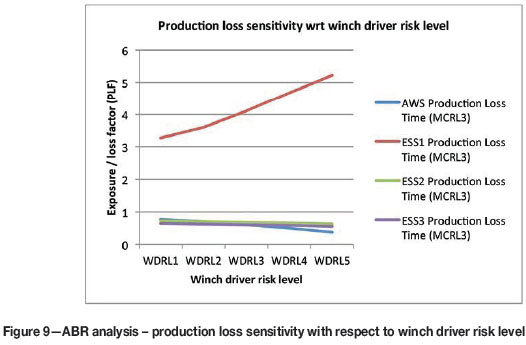
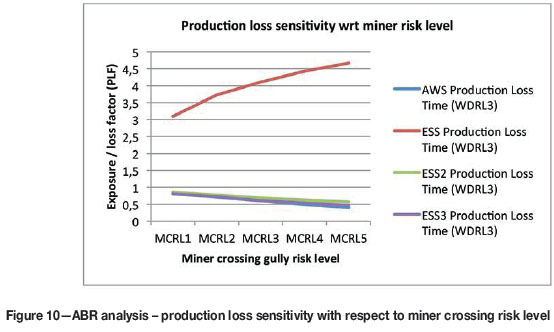
Production loss sensitivity with respect to resources as displayed in Figures 9 and 10 is fairly low (less than 1, on a scale of 1 to 10) for all systems except ESS1, since ESS1 requires a winch driver to perform gully inspection after every voluntary trip condition-clearly a time-consuming task. In contrast it can be seen that for the AWS, ESS2, and ESS3 production loss decreases slightly with an increase in resource risk level. This is because a more risky winch driver will ignore more signals from the gully, thus using the system in an unsafe state. The same happens with miners crossing a gully: more risky miners will ignore (or fail to determine) gully states and will cross gullies in unsafe states.
A balance between production loss and hazardous exposure must be obtained, both of which are provided by ESS2 (risk-reduced) and ESS3 (cost-reduced), with ESS3 being slightly less costly but more risky than ESS2. From the results, it is clear that the function sets of ESS2 and ESS3 represent solutions that are more suitable than the AWS or ESS1 alternatives, as long as winch drivers' and (mostly) miners' risk levels are properly managed.
Conclusion
An activity-based risk (ABR) method was developed to address shortfalls in the acquisition of electronic safety equipment in mines. Most notably, ABR supports the selection of an optimal function set with respect to risk-related factors and cost while also addressing operational requirements. ABR is most effective when used during the preliminary design phase of a systems engineering process, and provides a framework for drawing comparisons between candidate systems. Constructing and simulating a state-space representation of the operational environment allows the modelling of human behaviour in a complex operational environment and forms a critical element of ABR.
In a real-world case study, an electronic winch signalling system was analysed to address safety risks in winch scraping activities. The ABR method was employed to determine high-risk activities for three candidate systems, resulting in the definition of a risk-reduced system where a balance was found between production risk and hazardous exposure. A cost-reduced system was also evaluated, and showed a slight increase in hazardous exposure with respect to the risk-reduced system, but allowing equipment cost to be significantly reduced. Feedback obtained from mines correlated with the ABR model results and validated findings in the winch signalling case study.
Results from this research show that human behaviour can be modelled in complex systems by following a structured process of modelling and analysis. Operational models should be used to determine function sets for equipment by considering risk and production losses and allowing variation in equipment functionality and human behaviour.
The results provide conclusive evidence that in order to accurately compare alternative solutions to operational problems it is essential to perform a detailed analysis that quantifies the impact of each process activity on each of the operational performance criteria. It was furthermore shown that the impact of both technology and human resources, and the interaction between these, on operational performance must be clearly described for each alternative solution. Evidence was presented to demonstrate how a simulation approach can be used to implement a relativistic comparison between alternatives that can support accurate and reliable decision-making about the acquisition of safety systems before such systems are deployed, in the process saving significant costs in terms of unsuccessful system deployments, loss in production, and risk to human lives.
Future work will include a comparison between the results produced by the simulators developed as part of this research and actual operational activities in mines that employ different safety concepts. This will allow the proposed approach to be refined and the simulators to be calibrated to real-world results.
References
Aven, T. 2009. Trends in quantitative risk assessments. International Journal of Performability Engineering, vol. 5, no. 5. p. 447. [ Links ]
Backlund, F. and Hannu J. 2002.Can we make maintenance decisions on risk analysis results? Journal of Quality in Maintenance Engineering, vol. 8, no. 1. pp. 77-91. [ Links ]
Badenhorst, F., and van Tonder, J. 2004. Determining the factors causing human error deficiencies at a public utility company. South African Journal of Human Resource Management, vol. 2, no. 3. pp. 62-69. [ Links ]
BOSHOFF, T. Not dated. Different risk assessment types. http://www.labourguide.co.za [Accessed 18 October 2014]. [ Links ]
Dekker, S.W.A. 2001. The re-invention of human error. Human Factors and Aerospace Safety, vol. 1, no. 3. pp. 247-265. [ Links ]
Dekker, S.W.A. 2006.The Field Guide to Human Error. Cranfield University Press, Bedford, UK. [ Links ]
Embrey, D. and Zaed, S. 2010. A set of computer based tools identifying and preventing human error in plant operations. Proceedings of the 6th Global Conference on Safety. AIChE, San Antonio, TX. pp. 1-11. [ Links ]
Hallbert, B., Boring, R., Gertman, D., Dudenhoeffer, D., Whaley, A., Marble, J., and JOE, J. 2006. Human event repository and analysis (HERA) system, overview. Division of Risk Assessment and Special Projects, Office of Nuclear Regulatory Research, uS Nuclear Regulatory Commission. [ Links ]
Herrera, I.A., and Woltjer, R. 2010. Comparing a multi-linear (STEP) and systemic (FRAM) method for accident analysis. Reliability Engineering & System Safety, vol. 95, no. 12. pp. 1269-1275. [ Links ]
Jeyaraj, A. and Sauter, V.L. 2014. Validation of business process models using swimlane diagrams. Journal of Information Technology Management, vol. XXV, no. 4. pp. 27-37. [ Links ]
Leveson, N.G. 2012. Engineering a Safer World: Systems Thinking Applied to Safety. MIT Press, Cambridge, MA. [ Links ]
Oberholzer, J. and Thorpe, L. 1995. An assessment of the most significant causes of transportation and machinery accidents on collieries. Safety in Mines Research Advisory Committee, COL 203, August 1995. Johannesburg, South Africa. pp. 1-64. [ Links ]
Paithankar, A. 2011. Hazard identification and risk analysis in mining industry. Department of Mining Engineering, National Institute of Technololgy, Rourkela, India. [ Links ]
Pegden, C. and Sturrock, D. 2013. Rapid modeling solutions: introduction to simulation and Simio. Simio LLC, Pittsburgh, PA [ Links ]
Van der Merwe, G.P.R. 2014. A risk-based approach to the acquisition of electronic safety equipment for mines. PhD thesis, North-West university, Potchefstroom, South Africa. [ Links ]
Paper received Mar. 2016
Revised paper received Apr. 2016

