


Servicios Personalizados
Articulo
 Inglés (pdf)
 Articulo en XML
 Referencias del artículo
Indicadores

Links relacionados
-
 Citado por Google
 -
 Similares en Google
Compartir

 Permalink
Journal of the Southern African Institute of Mining and Metallurgy
versión On-line ISSN 2411-9717
versión impresa ISSN 2225-6253
J. S. Afr. Inst. Min. Metall. vol.117 no.6 Johannesburg jun. 2017
http://dx.doi.org/10.17159/2411-9717/2017/v117n6a1
PAPERS OF GENERAL INTEREST
Near-surface wave attenuation (kappa) of Far West Rand micro-events
M.B.C. Brandt
Councilfor Geoscience, Geophysics Competency, South Africa
SYNOPSIS
The near-surface wave attenuation factor k (kappa), which describes the attenuation of seismic waves with distance in the upper 1-3 km of the Earth, was determined for the Far West Rand gold mining area using seismic data recorded by station Parys (PRYS) of the South African National Seismograph Network. Twenty micro-events in the magnitude range 0.7 < ML< 1.8 for the period 1 July to 15 November 2015 were analysed. For the analysis a 10-second window for the S phase portion of the vertical component seismogram was selected. The result was an average k = 0.048 ± 0.014 s, which is much higher than for a stable continental region where k ≈ 0.006 s. This is because the assumed Brune source model is inappropriate for describing mining-related events that often have moment tensors with a volumetric (implosive) component. The average k was calculated to be 0.098 ± 0.038 s for explosions of a similar magnitude. This higher value derived for mining-related k may be employed as a means of correcting the Brune source spectrum to calculate seismic moment as well as corner frequency for events in the mining areas of South Africa.
Keywords: Kappa, near-surface attenuation, mining-related seismic event, spectral analysis.
Introduction
Brandt (2015) and Birch, Cichowicz, and Grobbelaar (2015) recently undertook studies to determine the quality factor Q and attenuation parameter a, which describe the attenuation of seismic waves with distance, for South African earthquakes and mining-related seismic events, respectively. Brandt (2015) derived an attenuation relation of Q(f) » 400/0.7, whereas Birch, Cichowicz, and Grobbelaar (2015) estimated the relation Q(f) = 327/0.81 for the Kaapvaal Craton. However, both these studies determined Q without knowledge of the near-surface attenuation, which is quantified by the factor k (kappa). The general decrease in amplitude of seismic waves caused by attenuation may be described by using the quality factor Q, as was proposed over 50 years ago (e.g. Havskov and Ottemoller, 2010b):
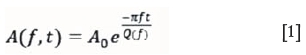
where A0 is the initial amplitude, A(t) the mplitude after the waves have travelled for time t,f represents the frequency, and Q(f) is the general frequency-dependent quality factor. Q has been observed to have strong regional variations in the crust and a frequency dependence of the form
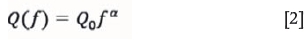
(e.g. Kvamme and Havskov, 1989; Kvamme, Hansen, and Bungum, 1995; Malagnini, Herrmann, and Koch, 2000) whenf > 1 Hz and Q(f) is nearly constant for 0.1 Hz <f < 1.0 Hz (e.g. Stein and Wysession, 2003). The frequency dependence is often found to be stronger with increasing tectonic activity and is thought to be related to the decrease in homogeneity within the crust (e.g. Kvamme and Havskov, 1989; Birch, Cichowicz, and Grobbelaar, 2015). Q is also thought to be mostly constant along the ray path for local seismology observations, with the exception of the near-surface layers (1-3 km), which generally have a much lower Q than the rest of the path and tend to filter out high-frequency energy between 5-25 Hz (e.g. Havskov and Ottemoller, 2010b). The attenuation term in Equation [1] may be separated into surface and deeper crust effects:
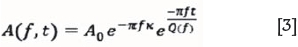
with k representing the near-surface attenuation. The parameter k describes the asymptotic high-frequency slope of the spectrum of a seismogram. A low value for k corresponds to a seismogram with abundant high-frequency energy, whereas a high value corresponds to a minimal amount of high-frequency energy (Kilb et al., 2012). Kappa varies with region (stable continental area vs. active tectonic region) and surface geology (very hard rock vs. softer rock) (Douglas et al., 2010). In this study, to determine k, the quality factor Q(f) in Equation [3] was fixed at a predetermined value of Q = 400 and α= 0.7, which is suitable for the regional distances monitored by the National Seismograph Network (Brandt, 2015).
Two routine methods are available to determine k (Kilb et al., 2012).
► In the original definition given by Anderson and Hough (1984), k is estimated for frequencies larger than the source spectrum corner frequency f,, from the linear range of the acceleration spectral amplitude decay where the signal is above the noise floor. At first only applied to large earthquakes (ML < 5), this method was later modified to include events of smaller magnitudes (ML < 3.4) where the signal has an adequate signal-to-noise ratio (Douglas et al., 2010)
► A modified definition applicable to micro-events with magnitude M < 1 assumes that the low-frequency displacement source spectrum is flat below the corner frequency fb, and that any slope is attributable only to the attenuation (Havskov and Ottemöller, 2010b). An advanced definition extends the frequency range to where k affects the corner frequency (typical for magnitudes 1.0 < ML < 3.4 in the frequency range 5-25 Hz) and assumes an earthquake source model and/or a spectral shape to solve for k , the seismic moment, stress drop, and source dimension simultaneously (Garcia, Romacho, and Jiménes, 2004).
In this study, k was calculated using a data-set of micro-events of ML < 1.8 located mostly in the Far West Rand gold mining area. The SEISAN earthquake analysis software (Havskov and Ottemõller, 2010a) was used to determine k with a spectral analysis of the seismic signals recorded by a nearby, suitably calibrated seismograph station, properly installed on bedrock. The analysis closely follows the routine data processing techniques prescribed by Havskov and Ottemõller (2010b), who determined seismic moments on vertical-component seismograms. The advantage of this approach is that the spectral analysis will be backward-compatible to the 1990s, when waveform recording by the National Network was on vertical-component seismographs only (Saunders et al., 2008). For comparison, k was also calculated for a data-set of explosions of similar-sized magnitudes that had occurred in the Sasolburg coal mining area with similar epicentral distances. It was envisaged that the resultant k would be useful for the attenuation relation required by spectral analysis of mining-related events when calculating moment magnitude, Mw, for S-waves with the seismograms recorded by the National Seismograph Network (Saunders et al., 2008; Brandt, 2015). However, owing to the limited frequency range of 4-9 Hz of the analysis, this derived k should not be extrapolated for strong ground motion engineering applications.
Method
Determining k with signals originating from micro-events is the preferred method, given that larger earthquakes of ML > 3.4 occur infrequently in the Far West Rand. Figure 1 is a map showing the data-set of 20 micro-events (19 in the Far West Rand and one in the Central Rand) for the magnitude range 0.7 < ML< 1.8 over the period 1 July to 15 November 2015. The typical epicentre uncertainty of events located with the National Network is ±5 km for the Far West Rand (Brandt, 2014), although micro-events are only detected by a small number of nearby stations where the P- and S-phases usually have low signal-to-noise ratios. Hence the location uncertainty may be as large as ±10 km. The analysis was performed using the signals recorded by the seismograph station at Parys (PRYS) with epicentral distances of 51-83 km for the Far West Rand events and 109 km for the Central Rand event. Station PRYS is suitably calibrated up to a maximum frequency of 9 Hz, beyond which the anti-alias filters influence the signal, making it difficult to calibrate. The station is also properly installed on bedrock, which ensures that no unwanted signal distortions or amplifications occur at the site.
For the analysis it was assumed that signals are generated following the Brune source model (Brune, 1970, 1971):
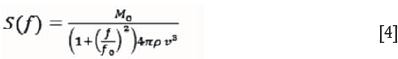
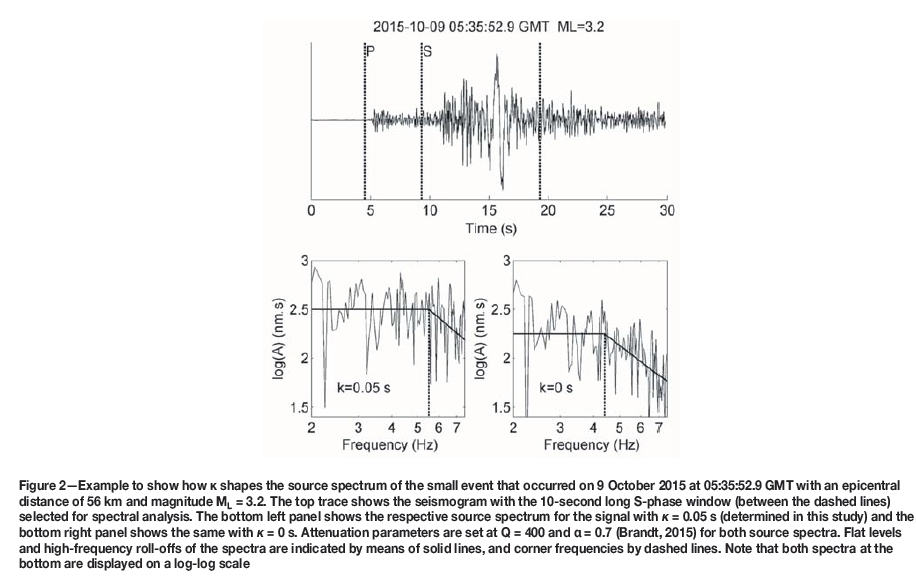
where M0(Nm) is the seismic moment, p is the density (kg/m3), v is the velocity (m/s) at the source, andf0 is the corner frequency. Therefore the log-log shape of the displacement source spectrum is flat at low frequencies below f0 with a level proportional to the seismic moment. At high frequencies above f0the spectrum rolls off at a slope of -2 (Havskov and Ottemõller, 2010b). Figure 2 shows how k shapes the source spectrum of a small earthquake with a magnitude of ML= 3.2 (with the uncorrected f0between 5 and 25 Hz) at an epicentral distance of 56 km. If the attenuation parameters are fixed at Q = 400 and α = 0.7 (Brandt, 2015) an increase in k from 0 s to 0.05 s leads to an increase in the spectral level (i.e. M0) and an increase for f0 from approximately 4.3 Hz to 5.5 Hz. If the quality factor is fixed, k should not affect the corner frequency of a medium-sized earthquake with ML > 3.4 or a micro-event of ML< 1.
Anderson and Hough's (1984) definition of k is based on the premise that the corner frequency f0of an earthquake of magnitude ML > 5 is below 5 Hz and hence the shape of the source spectrum roll-off in the frequency range 5-25 Hz is influenced only by the attenuation (Kilb etal., 2012). The actual analysis was performed using an acceleration Fourier spectrum which allowed the analyst to identify the frequency, JE, where the downward trend towards higher frequencies starts. IffEis larger than the corner frequency it is possible to analyse smaller-magnitude earthquakes, provided that the signal-to-noise ratio is adequate. The smallest-magnitude earthquake suitable for analysis may be as low as M=3.4 (Douglas et al., 2010). The modified definition is based on the premise thatf0of micro-events with ML< 1 is above 25 Hz and, hence, the spectral level will depend on only M0and the attenuation. This is the micro-event analogue for determining k for larger earthquakes over the frequency range 5-25 Hz (Havskov and Ottemõller, 2010b; Kilb et al., 2012). Taking the natural logarithm of Equation [3] gives:
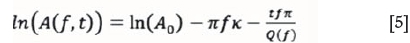
When plotting ln(A(f,t)) as a function off on a lin-log scale, Equation [5] will give a straight line with slope λ = π(k +t/Q) if Q is frequency-independent. If Q = Qf the slope simply becomes λ = -πk. If Q(f) is known, as was the case for this study, the spectrum is first corrected for Q(f) and then k is determined directly.
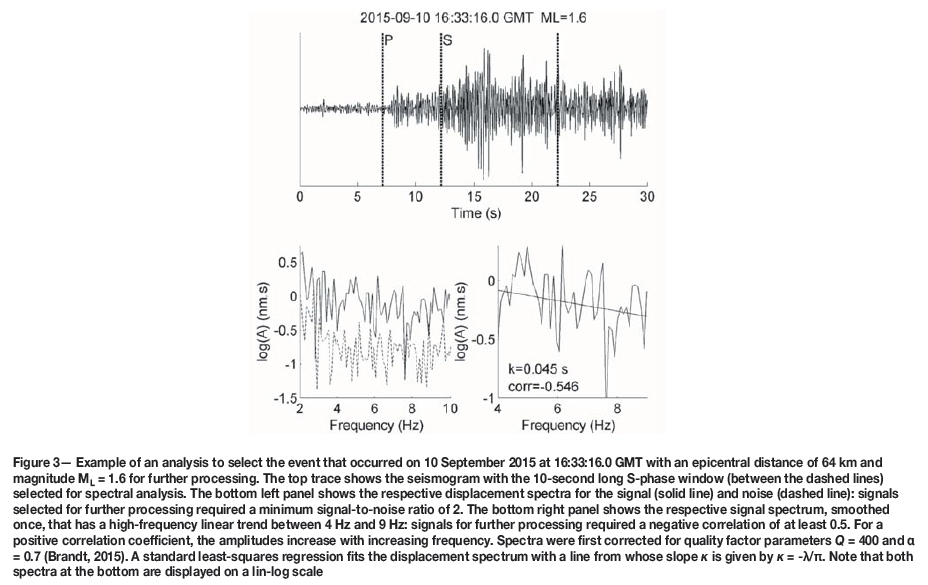
The first step in the signal analysis was to select suitable events for further processing. Figure 3 shows an example of the semi-automatic selection procedure. The S-phase portion of the vertical-component seismogram was identified and the applicable displacement source spectrum calculated. The signal spectrum and the noise spectrum for a 10 s window preceding the P phase were plotted together to identify signals with a signal-to-noise ratio of at least 2. Next, the spectrum was lightly smoothed, corrected for Q(f), and plotted on a lin-log graph. A line was semi-automatically fitted over the high-frequency linear trend between 4-9 Hz. A preliminary value for k was derived from the slope of the line and checked for consistency (0.001 < k < 0.1) for those results where the correlation between the fitted line and the signal was acceptable (absolute corr. < 0.5). No mining logs were available to identify explosions, hence this test should eliminate blasts as well as events caused by slip fractures from further processing. (Also see k determined for explosions, below.) Since station PRYS is suitably calibrated only up to a maximum frequency of 9 Hz, the derived values for k are valid only for low-frequency near-surface attenuation. But since the data-set contained only one suitable event of ML< 1, the 4-9 Hz frequency range allowed this analysis to be extended to include larger-magnitude events up to ML< 1.8 with corner frequenciesf0> 9 Hz (i.e. less than 25 Hz).
The procedure to calculate k for micro-events is as follows (Havskov and Ottemõller, 2010b):
► Select small events with a high corner frequency
► Next, select events with an adequate signal-to-noise ratio
► Calculate and draw the instrument-corrected S-phase displacement source spectrum (corrected for Q and α )
► Fit a straight line over the linear trend of the flat part of the lightly smoothed lin-log spectrum wheref f < f0
► Obtain the slope and calculate a preliminary consistent k for the line that fits the spectrum with an acceptable correlation
► Determine the average k from all the selected heavily smoothed spectra.
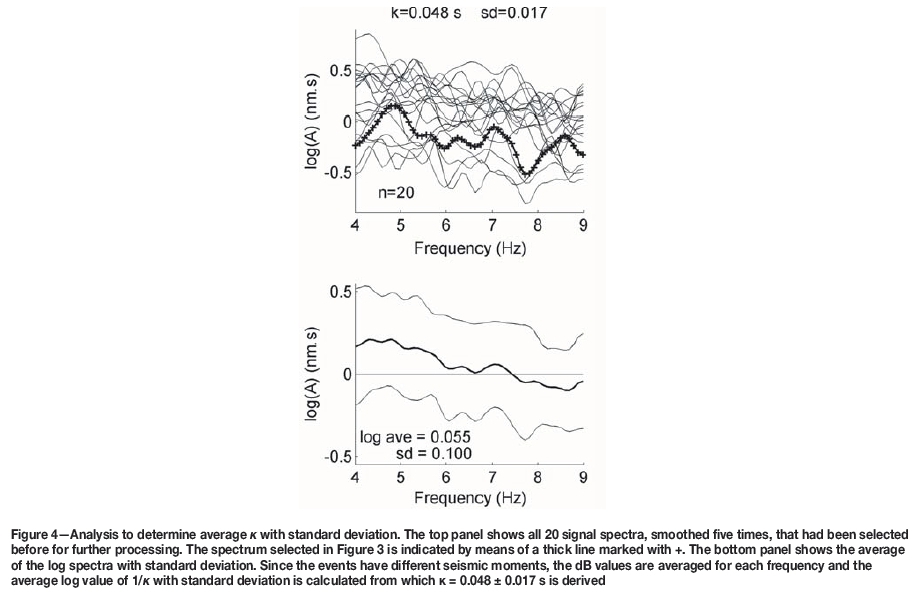
All 20 heavily smoothed spectra selected for further analysis in view of deriving the average k = 0.048 ± 0.017 s are shown in Figure 4. Heavy smoothing suppresses frequency subranges between 4 and 9 Hz that deviate substantially from the linear trend and cause the linear fit to yield spurious results. The averaging procedure takes the different spectral levels attributable to the magnitude range 0.7 < ML < 1.8 of the events (and hence different seismic moments) into account.
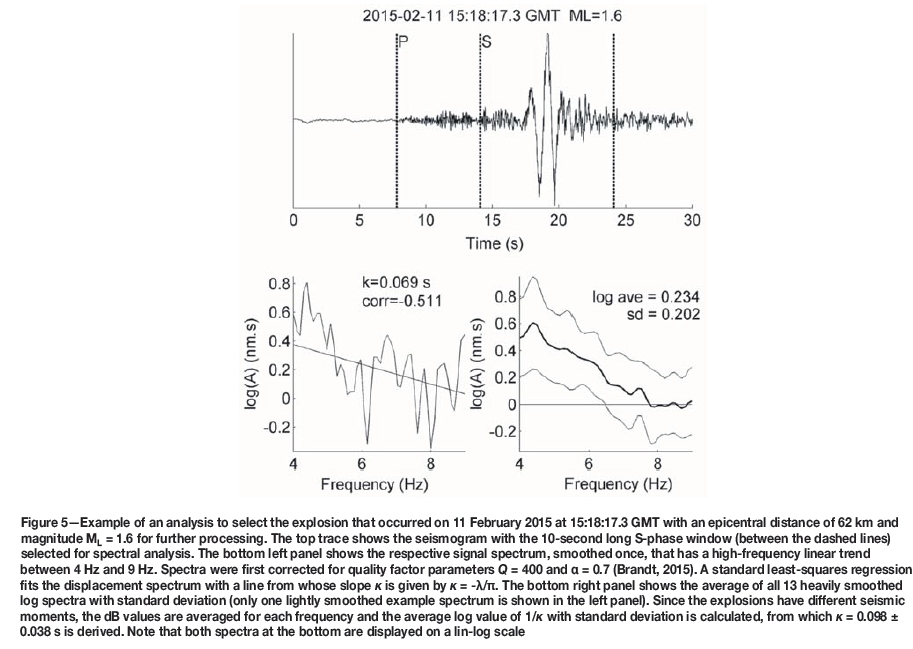
Values of k were also calculated for a data-set of explosions of similar magnitudes that occurred in the Sasolburg coal mining area over the period 20 January to 2 July 2015, with similar epicentral distances (between 37 km and 64 km) for comparison (Figure 1). The same procedure as before was followed, except that the consistency check was relaxed to 0.001 < k < 0.15. Figure 5 shows an example of such a selection analysis, as well as the analysis, to derive average k = 0.098 ± 0.038 s for 13 explosions in the magnitude range 1.3 < ML< 1.8.
Discussion and conclusion
Determining average k from micro-events provided a viable alternative to analysing larger earthquakes, which occur infrequently in the Far West Rand area. The result of this analysis yielded a k = 0.048 s, in line with the typical expected value of 0.05 s (Havskov and Ottemöller, 2010b) but which is higher than for other stable continental regions. Various investigations have found that in western North America (an active tectonic region where the surface rock is predominantly soft), rock sites have a kof about 0.04 s, whereas rock sites in eastern North America (a stable continental region where the surface rock is predominantly very hard) have k ≈ 0.006 s (Atkinson, 1996; Douglas et al., 2010). The values of mean k obtained for areas in mainland France vary between those obtained in North America and hard-rock sites in the Alps, where values as low as 0.0254 s have been recorded (Douglas et al., 2010). Garcia, Romacho, and Jiménes (2004) determined values from 0.01 s to 0.04 s for southern Spain, and the result presented in this paper is even higher than the average k of 0.04 s calculated for northeastern Sonora, Mexico, which is a tectonically active region (Fernández, Castro, and Huerta, 2010).
The result presented here is similar to the value of 0.05 s obtained by Malagnini, Herrmann, and Koch (2000) for central European earthquakes, but lower than the 0.08 s determined for explosions in the same area. Malagnini, Herrmann, and Koch (2000) note that almost doubling of k is needed to fit the source spectra of the explosions, because they are located on the surface causing seismic waves to travel twice through the highly attenuating near-surface layers. These authors further state that, while the Brune source model (Brune, 1970, 1971) is inappropriate for describing an explosive source, it is nevertheless used to avoid the problem of relating corner frequencies to explosive yields. Events related to deep mining activities in the Far West Rand have focal depths of 1-4 km, in comparison to tectonic earthquakes that occur at depths greater than 4 km (Brandt, 2014). Mining-related events also often have moment tensors with a volumetric component (implosive) comparable in magnitude to their shear components (McGarr, 2002). The high value obtained for average k may be the result of additional near-surface attenuation at the focus and the effect of the implosive component not accounted for in the Brune source model.
To test this hypothesis, k was calculated for explosions in the Sasolburg coal mining area. The result of k » 0.1 s is slightly higher than for central European explosions with k = 0.08 s (Malagnini, Herrmann, and Koch, 2000) but, as expected, is double the value of k calculated for the Far West Rand mining-related events. The higher value for k could indicate that the magnitude of the volumetric component (explosion) is much larger than that of the shear component and that the waves have travelled twice through the highly attenuating near-surface layers. The higher standard deviation of ± 0.038 for k may be ascribed to inhomogeneous near-surface attenuation where rock properties may change abruptly in the upper 1-3 km of the crust.
The purpose of this investigation was to derive a value for mining-related k that will be useful for the attenuation relation required by spectral analysis when calculating moment magnitude, Mw, for S-waves using the seismograms recorded by the National Seismograph Network. The higher value derived for k from mining-related events may be employed as a way to correct the source spectrum for additional attenuation at the focus and for the implosive component. If this procedure is sound, it will be possible to develop the method into a standard procedure to calculate seismic moment (and hence moment magnitude) as well as corner frequency (and, as a result, stress drop) for events related to the mining areas of South Africa. Ultimately, seismic moments calculated with this technique must be validated against those determined by international agencies such as the National Earthquake Information Centre in the USA (NEIC). This presents a future challenge for South Africa as the level of seismicity is low and the country is surrounded on three sides by ocean with only a few seismographs installed on remote islands. Hardly any seismic events are assigned surface wave and/or body wave magnitudes by NEIC. Even fewer, if any, events are reported with seismic moments.
Owing to the limited frequency range of 4-9 Hz of the foregoing analysis, k should not be extrapolated in the context of strong ground motion engineering applications to frequencies beyond 9 Hz.
Acknowledgements
This research was funded as part of the operation and data analysis of the South African National Seismograph Network. I wish to thank the Council for Geoscience for permission to publish the results. Zahn Nel undertook the language editing.
References
Andersen, J.G. and Hough, S.E. 1984. A model for the shape of the Fourier amplitude spectrum of acceleration at high frequencies. Bulletin of the Seismological Society of America, vol. 74. pp. 1969-1993. [ Links ]
Atkinson, G.M. 1996. The high-frequency shape of the source spectrum for earthquakes in eastern and western Canada. Bulletin of the Seismological Society of America, vol. 86. pp. 106-112. [ Links ]
Birch, D.J., Cichowicz, A., and Grobbelaar, D. 2015. Q-coda estimation in the Kaapvaal craton. Journal of the Southern African Institute of Mining and Metallurgy, vol. 115. pp. 541-548. [ Links ]
Brandt, M.B.C. 2014. Focal depths of South African earthquakes and mine events. Journal of the Southern African Institute of Mining and Metallurgy, vol. 114. pp. 1-8. [ Links ]
Brandt, M.B.C. 2015. Qc and Qs wave attenuation of South African earthquakes. Journal of Seismology. doi 10.1007/s10950-015-9536-6 [ Links ]
Brune, J.N. 1970. Tectonic stress and the spectra of seismic shear waves from earthquakes. Journal of Geophysical Research, vol. 75. pp. 4997-5009. [ Links ]
Brune, J.N. 1971. Correction. Journal of Geophysical Research, vol. 76. p. 5002. [ Links ]
Douglas, J., Gehl, P., Bonilla, L.F., and Gelis, C. 2010. A kappa model for mainland France. Pure and Applied Geophysics, vol. 167. pp. 1303-1315. doi: 10.1007/s00024-010-0146-5 [ Links ]
Fernández, A.I., Castro, R.R., and Huerta, C.I. 2010. The spectral decay parameter kappa in northeasten Sonora, Mexico. 2010. Bulletin of the Seismological Society of America, vol. 100. pp. 196-206. [ Links ]
García, J.M., Romacho, M.D., and Jimenes, A. 2004. Determination of near- surface attenuation, with k parameter, to obtain the seismic moment, stress drop, source dimension and seismic energy for microearthquakes in the Granada basin (Southern Spain). Physics of the Earth and Planetary Interiors, vol. 141. pp. 9-26. [ Links ]
Havskov, J. and Ottemoller, L. 2010a. SEISAN earthquake analysis software for Windows, Solaris, Linux and Macosx. Ver. 8.3. University of Bergen, Norway. [ Links ]
Havskov, J. and Ottemõller, L. 2010b. Routine data processing in earthquake seismology. Springer Science + Business Media. 347 pp. doi: 10.1007/978-90-481-8697-6 [ Links ]
Kilb, D., Biasi, G., Anderson, J., Brune, J., Peng, Z., and Vernon, F.L. 2012. A comparison of spectral parameter kappa from small and moderate earthquakes using Southern California ANZA seismic network data. Bulletin of the Seismological Society of America, vol. 102. pp. 284-300. [ Links ]
Kvamme, L.B. and Havskov, J. 1989. Q in southern Norway. Bulletin of the Seismological Society of America, vol. 79. pp. 1575-1588. [ Links ]
Kvamme, L.B., Hansen, R.A., and Bungum, H. 1995. Seismic-source and wave- propagation effects of Lg waves in Scandinavia. Geophysical Journal International, vol. 120. pp. 525-536. [ Links ]
Malagnini, L., Herrmann, R.B., and Koch, K. 2000. Regional ground-motion scaling in Central Europe. Bulletin of the Seismological Society of America, vol. 90. pp. 1052-1061. [ Links ]
Mcgarr, A. 2002. Control of strong ground motion of mining-induced earthquakes by the strength of seismic rock mass. Journal of the South African Institute of Mining and Metallurgy, vol. 102. pp. 225-229. [ Links ]
Saunders, I., Brandt, M.B.C., Steyn, J., Roblin, D.L., and Kijko, A. 2008. The South African National Seismograph Network. Seismological Research Letters, vol. 79. pp. 203-210. doi: 10.1785/gssrl.79.2.203 [ Links ]
Stein, S. and Wysession, M. 2003. Introduction to Seismology, Earthquakes and Earth Structure. Blackwell. 498 pp. [ Links ]
Paper received Dec. 2015
Revised paper received Mar. 2017

