Services on Demand
Article
Indicators
Related links
-
 Cited by Google
 -
 Similars in Google
Share
Journal of the Southern African Institute of Mining and Metallurgy
On-line version ISSN 2411-9717
Print version ISSN 2225-6253
J. S. Afr. Inst. Min. Metall. vol.117 n.5 Johannesburg May. 2017
http://dx.doi.org/10.17159/2411-9717/2017/v117n5a11
PAPERS OF GENERAL INTEREST
Methodology for evaluation of mud rush risk in block caving mining
J. VallejosI, II; K. BasaureI, II; S. PalmaI, II, III; R.L. CastroI, II
IAdvanced Mining Technology Center, University of Chile, Santiago, Chile
IIBlock Caving Laboratory, Department of Mining Engineering, University of Chile, Santiago, Chile
IIISchool of Civil Engineering, The University of Queensland, Brisbane, Australia
SYNOPSIS
Mud rushes are sudden inflows of fine wet ore within underground mines; they can harm people and equipment as well as cause production delays. Block and panel caving mines are prone to mud rushes in their production levels, with mud flowing from the drawpoints. Different mines have developed methods to control drawpoint conditions and thus perform safe ore extraction. The aim of this study is to develop a decision matrix and apply it to samples from drawpoints for the Diablo Regimiento mine, Codelco, El Teniente Division (Chile). The Abrams's Cone was used to perform slump tests on mud samples and characterize their consistency by setting the saturation degree and packing. The unconfined strength for different saturation degrees and packing was then evaluated. The results show that conditions for fluid response in slump tests correspond to conditions for low strength in unconfined compression tests. We also found the water content value at which the flowing consistency changes from plastic to soft behaviour according to the slump test classification for each sample. This value varied between 12.2% and 16.9%, depending on the sample tested. Finally, a fluid security factor was defined in order to design an extraction pattern for the samples tested, based on the water content. We conclude that a very densely packed ore is not prone to flowing. The flow properties depend strongly on the specific properties of the ore tested, and consequently a specific criterion should be developed for different types of ore at a particular mine. The criterion developed for Diablo Regimiento ore provides critical water content values from 11% to 15%, depending on the ore type.
Keywords: mud rush, block caving, risk evaluation.
Introduction
Block/panel caving has the lowest cost and the highest production rates of all underground methods (Heslop, 2000; Hubert et al., 2000). Good management of the risks is important to ensure the security of personnel and infrastructure. Operational risks for the method include rockbursts, air blasts, and mud rushes (Hubert et al. 2000). A mud rush is defined as a sudden inflow of mud from a drawpoint or other underground opening into the mine (Butcher, Joughin, and Stacey, 2000; Butcher, Stacey, and Joughin, 2005). Mud rushes can cause dilution, production delays, and damage to equipment as well as injuries and fatalities. The elements necessary for mud rushes are mud-forming material, disturbances, a discharge point, and water (Butcher, Joughin, and Stacey, 2000). All these elements are present in block/panel caving mines. Mud-forming material comes from ore milled by the caving process; water comes from underground and surface sources. Drawpoints in the production level are discharge points for the mud. Finally, several types of disturbance could trigger the mud rush phenomena: blasting, earthquakes, operation of equipment (Call & Nicholas, Freeport McMoRan, and Hydrologic Consultants, 1998; Jakubec, Clayton, and Guest, 2012), arch collapse above drawbells (Butcher, Joughin, and Stacey, 2000; Butcher, Stacey, and Joughin, 2005; Jakubec, Clayton, and Guest, 2012) and ore drawing (Butcher, Joughin, and Stacey, 2000; Butcher, Stacey, and Joughin, 2005; Call & Nicholas, Freeport McMoRan, and Hydrologic Consultants, 1998; Jakubec, Clayton, and Guest, 2012).
Shear strength loss is considered in two mechanisms for mud rushes postulated by different authors: an increase in water content that changes the mud properties, thus decreasing the shear strength (Butcher, Stacey, and Joughin, 2005; Jakubec, Clayton, and Guest, 2012); and induced pore pressure that causes sudden strength loss (Call & Nicholas, Freeport McMoRan, and Hydrologic Consultants, 1998; Jakubec, Clayton, and Guest, 2012). In this paper we focus on one aspect and study the impact of the variation in the water content, which modifies the mechanical properties of mud ore. Samples were taken from Diablo Regimiento sector (DR), El Teniente Mine, Codelco, Chile, located in the Andes Mountains, 80 km southeast from Santiago, where the mining method employed is panel caving. The aim is to present a method for risk classification of ore in drawpoints in order to prevent the uncontrolled flow of ore into the mine.
Background
Relevant risk classification
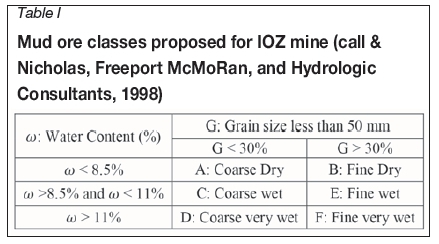
Mud ore from IOZ mine, Freeport, Indonesia was characterized geotechnically by Call & Nicholas, Freeport McMoRan, and Hydrologic Consultants (1998). It was concluded that size distribution of the ore involved in mud rushes was >20% <2 mm. Additionally, at saturations greater than 80%, the material was prone to liquefaction due to the excess pore pressure. The density of the ore pile in drawpoints was also measured in order to establish the water content at which the ore reaches 80% saturation. Finally, a classification system was proposed, which recommends a draw procedure depending on the grain size and water content of ore in drawpoints. Six classes for mud ore were defined, each associated with a recommendation of how the ore should be drawn. The classes defined for IOZ mine are summarized in Table I. Classes A and B were recommended to be drawn with any loader with even draw and twice-weekly checking for changes. C and D were recommended to be drawn with a closed cabin loader with supervision, even draw, dry ore blend, and twice-weekly checking for changes. Classes E and F were recommended to be drawn with remote loader, supervision, checking for changes every shift, and at least six buckets per shift drawing. The water content of this classification system was established specifically for IOZ ore, and a different material requires a new water content evaluation. Furthermore, the density measured in the ore pile could differ from that in the ore column, as the degree of saturation depends on density. This method could be inaccurate for predicting the risk of mud rushes that involve the ore column, since it uses only the density of the ore pile for water content recommendations. Finally, drawing recommendations are fitted to IOZ-specific shovels and mine conditions; a different mine will require different, specific recommendations.
El Teniente mine uses a criterion based on historical data on ore grain size and water content from seven drawpoints in which a mud rush has taken place. A risk classification (Becerra, 2011) with three classes is defined: normal condition (NC), in observation (IO), and critical risk (CR). Table II summarizes the grain sizes and moisture contents for risk classification at El Teniente. The use of seven cases with historical data from different sectors of El Teniente can be inaccurate for predicting the risk in particular zones and for different types of ore.
Both IOZ and El Teniente use grain size and water content to classify ore in drawpoints. The criterion for IOZ (Table I) is based on geotechnical characterization of six samples (Call & Nicholas, Freeport McMoRan, and Hydrologic Consultants, 1998); for El Teniente's criterion, historical data from seven events is used (Becerra 2011). One difference in these criteria is the grain size: IOZ uses 5 cm as the relevant grain size and El Teniente uses 25 cm. Another difference is that the El Teniente classification takes coarse grain size as a 'critical risk' if moisture content is more than 10%, while IOZ only recommends use of a closed cabin loader for the same condition.
The type of clay in ore from different drawpoints can play a crucial role in water-absorbing properties and consequently in flow risk evaluation (Call & Nicholas, Freeport McMoRan, and Hydrologic Consultants, 1998). Also, the influence of density must be considered in the physical characterization of the ore. In order to develop an improved classification system it is necessary to characterize the behaviour of specific ores, using not only the water content and degree of saturation, but also relating those parameters to density. In this paper a new method is proposed to develop classification systems for specific ores, based on a simple characterization of ore with different densities and saturation values.
Density and water content
In the previous section we presented relevant criteria for ore evaluation, depending on the water content, which is easy to measure in the laboratory. As mentioned in the introduction, one of the mud rush mechanisms is an increase in water content. In granular materials the water content is mostly held in the voids between the solid particles. A granular material with high density has fewer voids than the same material with a low density; consequently a material with high density can hold less water than a low-density material. This is why the importance of density is emphasized when water content is involved. The density of mud in the ore column is uncertain because of the changes caused by the ore flow, by which the density changes as material is extracted from draw points, as demonstrated by Kvapil (1992). Nevertheless, the range of density that can develop in a certain granular material can be calculated by measuring its minimum and maximum void ratios. The range of maximum and minimum void ratio is used to define the relative density (RD), which assigns a value of zero to the maximum void ratio (emax) and 100% to the minimum void ratio (emin). Equation [1] shows the RD parameter defined by maximum and minimum void ratios.
Saturation is the ratio between the volume of water and volume of voids. Consequently, it depends on the void ratio and water content, and therefore is an important parameter for mud rush risk evaluation. Previous studies have posited a direct relationship between saturation and mud rush risk (Becerra, 2011; Call & Nicholas, Freeport McMoRan, and Hydrologic Consultants, 1998). Equation [2] shows the relationship between void ratio (e), saturation (5), water content (ω), and specific gravity (Gs).

where specific gravity is the unit weight of solid divided by the unit weight of water , and the water content is the ratio of water weight to solid weight (Lambe and Whitman, 1969). In the next section these parameters are used as inputs for testing the mud samples.
Materials and methods
Samples
Tests were performed on three samples obtained from the Diablo Regimiento sector, El Teniente mine. In this sector, three types of mud ore have been identified by visual characterization according to mine personnel: (1) grey mud, (2) yellow mud, and (3) mixture mud, which are associated with sulphide, oxide, and a mixture of sulphide and oxide minerals respectively. The three samples were collected from different drawpoints, each sample representing one of the above types of mud. The drawpoints chosen for sampling extraction are classified in critical risk categories according to the risk classification used at El Teniente (Becerra, 2011). Table III lists the samples with their descriptions and compositions. The sampling was undertaken by mine personnel responsible for water content control, using a hand shovel to extract increments across the drawpoint on a horizontal level 1.5 m above the floor. This method is regularly used at El Teniente for the representative sampling of mud ore for water content control. The samples were packed and transported in sealed plastic bags to the laboratory.
Experimental method
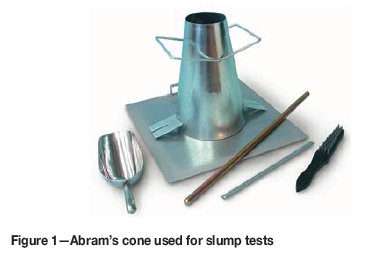
Samples were tested in the Solids Laboratory facilities of the Civil Engineering Department at the Universidad de Chile. Slump tests were carried out in order to classify the behaviour of mud ore based on the slump results for different conditions. The grain sizes of the samples were 95% <5 cm. Slump tests were performed using an Abram's cone - a standard metal mould (according to ASTM C143 standard) shaped as the surface of a frustum cone, with a base of 200 mm diameter, top of 100 mm diameter, and height of 300 mm (Figure 1). The mould is filled with material through the top while the base is placed on a flat surface, and is then removed vertically. The slump is the difference between the height of the mould and the height of the material, which is measured with 1 mm precision immediately after the mould has been removed.
We also conducted unconfined compression tests in order to compare the slump behaviour results with the unconfined strength (in units of kPa). Unconfined compression testing involves axial loading of a cylindrical specimen in a strain-controlled device until failure (according to ASTM D2166 standard). Force and strain are measured with 0.001 kN and 0.001 mm precision respectively. The test ends when the force decreases or the vertical strain reaches 20%. The initial cross-sectional area (A0) is measured from the average of nine diameter measurements; it is corrected during the test depending on the vertical strain (ε) according to Equation [3].

In this study, slump tests and unconfined compression tests were carried out at different degrees of saturation and relative densities. Table IV lists the values of the variables set for each slump test, and Table V the values for each unconfined compression test. Three different relative densities and saturations were used for each sample, resulting in nine tests for each sample. The variables were carefully set when the mould was filled, by calculating the water content and mass necessary for each combination. For the slump tests, the mould was filled in three layers in order to obtain a uniform density of material inside. For unconfined compression, the mould was filled with five layers.
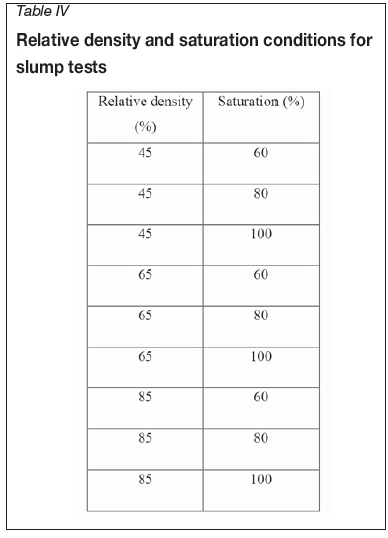
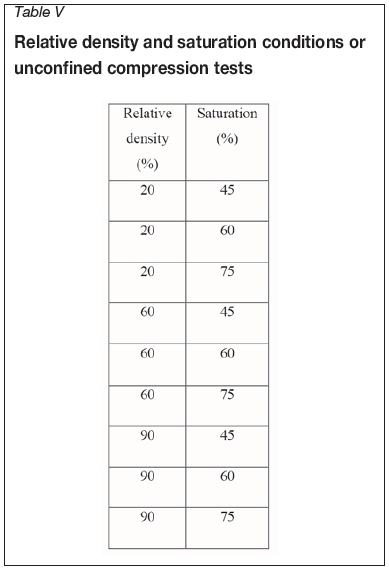
Geotechnical indexes of specific gravity and maximum and minimum void ratios were obtained in order to set variables from Tables IV and V according to Equations [1] and [2]. Specific gravity was obtained using two different methods, depending on the grain size. For particle sizes smaller than 4.75 mm the water pycnometer method was used. For the particle sizes greater than 4.75 mm, Archimedes' method used (the dry weight divided by the difference between the dry weight and the weight while submerged under water). The maximum void ratio was obtained by pouring the material into a cylindrical mould of known volume to obtain the minimum density (according to the ASTM D4254 standard). The minimum void ratio was obtained using a modified Proctor test, in which the material is compacted in layers within a container of known volume (according to the ASTM D1557 standard).
Risk classification
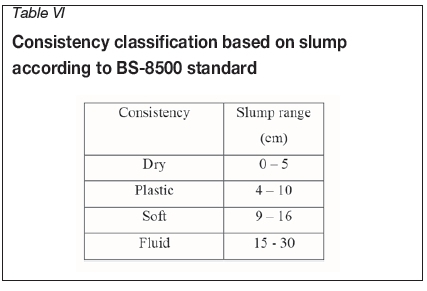
In order to develop a risk classification decision matrix, the classification system for concretes presented in Table VIII was used. Each consistency represents one type of behaviour of the ore. The slump corresponding to dry and plastic consistency is classified as non-flowing behaviour, and a soft or greater slump as flowing behaviour. The aim is to ascertain the minimum water content for each sample at which the slump changes from plastic to soft behaviour; this value is termed the fluid limit (FL). In order to find the FL the slump is plotted versus the water content, thus drawing curves for slump results at the same degree of saturation. The required water content values are given by the intercept between the plastic-soft limit (9.5 cm of slump) and each saturation curve. Finally, the minimum water content is selected as the FL for each sample.
Results
Tesfs
The geotechnical indexes obtained are presented in Table VII. These indexes are necessary to set the conditions for the unconfined compression and slump test according to Equations [1] and [2]. The three samples have similar specific gravities and maximum and minimum void ratios; sample 2 tends to have higher void ratios.
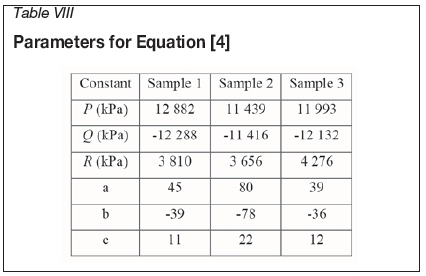
The results for unconfined compression strength are shown in Figure 2. The strength increases with RD and decreases with saturation. The parameters were obtained by fitting data, in order to ascertain the effect of RD and saturation on the strength. The equation has six experimental adjustment parameters (p, q, r, a, b, c), and Table VIII shows the values obtained for these constants for the three samples. Here, Usis the unconfined strength for a given RD and saturation (S). Figure 2 also shows the curves for 80% and 100% saturation according to Equation [4] and the parameters in Table VIII.

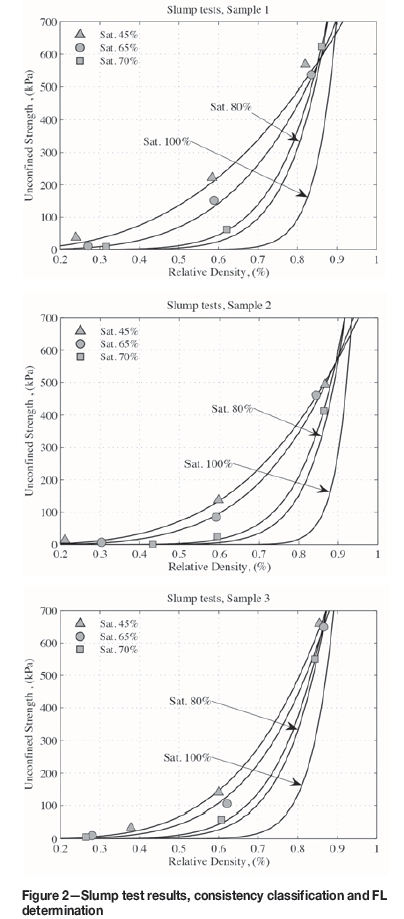
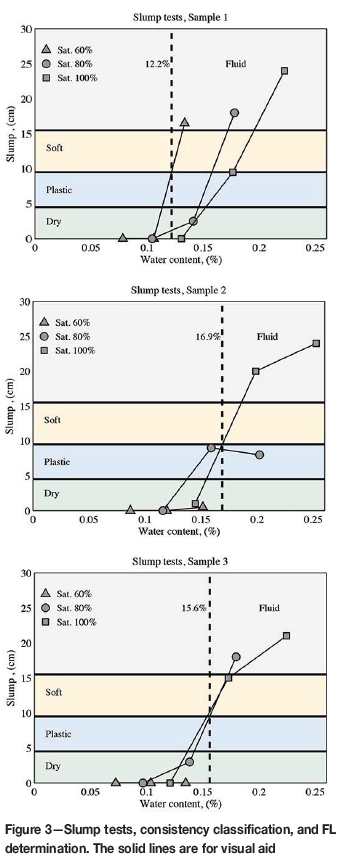
Figure 3 shows the results of the slump tests: the vertical axis shows the slump and the horizontal axis the water content. Each curve shows a different saturation degree, so there are also three states of compaction represented on each curve. Horizontal divisions indicate different classes of consistency depending on the slump, according to Table VI. Figure 3 reveals that slump increases with increasing saturation, but decreases with increasing relative density. A RD of 85% indicates a dry consistency for all cases. The oxide sample requires 100% saturation to reach fluid consistency, the mixed sample requires 80% saturation, and the sulphide sample requires only 60% saturation. Vertical dashed lines show the value of the fluid limit (FL). Water content values obtained from this intercept indicate that sample 1 (sulphide mud) is prone to flow at a lower water content than the other samples: 12.2% compared with 16.9% for sample 2 (oxide mud) and 15.6% for sample 3 (mix). Equation [4] was used to calculate unconfined strength using the conditions for the slump tests (Table IV). In Table VII all the results for slump, the consistency category, and unconfined strength are summarized using Equation [4]. Fluid and liquid states are achieved with an unconfined compressive strength of less than 46 kPa. Nevertheless, in some cases the Usis very low with a dry consistency (RD 45% and 60% saturation). These cases imply that Equation [4] is not entirely valid for explaining slump, and the values obtained should be used only as reference values, owing to the fact that the range of saturation was different for slump tests and unconfined compression tests.
Risk classification
The consistency fluid limits (FL) from Figure 2 were used to define a fluid security factor (SFf):

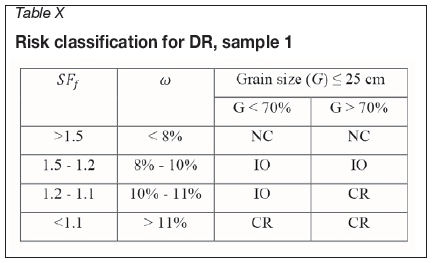
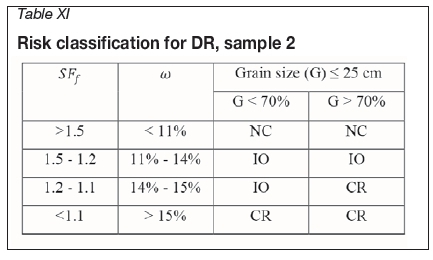
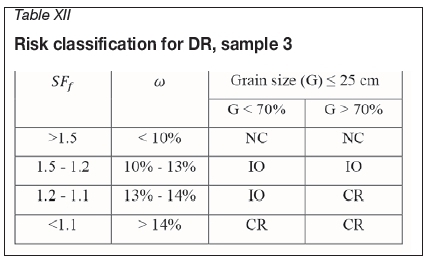
where ω is water content. The water content for the risk classification for DR drawpoints are shown in Tables X, XI, and XII for samples 1, 2, and 3, respectively. Each pattern is specific for each mud type. Sample 1 has lower water content values for the same risk level than the other samples. The last row in each table contains the critical water content value at which the drawpoint is classified as critical risk regardless of the grain size.
Discussion and conclusions
Different mud rush risk and operational criteria have been developed in the past, all based on grain size and water content. The El Teniente criterion does not take into account differences in the behaviour of ore due to compositional variation. The IOZ criterion assumed a constant density. The method presented in this study is specific for DR-type ore, and also takes density into account. A highly compacted ore is not able to flow, whereas medium-compact and loose ores can flow, depending on their saturation values: the higher the saturation, the greater the propensity to flow. The water contents required for flow behaviour were determined as 12.2% for sulphide ore, 16.9% for oxide ore, and 15.6% for mixed ore. Consequently, different samples have different propensities to flow with the same water content; sulphide ore is more prone to flow than oxide and mixed ore. The application of the developed criterion for drawpoint ore classification provides different critical values for water content: 11% for sulphide ore, 15% for oxide ore, and 14% for mixed ore. In order to improve the mine's production, a criterion for each ore type must be developed, thus enabling operation of the drawpoint until the ore reaches its critical value for specific water content. If a general mine criterion is developed, the criterion with the minimum water content value should be selected. In this case, sample 1 (sulphide) has the lowest values for water content, with 11% being the critical value.
Acknowledgments
The authors acknowledge the support of the Department of Mining Engineering and the Advanced Mining Technology Center of the University of Chile and Codelco, Chile. Additionally, we would like to thank Dr Adeline Delonca for her comments on the article.
References
Becerra, C. 2011. Controlling draw points prone to pumping. El Teniente Division, Codelco, Chile. Proceedings of the 2nd International Seminar on Geologyfor the Mining Industry (Geomin 2011), Antofagasta, Chile, 8-10 June 2011. Session 7: Mine Production Geology / Geometallurgy. Gecamin, Santiago, Chile. [ Links ]
Butcher, R., Joughin, W., and Stacey, T.R. 2000. Methods of combating mud rushes in diamond and base metal mines. Safety in Mines Research Advisory Committee (SIMRAC), Johannesburg. [ Links ]
Butcher, R., Stacey, T., and Joughin, W. 2005. Mud rushes and methods of combating them. Journal of the South African Institute of Mining and Metallurgy, vol. 105. pp. 807-824. [ Links ]
Call & Nicholas Inc., Freeport McMoRan Copper and Gold, Co., and Hydrologic Consultants, Inc. 1998. IOZ wet muck study. [ Links ]
Heslop, T. 2000. Block caving - controllable risks and fatal flaws. Proceedings of Massmin 2000, Brisbane, Australia, 29 October-2 November. Australasian Institute of Mining and Metallurgy, Melbourne. [ Links ]
Hubert, G., Dirdjosuwondo, S., Plaisance, R., and Thomas, L. 2000. Tele- operation at Freeport to reduce wet muck hazards. Proceedings of Massmin 2000, Brisbane, Australia, 29 October-2 November. Australasian Institute of Mining and Metallurgy, Melbourne. [ Links ]
Jakubec, J., Clayton, R., and Guest, A. 2012. Mud rush risk evaluation. Proceedings of Massmin 2012, Sudbury, Ontario, 10-14 June 2012. Canadian Institute of Mining, Metallurgy and Petroleum, Montreal. [ Links ]
Kvapil, R. 1992. Sublevel caving. SME Mining Engineering Handbook (2nd edn). Society for Mining, Metallurgy and Exploration, Littleton, CO. Chapter 20.2. [ Links ]
Lacy W. and Lacy J. 1992. History of mining. SME Mining Engineering Handbook (2nd edn). Society for Mining, Metallurgy and Exploration, Littleton, CO. Chapter 1.1. [ Links ]
Lambe W. and Whitman R. 1969. Soil Mechanics. Massachusetts Institute of Technology. Chapters 3, 9, and 27. [ Links ]
Tapia, C. 2011. Definition of potential mudflows from extraction points at Rio Blanco underground mine. Proceedings of the 2nd International Seminar on Geologyfor the Mining Industry (Geomin 2011), Antofagasta, Chile, 8-10 June 2011. Session 7: Mine Production Geology / Geometallurgy. Gecamin, Santiago, Chile. [ Links ]
Paper received Apr. 2016
revised paper received Feb. 2017


