


Services on Demand
Article
 English (pdf)
 Article in xml format
 Article references
Indicators

Related links
-
 Cited by Google
 -
 Similars in Google
Share

 Permalink
Journal of the Southern African Institute of Mining and Metallurgy
On-line version ISSN 2411-9717
Print version ISSN 2225-6253
J. S. Afr. Inst. Min. Metall. vol.117 n.5 Johannesburg May. 2017
http://dx.doi.org/10.17159/2411-9717/2017/v117n5a5
HEAVY MINERALS CONFERENCE PAPERS
The influence of trash minerals and agglomerate particles on spiral separation performance
J. GroblerI; J. ZietsmanII
IExxaro Metallurgical Services, Pretoria, South Africa
IIEx-Mente, Pretoria, South Africa
SYNOPSIS
Understanding the influence of feed material mineral assemblage on spiral separation is paramount for the successful and consistent operation of a spiral plant. Plant stability is required to maintain high recovery of valuable heavy minerals (VHM). Standard material analysis methods used in the heavy mineral industry to evaluate spiral separation behaviour are unable to quantify performance differences in the case of large variations in feed assemblage. This study illustrates a systematic approach to evaluate spiral separation performance. This technique was applied on a four-stage spiral plant. The performance information was used in a circuit simulation to clearly illustrate the importance of correct setting of the spiral splitter position and resulting spiral mass loading to ensure optimal circuit stability and maximum VHM recovery.
Keywords: spiral separation, zircon, recovery, optimization.
Introduction
Heavy mineral sands deposits generally consist of naturally fine-grained, free-flowing sand due to the way in which the deposit was formed. The size of the heavy minerals market is roughly 8 Mt/a of zircon and titanium combined (Iluka, 2013). If an average combined feed grade of 5% zircon and titanium and an average combined overall product recovery of 80% are assumed, the resulting run-of-mine feed tons that would require primary spiral beneficiation is 200 Mt/a. The number of spirals required for the processing of this material, assuming 6500 operating hours per annum, an average of 2 t/h per start, and the same number of rougher spirals as other duty spirals, is over 30 000 spirals for the heavy mineral sands business alone. These numbers clearly illustrate the importance of the spiral in the heavy mineral industry.
The aim of a spiral plant in the primary processing value chain of a heavy mineral process is to reject non-valuable quartz (a light mineral) from various valuable heavy minerals (VHM). The product from the spiral plant is a heavy mineral concentrate that has a reasonable grade (more than 90% heavy minerals) at a reasonable heavy mineral recovery (greater than 90%). This benchmark is fairly easy to achieve if all the mineral particles are well liberated (as in the case of free-flowing sand), the feed is properly deslimed (-45 Mm fraction removed to less than 5% of the solids mass), and the spirals are fed within design solids concentration (water to solids ratio) and design spiral load (dry tons per hour per start).
Consistently achieving a high-grade heavy mineral concentrate at high valuable mineral recovery is paramount to business success. The forecast VHM recovery (especially of zircon) is an important input into monthly and annual budgets. A 10% decline in zircon recovery over a month equates to significant revenue losses for a medium-sized operation, without considering other valuable mineral losses. The quick investigation and understanding of the reasons for a decline in zircon recovery and an appropriate response with corrective actions can save the business millions of dollars. The purpose of this article is to illustrate the systematic approach that was followed to identify recovery losses of a typical four-stage spiral circuit and the corrective actions taken to minimize the impact.
Procedure
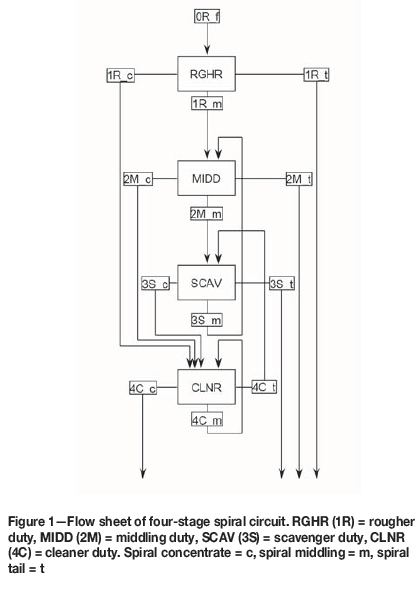
The spiral plant that was evaluated in this study has four separation stages, as indicated in Figure 1. The first three duties are all equipped with Mineral Technology MG6.3 spirals and the final cleaner stage utilizes Mineral Technology HG10S spirals. The primary performance indicator of the plant is zircon recovery, which is determined by the two-product formula (using XRF assay of ZrO2 in the feed, concentrate, and combined tail stream). Three Vezin samplers take composite samples of these three streams on a four-hourly basis. This study was initiated after a 10% decline in zircon recovery that persisted for a considerable period. This decline was correlated with changes in plant feed material. However, since there were large volumes of this feed material, the plant had to process it at the highest achievable zircon recovery.
The following procedure was applied to minimize the zircon losses while maintaining a reasonable zircon product grade for the downstream process.
► Theoretical maximum recovery: determine how much of the zircon in the feed is recoverable by spiral separation
► Feed mineral assemblage impact: determine the mineralogical composition of the feed material and assess what the impact is on the individual spiral separation
► Spiral circuit performance assessment: evaluate the performance of the spiral circuit by sampling the four duties. Apply mass balance techniques using the spiral duty mass splits and stream analyses
► Corrective measures: implement corrective measures based on the interpretation of the circuit performance results.
Each step is presented in the next four sections with a method description, followed by illustration and discussion of the results.
Step 1: determine theoretical maximum recovery
A spiral circuit feed sample was fractionated on a laboratory shaking table under controlled feed conditions. The sample was divided into four mass fractions based on the band colours. The first band constituted the 'clear black band', the second band constituted the 'other' coloured heavy minerals, the third band the fine quartz, and the last band the coarse tail particles. Figure 2 illustrates the coloured bands on the shaking table during fractionation for a condition of low trash, while Figure 3 illustrates the coloured bands for high trash content. Each mass fraction was assayed by X-ray fluorescence (XRF) and a recovery-yield curve was drawn (Figure 4). The shaking table result presents the best case, or theoretical maximum recovery that can be achieved for a specific feed material, since the shaking table provides sufficient separation space and separation time for each particle to reach its equilibrium position from a particle density, size, and shape perspective.
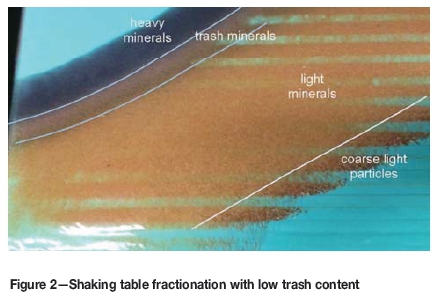
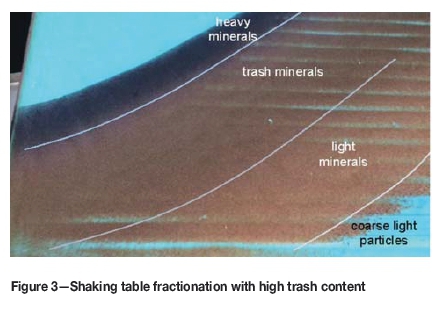
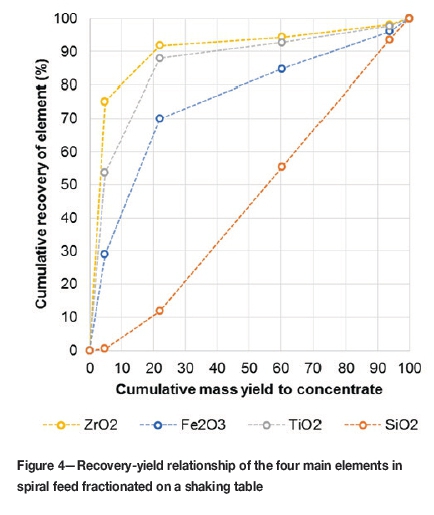
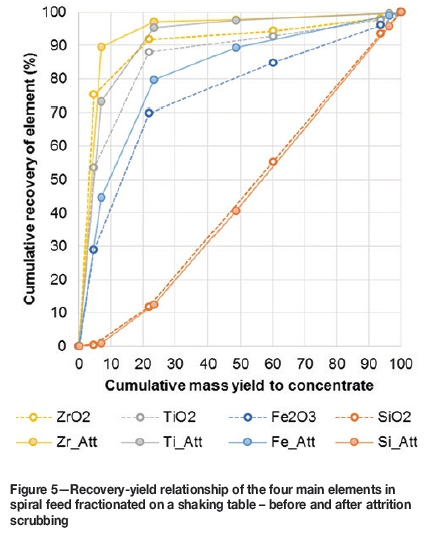
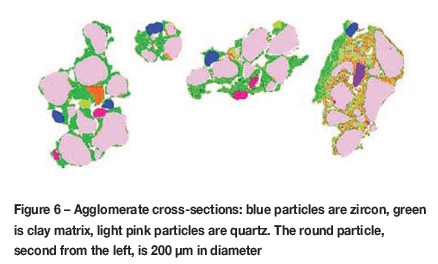
Figure 4 illustrates a 91% zircon recovery at 21% mass yield, which implies that 9% of the zircon is trapped in the remaining 79% of the mass. This zircon recovery is quite low, and further investigation indicated that fine agglomerates (less than 500 μιη) were present in the feed. These agglomerates trapped zircon particles (and other VHM) in a low-density clay and quartz matrix, causing them to be misplaced to the tail fraction. The same feed sample was attrition-scrubbed in a laboratory unit and processed on the shaking table after desliming. The result from the scrubbed feed fractionation is presented in Figure 5. A clear step change (5-10%) in recovery is apparent for all three of the heavy elements (Zr, Fe, and Ti), which shows that the VHM particles were liberated by the scrubbing process. Detailed QEMSCAN analyses of some of these agglomerates are illustrated in Figure 6. The spiral circuit is unable to recover the zircon contained in these agglomerates due to their combined low density, larger size, and irregular shape. This material needs to be liberated before it reaches the spiral circuit, and the spiral separation performance should be measured against a new 'baseline'. That is, a theoretical maximum recovery as achieved by the shaking table; 91% in the case of Figure 4. The results indicated in Figure 5 can be achieved only with improved feed preparation in the plant (milling and/or scrubbing) to liberate VHM from agglomerates prior to spiral separation, with significant power input.
Step 2: determine impact of feed mineral assemblage
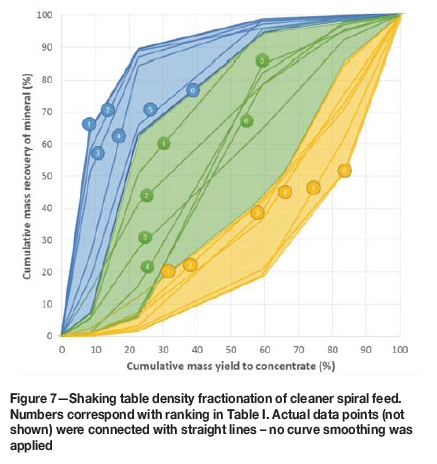
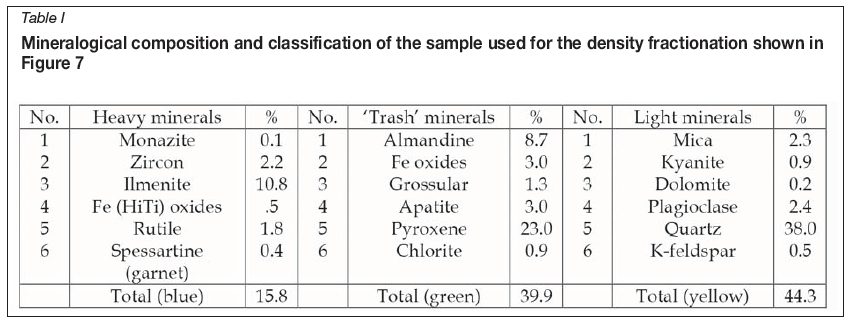
The feed mineral assemblage, especially the concentration of near-density heavy mineral particles, can have a significant impact on spiral recovery. The heavy mineral industry gets its name from the particle class 'heavy minerals'. Traditionally this class contains mineral particles that sink in an organic medium (usually tetrabromoethane or bromoform) with a liquid density of 2.96 g/cm3, and which constitute total heavy minerals (THM). The THM thus have a density greater than 2.96 g/cm3. These heavy mineral particles are further classified. Valuable heavy minerals (VHM, for example zircon, rutile, and ilmenite) usually have a density greater than 4 g/cm3. The term 'trash' is used to describe a particle class with a specific density range. In this article, that range is considered as being between 3 g/cm3 and 4 g/cm3, and therefore this material has an intermediate density between 'light' particles and 'heavy' particles. It is called trash because it contains no valuable or saleable minerals, but the minerals are considered as 'heavy' since their density is greater than 2.96 g/cm3. This paper makes reference to three distinct particle classes, heavy minerals (>4 g/cm3), trash minerals (3-4 g/cm3), and light minerals (<3 g/cm3). To illustrate the difference in separation response between these different mineral groupings, a shaking table fractionation was carried out on the cleaner spiral feed. The fractions were analysed by QEMSCAN to quantify the minerals present in the assemblage. Figure 7 illustrates the three density response bands, and Table I lists the mineral types and percentages in each band.
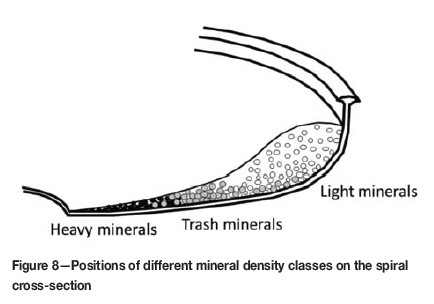
Since there is sufficient separation space on a shaking table the trash minerals can easily achieve their respective equilibrium positions. However, on a spiral the separation space is limited, and the residence time for separation is short (less than 15 seconds). Trash minerals will concentrate towards the middle of the spiral, between the heavy minerals and light minerals (Figure 8). This implies that there is probably a threshold of trash mineral content that can be accommodated on the spiral, beyond which separation will be adversely affected.
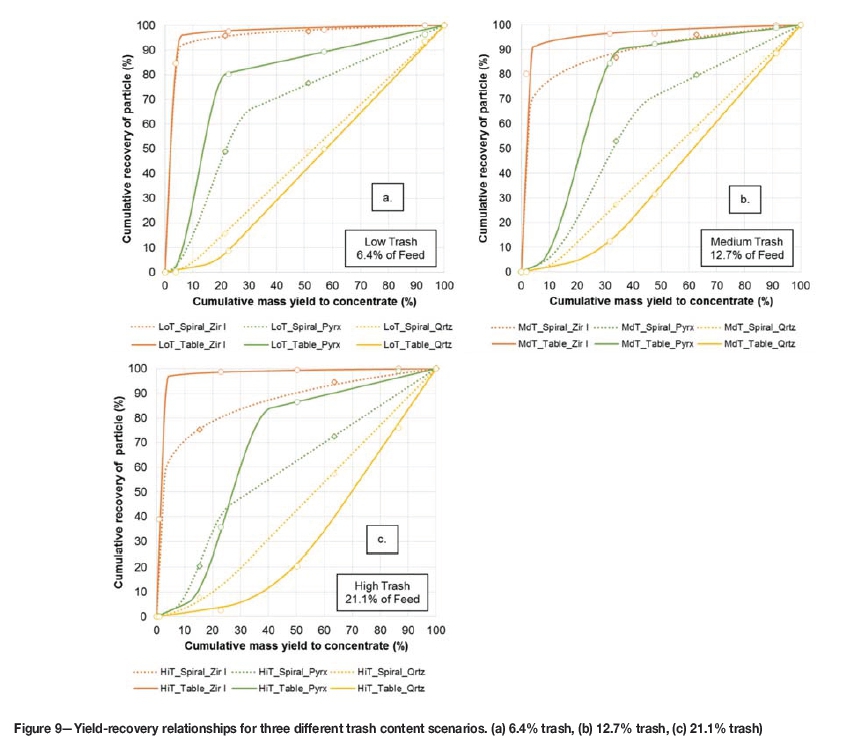
Literature reports on the influence of trash minerals on spiral separation are limited, since most mineral sands deposits contain low trash concentrations, seldom exceeding 5% of the mineral assemblage. In this investigation the trash mineral content was as high as 25%. To measure the impact of trash on spiral separation, shaking table separation response (ideal separation) was compared with spiral separation response (on the same spiral profile) for completely liberated particles with increasing trash content (three trash content scenarios, based on actual plant feed variation). QEMSCAN particle mineral analysis (PMA) enables the classification of particles into different quality classes. This analytical technique has been effectively applied in many other density fractionation studies (Grobler and Bosman, 2011). One of the PMA mineral classes is Zircon I, a clean, completely liberated particle with ZrO2 content greater than 66%. Zircon I was used as an indicator particle class to compare its recovery at different trash contents. The pyroxene particle class was selected as the most predominant trash mineral particle, and quartz was selected as the most predominant light mineral particle.
Figure 9 illustrates the three trash content scenarios. The enhanced Holland-Batt equation was used to fit the test work data points. This fitting technique for spiral data was described by Grobler, Naude, and Zietsman (2016). In all three feed scenarios the Zircon I recovery was above 95% for the shaking table. However, the Zircon I recovery for the spiral decreased significantly with increasing trash (from 95% to 83% to 78% at 20% mass yield to concentrate - Figure 9).
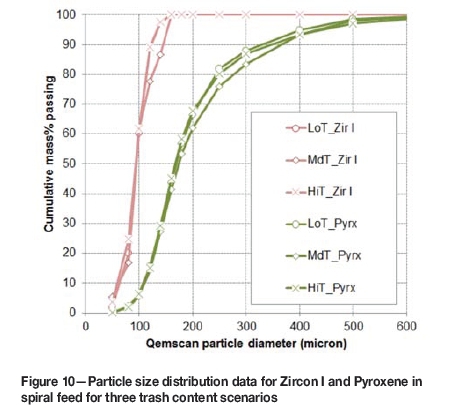
It is well known that particle size can also play a role in spiral separation (Grobler and Bosman, 2011). To illustrate that trash content had a more pronounced effect than particle size distribution, the particle size distributions of the three feed materials from Figure 9 were drawn up using the QEMSCAN size distribution data from the Zircon I and Pyroxene particle classes. Figure 10 illustrates that the particle size distributions were similar for the three trash content scenarios, while the spiral separation response (Figure 9) varied significantly due to the trash content itself.
The impact of unliberated zircon particles as well as trash content has been illustrated for the spiral in isolation; the next step is to determine the impact on the spiral circuit as a whole.
Step 3: spiral circuit performance assessment
The four-stage spiral circuit was sampled by selecting an individual spiral column in each spiral duty and taking a timed sample of the feed, concentrate, middling, and tail streams. Feed distribution checks were done beforehand to confirm that the selected spiral column was representative of the entire spiral duty. The feed to the rougher spiral bank was fractionated into four samples on the laboratory shaking table to determine the theoretical maximum recovery. The four spiral duty sample sets with the four shaking table fractions resulted in 20 samples, which were deslimed and assayed by XRF. No sink-float analyses were done. The XRF assays were used in a mass balance model using the Limn flow sheet processor (Excel add-in) to determine the mass-balanced zircon recovery considering the main elements in the mass balance solver. The circuit mass balance calculated the total mass yield contributions of the rougher duty tail, middling duty tail, and scavenger duty tail in relation to the mass yield to concentrate. Refer to Figure 1 for the spiral circuit flow sheet.
The following three feed scenarios were used to illustrate the impact of trash and agglomerates on the spiral circuit performance.
Case 1: the circuit was sampled under normal feed conditions when the circuit zircon recovery was at acceptable levels (above 90%).
Case 2: the circuit was sampled after the feed had changed and the zircon recovery declined by more than 15%, creating an unacceptable performance condition.
Case 3: the circuit was sampled after corrective measures were employed on the new feed condition to minimize zircon losses.
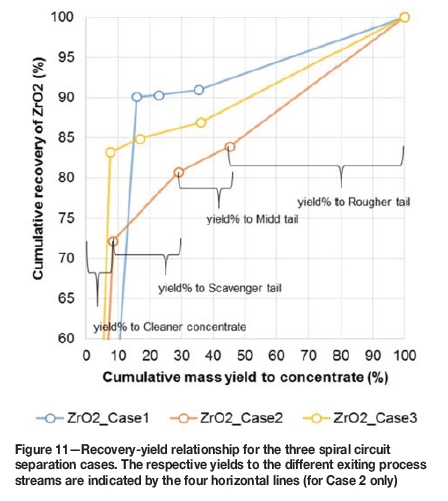
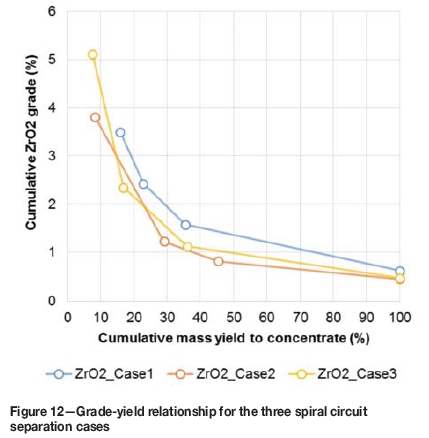
The three feed conditions are depicted in Table II. The trash content in the feed increased in cases 2 and 3, while the ZrO2 grade decreased. The most significant difference is shown in the zircon recovery for the three cases. Each of the three cases is discussed in the next three sections. Table III gives the normalized mass yield to the different tail and concentrate streams. The design load for middling and scavenger spirals is 2 t/h per start, and for the cleaner 1.85 t/h per start. Figure 11 gives the zircon recovery to concentrate response, and Figure 12 the zircon grade to concentrate response, over the entire mass yield spectrum.
Case 1: low-trash feed (normal feed conditions)
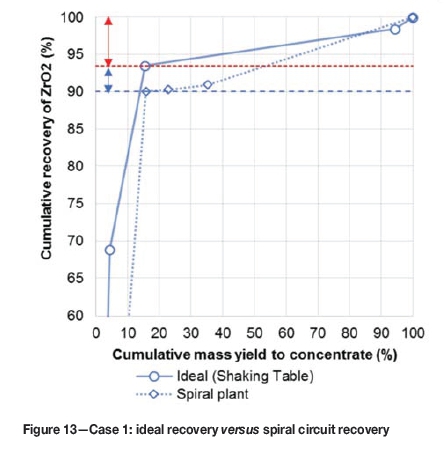
Figure 13 compares the ideal zircon recovery with spiral circuit zircon recovery. The ideal recovery was determined to be 94%, indicating that 6% of the zircon is not available for spiral concentration due to lack of liberation (indicated by the red arrow in Figure 13). The circuit zircon recovery response was 90%, which implies that 96% of the available zircon was successfully recovered by the four-stage spiral circuit. The trash content was at the low end at 11.1% (Table II). The downstream spiral loading (midd, scavenger, and cleaner) was acceptably low. Case 1 demonstrates an acceptable circuit separation response with high zircon recovery (96% with consideration of irrecoverable zircon) to concentrate, and the bulk of the zircon losses occurring in the rougher tail stream.
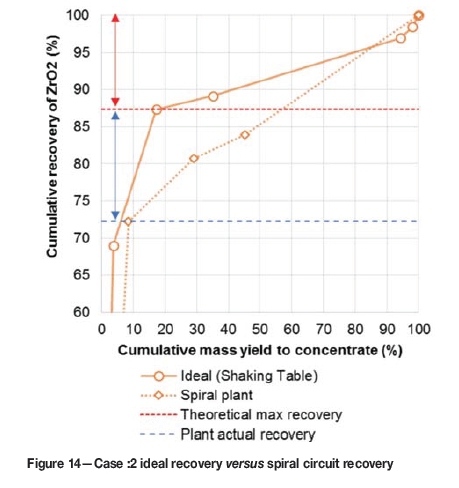
Case 2: high-trash feed conditions (normal operating conditions)
Figure 14 compares the ideal zircon recovery with spiral circuit zircon recovery. The ideal zircon recovery was determined to be 87%, indicating that 13% of the zircon is not available for spiral concentration due to lack of liberation (indicated by the red arrow in Figure 14). The circuit zircon recovery response was 72%, which implies that 83% of the available zircon was successfully recovered by the four-stage spiral circuit. The trash content was on the high end at 17.2% (Table II). The downstream spiral loading (midd, scavenger, and cleaner) was unacceptably high, with every spiral duty exceeding the design loading. Case 2 illustrates the impact that high feed trash content has on the spiral circuit. Firstly, it decreases the separation space and reduces the recovery potential on the spiral. Secondly, it increases the loading (tons per hour per start) on the downstream spiral duty, causing a further decrease in zircon recovery. These are the two main reasons for the drop in zircon recovery of 13%, from 96% in Case 1 to 83% in Case 2. Case 2 demonstrates an unacceptable circuit separation response with low zircon recovery to concentrate (only 83% with consideration of irrecoverable zircon), and zircon losses occurring in all three tail streams. A high zircon loss in the scavenger tail stream is a clear indication of overload in the spiral circuit.
Step 4: implement corrective measures
Since Case 2 resulted in an unacceptable zircon recovery, corrective measures were implemented in Case 3. The feed composition cannot be changed, therefore the only remaining control parameters are the operating conditions, total feed to the plant, and more specifically the spiral splitter positions.
Case 3: high-trash feed conditions (changed operating conditions)
Figure 15 compares the ideal zircon recovery with spiral circuit zircon recovery. The ideal zircon recovery was determined to be 90%, indicating that 10% of the zircon is not available for spiral concentration due to lack of liberation (indicated by the red arrow in Figure 15). No corrective measures could be applied to the ideal zircon recovery, since this depends on the nature of the feed material entering the spiral circuit and can only be addressed by upgrades in the feed preparation circuits, which was not part of this investigation. The trash content was at the high end (19%) as indicated in Table II. The feed trash content can be diluted by blending with other low-trash mining zones, but this was not part of this investigation since this feed condition persisted for a considerable period due to large volumes of this type of material being mined. The negative impact of trash on individual spiral performance has to be tolerated (Figure 9). However, the increased loading on the downstream spiral duties can be managed by the operational personnel.
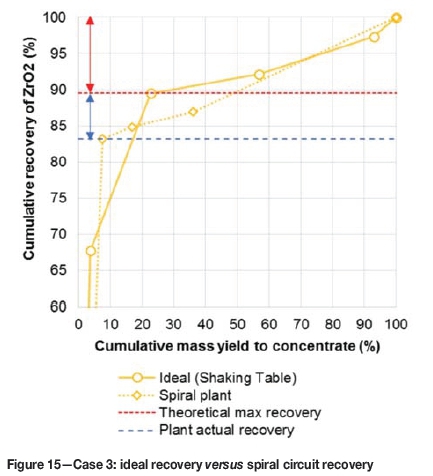
In Case 3 the tail splitters on the rougher and midd duties were opened 'abnormally' wide to reject mass to the rougher tail and midd tail streams. The rougher and midd duty outer splitter position was changed (set inward) by more than 60 mm due to the mass flow shift that occurred with the high percentage of trash in the feed. A splitter template was designed and implemented to set every spiral splitter in each duty at exactly the same position in the spiral trough. This counter-intuitive operational change rejected 85% of the feed mass to the rougher tail and midd tail steams (Case 3) instead of only 71% in Case 2, as shown in Table III. Table III further shows that the mass loading per spiral duty reduced to more acceptable levels for Case 3, with a significant decrease in recirculating loads.
After this intervention the overall circuit zircon recovery response was 83%, which implies that 93% of the recoverable zircon was successfully recovered to concentrate by the four-stage spiral circuit (indicated by the blue arrow in Figure 15). The change in spiral control approach resulted in a recovery increase of 10% (from Case 2 to Case 3, with consideration of irrecoverable zircon) while at the same time increasing the concentrate grade by more than 1% ZrO2 as indicated in Figure 12.
Conclusions
Trash mineral content in the feed to spiral plants is increasing as more 'difficult' mineral deposits are being beneficiated. It is therefore important to understand the impact of increased trash mineral content and unliberated minerals on an individual spiral profile, as well as on the spiral circuit as a whole.
QEMSCAN analyses provided important insight for differentiating between trash minerals and valuable heavy minerals, which can easily be misinterpreted when considering heavy mineral content (typical sink-float results) in new deposits or new mining areas of existing deposits. The characterization of the separation response of ideal feed material using a laboratory shaking table assisted considerably in identifying the portion of the recovery problem that addressed by the spiral operator, and the portion that is not.
Using different techniques simultaneously to measure the same initial observation can speed up understanding of the problem. The application of attrition scrubbing to liberate agglomerates and QEMSCAN to define the content of the agglomerates is an excellent example of this, resulting in a clear explanation of the 'irrecoverable' zircon phenomenon.
An increase in feed trash content was shown to adversely impact zircon recovery by decreasing the separation space on the spiral trough. An increase of trash from 6% to 21% resulted in a decrease in liberated zircon particle recovery from 95% to 80%. Limited operational control can be applied to reduce this impact, other than reducing the spiral loading to below design feed capacity.
An increase in feed trash content was shown to adversely impact the zircon recovery of the total circuit by increasing the load to the downstream circuits and increasing recirculating load, since a large portion of the mass moved to the middle of the spiral trough. This zircon recovery loss can be minimized by adjusting the spiral splitter to reject as much mass as possible (more than 85%) in the first two separation stages, resulting in a recovery improvement for recoverable zircon of more than 10%.
The mass balance of the spiral circuit enabled the measurement of the total circuit response. Although some effort is required to configure the calculations initially, it provides invaluable insight into the recirculating loads and interaction between different spiral separation duties. It is important to verify the mass balanced information with all available measurement data.
References
Grobler, J.D. and Bosman, J.B. 2011. Gravity separator performance evaluation using Qemscan® particle mineral analysis. Journal of the Southern African Institute of Mining and Metallurgy, vol. 111. pp. 401-408. [ Links ]
Grobler, J.D., Naude, N., and Zietsman, J.H. 2016. Enhanced Holland-Batt spline for describing spiral concentrator performance. Minerals Engineering, vol. 92. pp. 189-195. [ Links ]
Iluka. 2013. Mineral Sands Industry. Fact Book. http://www.zircon-association.org/Websites/zircon/images/The_Mineral_Sands_Industry_Factbook.pdf [accessed 4 January 2015]. [ Links ] ♦
This paper was first presented at the Heavy Minerals Conference 'Expanding the Horizon', 16-17 August 2016, Sun City, South Africa.

