


Services on Demand
Article
 English (pdf)
 Article in xml format
 Article references
Indicators

Related links
-
 Cited by Google
 -
 Similars in Google
Share

 Permalink
Journal of the Southern African Institute of Mining and Metallurgy
On-line version ISSN 2411-9717
Print version ISSN 2225-6253
J. S. Afr. Inst. Min. Metall. vol.117 n.5 Johannesburg May. 2017
http://dx.doi.org/10.17159/2411-9717/2017/v117n5a4
HEAVY MINERALS CONFERENCE PAPERS
Geotechnical characterization and 3D modelling of the biologically cemented Mandena heavy mineral sand deposit - a case study
L.I. BoshoffI; A.H. BrackenI; F. HeesII
ISRK Consulting, Johannesburg, South Africa
IIRio Tinto and Titanium-RTIT, Johannesburg, South Africa
SYNOPSIS
Biological cementation of the Mandena heavy mineral sand deposit in Madagascar was causing difficulty in dredge mining and hence in planning and control of production rates. An investigation was initiated to better evaluate the geotechnical properties of the orebody by defining the distribution and geotechnical properties of the cemented strata, in order to generate a site-specific geotechnical model for the deposit. The geotechnical characterization was developed by an integrated approach using several ground investigation techniques such as piezocone (CPTu) testing, geotechnical drilling, standard penetration testing (SPT), as well as laboratory testing. The final outcomes of the investigation included a 3D geotechnical model showing the distribution and extent of the cemented areas, as well as the typical geotechnical parameter ranges associated with each of the defined geotechnical units. The interpretations developed were incorporated into the mine and production planning to ultimately optimize operational planning and control.
Keywords: Madagascar, heavy minerals, cemented sand, geotechnical characterization, Leapfrog, piezocone.
Introduction
QIT Madagascar Minerals (QMM) is a heavy mineral sand mining operation at Mandena, near Fort Dauphin in Madagascar. During the final planning and commissioning stages of the project, the need to fully characterize the unusual geotechnical conditions was identified and a geotechnical investigation became necessary.
Nature of the problem
During the commissioning phase it was found that mining production was being hampered by biologically cemented/indurated layers encountered within the sands. Closer inspection of the indurated horizons in the dredging face revealed that these layers contain a high loading of bacteria and fungi. It appears that the bacteria produce an extracellular (outside the cell) polysaccharide (i.e. sugar and carbon salts), which form a gelling biofilm to trap nutrients. There are a number of different bacteria. The fungi, on the other hand, produce a network of fibrous strands that bind the sand grains together. Thus both bacteria and fungi probably contribute to the 'apparent cohesive' strength or binding of the indurated sand (Lynn, 2008).
The main challenge in this project was the many unknowns surrounding the nature and extent of this biological cementation. Typically, the following questions arose.
► Is this a biological, geological, or geotechnical problem, or all of the above?
► How does one go about modelling a phenomenon that is not necessarily governed by apparent geological processes or markers?
► What tools and techniques would be suited to cope with the variable conditions being investigated? How effective will they be?
► How does one ensure the tools and techniques used can provide useful data that can be verified?
► How does one combine all the available data collected to generate a practical geotechnical model that will assist in a mining production environment?
► How does one approach the modelling of geotechnics and relate this to the geological resource model and mine plan?
Data gathering and evaluation
The scoping of the investigation was defined during various brainstorming sessions that considered existing data, the most crucial engineering parameters required for mine and dredge design, and which geotechnical investigation techniques available could potentially obtain the required data effectively. The scoping study also included trials using different rotary and vibracore drilling techniques to confirm which would be most appropriate to use.
This process culminated in an investigation methodology involving two phases. Phase 1 focused on high-density geotechnical rotary core drilling, logging, sampling, and standard penetration testing (SPT) as well as piezocone with pore pressure measurement (CPTu) testing within a limited area. Laboratory tests of soli and rock samples retrieved from the boreholes was also completed. Following the trials, it was decided not to use a vibracore drill as it was found that the vibration of the drill broke the intergranular bonds in the indurated layers, resulting in the indurated materials being recovered as soils.
Phase 2 focused on a lower density of testing on the remainder of the orebody. During phase 2 all available historical information was used, including existing exploration borehole log data, where appropriate, to generate a 3D geotechnical model and typical geotechnical parameter ranges for the most important geotechnical properties.
In-situ measurements using a piezocone (CPTu) rig provided direct measurements of cone resistance (qc), sleeve friction (fs), and pore water pressure (u), which can be used to derive various geotechnical parameters. Due to the expected variable conditions, the CPTu equipment was expected to be ineffective on the hardest indurated layers. A standard drilling rig or hydro vibracore rig (sonic method) was therefore provided to advance through the hardest layers.
Selected CPTu locations were paired with high-quality rotary core drilling, using a triple-tube barrel and a mud flush, to obtain cores of indurated sands and more cohesive/dense soil layers. Limited SPT was also completed in the holes and used to provide a comparison with the CPTu data. Detailed geotechnical logging of the rotary tube drilling core was completed. Laboratory testing of core samples assisted in confirming the parameters derived from the CPTu interpretations and to determine parameters on the very hardest indurated sand layers that could not be derived from the CPTu testing.
The combined phase 1 and phase 2 geotechnical database consisted of 147 CPTu locations, and 48 borehole and SPT locations. More than 200 disturbed samples and approximately 80 core samples were tested in the laboratory. Figure 1 provides a general location map and test location layout of the area investigated.
Field logging ofrotary drilling samples
Owing to poor recoveries, drilling provided little material within the un-indurated zones and this posed various challenges during field logging. To ensure consistent capturing of information that could later be calibrated and refined when combined with the other data gathered (such as the CPTu and laboratory information), a site-specific approach to logging was adopted to ensure that a consistent account of the indurated materials was captured. Generally, zones registering SPT Nfield values of over 50 blow counts (noted as 'refusal') were deemed to be of very dense consistency or possibly of Extremely Soft to Soft rock with a uniaxial compressive strength (UCS) of 0.5-3.0 MPa. The presence of rock-like indurated material was logged only if core samples were available for confirmation, irrespective of the SPT Nfield values recorded. Where this could be confirmed from core or SPT samples, the thickness, spacing, and depth of the indurated beds were recorded.
Based on this approach, zones with similar geotechnical characteristics were identified and provided with an overall description. This process was the first step in the generation of a site-specific geotechnical unit model.
Correlation ofin-situ testing methods
A numerical correlation between the CPTu-derived SPT N60 values, qc, and the SPT Nfield values obtained in the paired locations was completed. To obtain a point value that correlates with the SPT Nfield values recorded, a linear average output value from the CPTu at the start and end of the SPT testing depths was assumed. A typical CPT-derived SPT N60 trend and SPT Nfield values plotted against depth is shown in Figure 2.
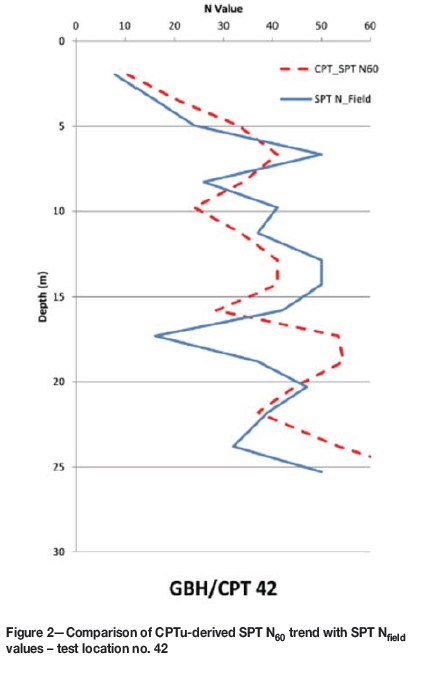
Acceptable correlations were found to exist for 58% of the test positions, providing correlation coefficients from 0.5 to 0.94 (Boshoff and Bracken, 2011). Visual assessment indicated that trends were offset in several of the poorer correlating cases, but that the overall trends were similar.
Correction factors were applied to the SPT Nfield values, but none of the standard correction factors such as rod energy, overburden, and anvil size, as described by Clayton (1995), provided a consistent improvement in the correlations obtained compared to the raw data.
CPTu interpretations and borehole logs vs laboratory results
Good correlation was found between the rotary drill sample logging, laboratory results, and the soil behaviour classes for the CPTu as defined by soil behaviour charts developed by Campenella and Robertson (1988).
CPTu identified sands and silty sands as dominating the profile with some materials, typically those found at the base of the probe holes, classifying as silts or sandy clay-type materials.
The laboratory UCS test results agreed well with the rock strengths identified during borehole logging, with most falling within the strength range (UCS of 0.5 to 3.0 MPa) predicted during logging (Extremely Soft to Very Soft rock). The permeabilities measured in the laboratory for the core samples were in line with permeability predictions based on the CPTu-derived soil behaviour types for sands and silty sands (Robertson, 1992).
However, some exceptions occurred when correlating CPTu information with samples extracted from the paired rotary drill-holes, indicating that significant variation in induration strength can exist over small distances.
Generation ofageotechnical unit model
The processes described above led to the definition of a geotechnical unit framework within which the data could be further evaluated. The framework focused mainly on defining zones that would have specific engineering implications for the mining operation.
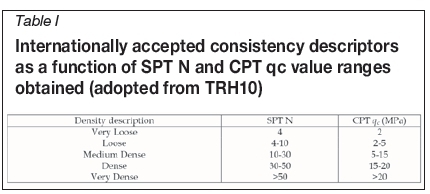
General internationally accepted guidelines as provided in the literature and summarized in the TRH10 (1994) document compiled by the Committee for State Road Authorities, South Africa (1994) relate CPT qcto SPT Nfield values and corresponding density descriptions, as shown in Table I.
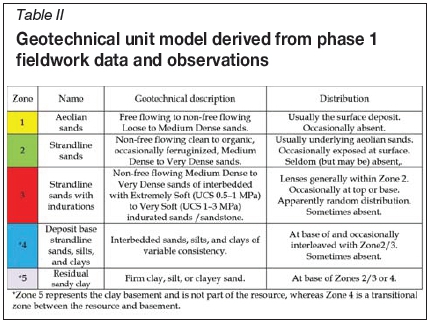
Spikes in qcvalues could be correlated with very dense to indurated layers located within generally Medium Dense to Very Dense silty sand layers. This finding agreed with observations during logging of the boreholes. It also became clear that the CPTu was more effective in detecting the presence of very thin indurated layers that would not be identified during drilling and SPT testing. The conceptual geotechnical unit framework was defined considering all the available data and is shown in Table II.
Simple principles were developed to ensure a consistent evaluation and optimization of the geotechnical zone boundaries that would constitute the final zone interval database. These include:
► Adopting CPTu data as the more accurate and continuous record of in-situ conditions due to generally low sample recoveries in the boreholes
► When delineating and optimizing geotechnical zone boundaries, density would have priority over descriptive properties (such as colour)
► Zone 3 conditions were inferred where significant spikes in the CPTu qc(30-40 MPa) could be observed, where vibracore drilling was required, or where recovery of core samples confirmed the presence of indurated layers
► If a section was logged in boreholes as Zone 2 and the CPTu data indicated hard layers, this zone would be upgraded or adjusted to Zone 3 in accordance with CPTu data.
3D modelling approach
The spatial modelling was completed using implicit modelling software, Leapfrog3D Mining (ARANZ Geo, New Zealand). This module has since been superseded by Leapfrog Geo.
Implicit modelling uses a rapid 3D interpolation engine to construct 3D models. Implicit modelling techniques have been refined by developers over the past 10 years to suit geological modelling problems, and in this case implicit modelling was also applied to modelling specific geotechnical zones and gathered numerical data in much the same way as when modelling geological features and ore grades. The benefit of using implicit modelling is that it allows for the automatic construction of wireframes from scattered downhole data with no need for manual digitization (Cowan et al., 2003).
During phase 2, the phase 1 interpretations were verified. Phase 2 also included scrutinizing the geological exploration data gathered to supplement 3D modelling. This in itself constituted a challenge as geological logging had been completed from a 'geological and resource modelling perspective', whereas the 'geotechnical zones' were based mostly on the engineering properties of the materials as logged and measured using specific in-situ measurement techniques.
Geotechnical zones were modelled as separate 'lithologies'. The geotechnical zone modelling and numerical modelling were approached separately. The measured data was considered 'hard' data, whereas the zone boundary interpretations were based on a combination of the descriptive and in-situ measured data.
Geotechnical zone lithology modelling
Geotechnical zone volumes were generated using spheroidal variogram settings with constant kriging and a range of approximately 300 m. The ellipsoid ratios were optimized to reflect the general dimensions of the volumes being modelled (i.e. disk-shaped with small Z relative to ellipse radius).
Zones 1, 2, and 3 were modelled separately; however, Zones 4 and 5 were combined and modelled as one composite region delineating the clayey deposit base consisting of either marine clays and/or residual clayey sands. Areas not defined by the interpolants developed from existing geotechnical data were inferred as comprising of geotechnical Zone 2-type sands.
The following age succession was assumed:
► Zone 3 is considered the youngest, generally cutting indiscriminately through all deposited sands, as cementation took place after deposition of the strandline deposits
► Zones 1 to 5 (excluding Zone 3) were assumed to be of increasing age; however, Zone 2 could be interleaved with Zone 4-type materials (clays and silty sand lenses) due to the nature of deposition of the strandline sands.
Correlation between the geological database generated during exploration drilling and the geotechnical database was considered. After some review, it was confirmed that the merging of the two data-sets would not be ideal and would possibly skew the presentation of the geotechnical information gathered. The two data-sets were therefore kept separate within the modelling software. However, the geological data had to be utilized to some extent during modelling to supplement the limited geotechnical data-points available. To correlate indurated conditions captured within the geological database, an approach introduced by the project geologist was used to include an 'induration' interval to identify zones where described/indicated and inferred indurated conditions can be expected (Hees, 2010). This interval could be used to group key lithologies within the modelling space to reflect the distribution of the indurated conditions as per the geological database. This could then be compared with the geotechnical zone boundaries and integrated manually.
In areas where little data was available, the Zone 3 model was extrapolated by utilizing the reviewed and grouped geological data as well as geological cross-sections imported into the modelling software. However, areas did exist where indurated conditions were identified that were not captured in the geological database. Geotechnical data therefore took precedence in most cases when interpreting the Zone 3 material boundaries.
Numerical data analyses in 3D
A design chart was developed by the dredge designers matching SPT N number to output in tons per hour for the existing dredge when production issues ensued. For this reason, the first attempts in modelling of geotechnical properties were focused on the SPT N numerical data as known relationships existed. Numerical modelling of the SPT N60 and SPT Nfield values was undertaken and run using similar settings to the lithological model.
A separate 3D interpretation was made using only the numerical data gathered to interpolate areas associated with specific numerical parameter thresholds within specific orebody areas. Numerical data within each modelled zone could also be extracted and analysed statistically. The numerical model can currently provide 3D contour maps of a specific geotechnical parameter modelled at any level or on any section through the orebody volume. The numerical interpretations do not agree in all areas with the zone interpretations, as selected locations were modelled using only descriptive logging information with no numerical geotechnical background data e.g. hydrogeological borehole positions or exploration data (Boshoff and Bracken, 2012). Gaps in the numerical data coverage still existed; however, the process demonstrated that numerical modelling of a geotechnical parameter can be very useful in this case.
Modelling results
The model completed for the North West Satellite orebody is provided in Figure 3 as an example.
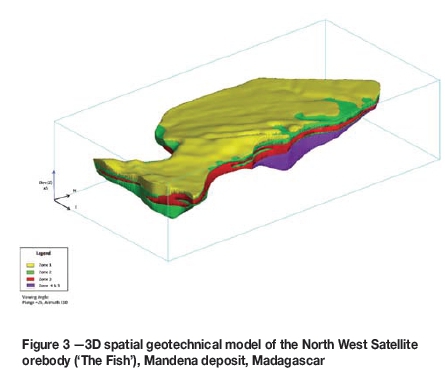
Of most significance to the mining operation is the spatial distribution of Zone 3, which is the most indurated zone. Zone 3 modelling showed relatively continuous, but gently undulating, indurated beds and/or lenses across the majority of the Mandena area. Zone 3 is absent or underdeveloped in some locations. The macro appearance of the indurated zones is large- to small-scale lensing rather than distinct indurated horizons, but these macro lenses can be made up of various indurated horizons of variable thickness.
Zone 3 conditions are expected to be concentrated around elevations ranging from +4 m msl (mean sea level) to -1 m msl.
Table III contains the numerical information extracted for each geotechnical zone modelled, providing parameter ranges and typical values of the SPT Nfield and SPT N60 values measured within these areas. Numerical data available for the indurated conditions (Zone 3) is likely to be less representative due to early refusal of the CPTu, and the relatively small number of boreholes drilled also limiting conventional SPT measurement.
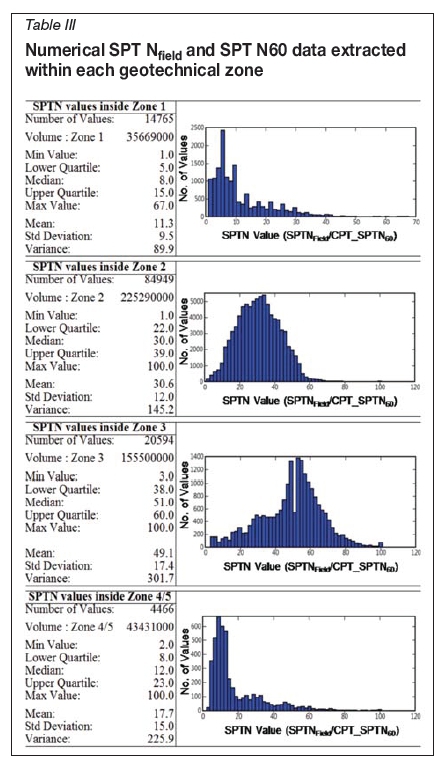
Laboratory testing results confirmed the expected UCS values associated with the most indurated Zone 3 materials. Based on the test results, the maximum strength/hardness of the indurated materials recovered and tested is assumed to be around 2 MPa. Although the properties of Zones 2 and 3 are highly variable, the median SPT N value exceeds 30 for Zone
2 for the majority of the orebody. The Zone 3 median SPT N value is estimated at 53, but possibly higher if adjustments are made for rock-like materials on which the CPTu and SPT refused (Table IV). Current measured SPT N values for Zone 3 ranged from as low as 3 to as high as 100.
It is therefore clear from the data evaluation shown in Table III that the numerical data and the zone model have been successful in delineating distinct geotechnical zones that can be applied to the mine planning and design process.
Application to mining operation
Based on existing design charts, the dredge should be able to achieve an average dredging rate of around 1900 t/h in Zone 2 material and no more than 1300 t/h in Zone 3 material. By applying typical expected weighted SPT N values to certain mining blocks (e.g. by determining the weighted average volume that each geotechnical zone represents in a specific mining block), one can more accurately predict advance rates and set realistic production targets and/or plan which areas should rather be earmarked for mechanical preconditioning to obtain the desired throughputs. This information was also used to specify a larger dredge that would be able to deal with most of the geotechnical conditions predicted by the model.
Geotechnical parameters associated with the various zones modelled and the nature of the zones as reviewed in 3D have the following implications for the mining operations:
► The Zone 1 deposits will be easily excavated or dredged
► Zone 4 and 5 materials may result in process inefficiencies due to their more cohesive nature causing blockages and build-up on processing equipment, and hindering heavy mineral separation due to increased slimes contents
► All areas will be excavatable using mechanical excavators and bulldozers, although Zones 1 and 2 would be easier to excavate than Zone 3
► Dredging of Zone 1 and Zone 2 is considered possible, but dredging of Zone 3 could result in significant drops in productivity when the stronger indurations are encountered
► In terms of the stability of excavated slopes in the dry mining pits, it is expected that Zone 3 materials can stand vertically over long periods (days to weeks). Deterioration of the factor of safety for this vertical slope is unpredictable. Zone 2 materials may stand vertically for several metres over short periods (hours, sometimes days), but will collapse to lower angles over time. The aeolian sands are generally free-flowing and excavated slopes will collapse to an angle of 30° to 35°. Due to the variable nature of the deposit (introduced by the combination of the geotechnical zone thicknesses, the presence and scale of the Zone 3 indurations, and localized hydrogeological factors) no single specific slope stability solution or factor of safety (FoS) can be assigned. Slope stability management must be approached as a daily planning and production task requiring ongoing assessment by a competent person.
Feedback from the mining operation confirmed that the geotechnical model was utilized as a decision trigger to identify areas destined for dry and dredge mining in 2014. However, dry mining was suspended from November 2014 onwards.
The Zone 3 solid was imported into the Surpac mining software package, and then into the block model attribute to represent how much of a block is in Zone 3 (partial percentage). This helped to estimate the production rate of the dredge. Surpac Minesched software has a production factor (PRODFACT) attribute, which can be written on a block model. This represents how effective the mining system is compared with its capacity according to orebody conditions. The mining rate for each block is then represented by the PRODFACT, which is the mining rate divided by capacity on a given time unit (1 day). This is a function of bench height and cutting rate (which, in turn, is a function of hardness and therefore a function of Zone 3 percentage).
The new dredger utilized, as specified following the outcome of the phase 1 investigations, is able to cut Zone 3 material at the reach of the cutter. Preconditioning was planned based on the geotechnical model as part of safety mitigation to prevent unexpected falls of big blocks onto the dredge ladder. Preconditioning was eventually cancelled as the mine was able to cope with the hanging face by managing the risk through a modification of the dredging technique, which basically entails cutting horizontally (i.e. laterally) at the base of Zone 3, gradually moving the cutter upwards and thus minimize the size of blocks that could fall and damage the equipment.
The above methods of planning or anticipating production have therefore been of some benefit to the mine. However, the complexity of the dredging productivity model makes it difficult to confirm the specific contribution of the geotechnical model to efficient production planning, as other constraints in the process also influence how the dredge throughput is planned.
However, by anticipating mining conditions the mine is able to plan the best way for dredging to proceed (i.e. planning of cutting faces). An additional benefit to the operation is the ability to plan how to deal with the downstream influence of Zone 3 mining conditions, as this has an impact on the wear rate of the cutter tooth and hence on inspection frequency, spares management, and preventing overload of the hydraulic system.
The geotechnical characterization of the orebody has therefore provided several ways of optimizing the planning and control of the mining operation.
Conclusions
The Mandena case study demonstrates the importance of geotechnical investigations in the early phases of a project to ensure understanding of the geotechnical parameters of an orebody and the potential limitations that these could pose to the chosen mining process. Unfortunately, the importance of these investigations in the early phases of mining projects is commonly forgotten, or more focus is placed on civil or resource estimation applications rather than on the understanding of how unusual geotechnical conditions could affect the mining process. It must be added that the conditions encountered at Mandena were unusual compared to the typical well-known heavy mineral sand deposits mined on South Africa's northeast coastline (Zulti North, Hillendale, Zulti South, and Fairbreeze deposits).
The case study further demonstrates the importance of using an integrated approach that includes various geotechnical and geological techniques to successfully characterize unusual and variable geotechnical conditions.
By using an integrated approach and combining data from geological and geotechnical sources it was possible to generate a geotechnical zone model in 3D into which any of the in-situ measured and/or derived parameters obtained from CPTu testing can be imported, modelled, and/or data extracted and analysed statistically for application to the mining requirements. This integrated method of investigating, defining, and presenting large-scale, and unusual geotechnical problems allowed the Mandena operation to enhance its production planning capabilities.
References
Boshoff, L.I. and Bracken, A.H. 2012. Project TiO4 - Mandena North West and North East Satellite Areas Geotechnical Investigation. SRK Report no.r 437868/3.1. Draft Report. Rio Tinto Management Services, Johannesburg, South Africa. [ Links ]
Boshoff, L.I. and Bracken, A.H. 2011. QMM Mandena Phase 1 Geotechnical Investigation. SRK Report no. 414630/2. Final Draft Report. Rio Tinto Management Services, Johannesburg, South Africa. [ Links ]
Campanella, R.G. and Robertson, P.K. 1988. Current status of the piezocone test. Proceedings of Penetration Testing 1988: the First International Symposium on Penetration Testing, ISOPT-1, Orlando, Florida, 20-24 March 1988. Vol. 1. Balkema, Rotterdam. pp. 93-116. [ Links ]
Clayton, C.R.I. 1995. The standard penetration test (SPT): methods and use. Report 143, Construction Industry Research and Information Association (CIRIA), London. 143 pp. [ Links ]
Committee for State Road Authorities, South Africa. 1994. Technical recommendations for highways, TRH10 - the design of road embankments. Department of Transport, Pretoria. pp. 62-64. [ Links ]
Cowan, E.J., Beatson, R.K., Ross, H.J., Fright, W.R., McLennan, T J., Evans, T.R., Carr, J.C., Lane, R.G., Bright, D.V., Gillman, A.J., Oshust, P.A., and Tilley, M. 2003. Practical implicit geological modelling. Australasian Institute of Mining and Metallurgy Publication Series no. 8/2003. BPA Digital, Australia. [ Links ]
Hees, F. 2010. Orebody knowledge workshop report and presentation. Biocrete Model Stream 2 Area-Mandena Project. Rio Tinto Management Services, Johannesburg, South Africa. [ Links ]
Lynn, B. 2008. Summary report on the results of laboratory testing carried out on indurated sand samples. Ref. 30141. Rio Tinto Management Services, Johannesburg, South Africa. [ Links ]
Robertson, P.K. 1992. Estimating in-situ soil permeability from CPT and CPTu. Gregg Drilling and Testing Inc., Signal Hill, California, USA. [ Links ]
This paper was first presented at the Heavy Minerals Conference 'Expanding the Horizon', 16-17 August 2016, Sun City, South Africa.

