


Services on Demand
Article
 English (pdf)
 Article in xml format
 Article references
Indicators

Related links
-
 Cited by Google
 -
 Similars in Google
Share

 Permalink
Journal of the Southern African Institute of Mining and Metallurgy
On-line version ISSN 2411-9717
Print version ISSN 2225-6253
J. S. Afr. Inst. Min. Metall. vol.117 n.4 Johannesburg Apr. 2017
http://dx.doi.org/10.17159/2411-9717/2017/v117n4a6
GENERAL PAPERS
Modelling of caving and deformation mechanisms of the hangingwall of the Printzsköld oreboby at Malmberget mine
S.B. UmarI; J. SjöbergII; T. SavilahtiIII
IDepartment of Civil, Environmental and Natural Resources Engineering, Lulea University of Technology, Lulea, Sweden
IIItasca Consultants AB, Lulea, Sweden
IIILoussavaara-Kiirunavaara AB (LKAB) Malmberget Mine, Gällivare, Sweden
SYNOPSIS
Sublevel caving in Malmberget mine results in mining-induced surface deformation. One of the currently mined orebodies is the Printzsköld orebody. As mining deepens there is need to assess the behaviour of the cave formed in the subsurface above this orebody. Numerical analysis was used to assess the effects of extraction to deeper levels and perform strength parametric studies. Stress redistribution was studied, and the results showed high stress buildups in the hangingwall and the crown pillar. Two failure mechanisms have been identified - shear and tensile. Reducing cohesion by 50% increased the area of the yielded zone by more than 100% in the hangingwall.
Keywords: numerical modelling, sublevel caving, caving mechanism, strength parametric study, stress redistribution, hangingwall stability.
Introduction
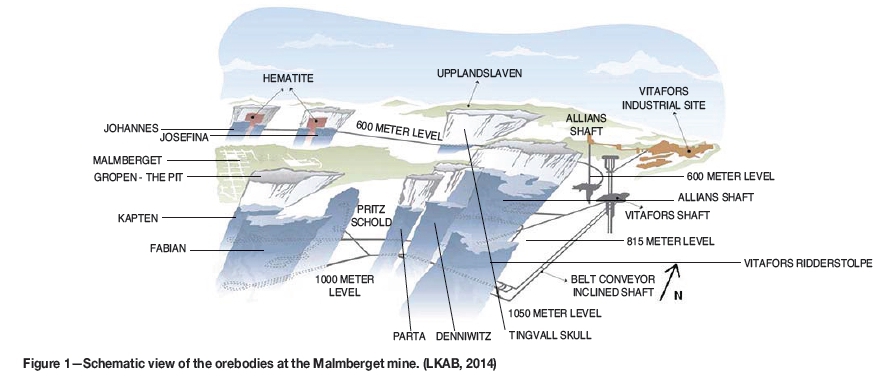
The Malmberget mine is owned and operated by the Luossavaara-Kiirunavaara AB (LKAB) mining company. Iron ore is extracted by large-scale sublevel caving. The mine comprises a total of 20 orebodies, about 10 of which are in production today (Figure 1). The mine is located in the municipality of Gällivare, about 100 km north of the Arctic Circle (Figure 2).
Successful sublevel caving requires progressive caving of the orebody after initial blasting. This results in caving of the hangingwall, sometimes all the way to surface, resulting in surface deformation. As mining progresses to deeper levels a larger area is affected by deformation. Over the years, extraction from the Malmberget orebodies has led to deformation of the ground surface, affecting residential areas and existing infrastructure.
Forecasting the caving process is not straightforward as it can be rapid or slow, depending on the rock mass conditions, stress conditions, the failure mechanisms at work, etc. Moreover, several of the orebodies in Malmberget are non-daylighting, which makes reliable caving analysis even more difficult, primarily since there is less available experience from such cases. The present study was designed to improve the understanding of the caving and deformation mechanisms at Malmberget, and in particularly for the Printzsköld orebody.
Mining of the non-daylighting orebodies at Malmberget, including Printzsköld, will leave a cap rock, or crown pillar, between the extracted areas and the ground surface. As mining proceeds deeper in the Printzsköld orebody, caving will gradually progress upward in the crown pillar and hangingwall. The caving propagation can lead to ground surface deformation, depending on the extent and rate of caving, and whether breakthrough develops or not. It is therefore essential to investigate, describe, and quantify this phenomenon and its governing factors.
Umar, Sjöberg, and Nordlund (2013) described the rock mass in the Printzsköld orebody as highly jointed in many places. This rock mass is characterized by fractures, faults, and weak zones. The ore is quite competent but it is affected by the weak schistosity of biotite schists in some places on the boundary between magnetite (ore) and the grey leptite horizon.
The caving is believed to be controlled by, among other factors, the stress conditions in the rock mass. Umar, Sjöberg, and Nordlund (2013) presented an investigation of the stress redistribution in the hangingwall of the Printzsköld orebody in which a two- dimensional conceptual model was constructed using the continuum code Phase2 (Rocscience Inc., 2002). A sensitivity analysis of strength parameters was performed in which cohesion (C); tensile strength (σtm), and the angle of internal friction (Φ) of the rock mass were varied. This study showed that the stability of the hangingwall rock mass was more sensitive to variations in cohesion. However, the two-dimensional model was judged to be rather simplistic, and a three-dimensional model study is thus warranted. No three-dimensional stress modelling has previously been conducted for the Printzsköld orebody with the aim of studying failure mechanisms in order to understand the caving process.
Objectives and scope
The Printzsköld orebody was selected for this study because of (i) its importance as one of the main areas for future production at Malmberget, and (ii) the importance of better understanding future caving behaviour and possible ground deformation in the central area of Malmberget. The paper presents a conceptual model for studying stress redistribution and yielding in the hangingwall of this orebody as a function of mining at depth and the caving activities. However, the caving process itself was not explicitly simulated. Rather, the study was focused on the specific objectives outlined below:
i. To provide an understanding of the rock mass behaviour in the crown pillar of a non-daylighting orebody as mining progresses deeper
ii. To assess the sensitivity of rock mass strength parameters with respect to possible caving and deformation mechanisms
iii. To identify the failure mechanism likely to affect the hangingwall and the crown pillar of the Printzsköld orebody as mining deepens.
Numerical modelling of the Printzsköld orebody
Modelling approach
Three-dimensional numerical modelling was employed using the Three Dimensional Distinct Element Code (3DEC) (Itasca Consulting Group Inc., 2013). The rock mass was assumed to be an equivalent continuum (fractures and joints thus not explicitly simulated) and both elastic and elasto-plastic analyses were conducted. In the elastic analysis, stress patterns were evaluated for effects of mining at certain depths. It was necessary to determine where stress buildups developed in relation to the crown pillar and the hangingwall.
In the elasto-plastic analysis, the extent of yielding as a function of mining was investigated. Moreover, a parametric study was conducted in which strength parameter values were changed and the effect on stress distribution, as well as the extent and type of yielding, was studied. The simulations with the plastic material model were all done using the MohrCoulomb yield criterion and a non-associated flow rule.
Model geometry
The Printzsköld orebody has a complex geometry. Extraction from this orebody requires a controlled approach in which stresses are redistributed uniformly to avoid high stress buildups in certain mining areas as well as in the hangingwall. Mining of this orebody by sublevel caving started at the 780 m level. As mining progressed deeper, an upward cave developed, which as of 2012 had propagated upward to approximately 300 m below the ground surface (at about the 500 m level in the local mine coordinate system). The orebody has a plunge hangingwall which is defined by the flat-lying cave back (see Figure 3). Umar, Sjöberg, and Nordlund (2013) only examined a vertical cross-section of the Printzsköld orebody in a two-dimensional model, thus leaving out much of the effects of the plunge hangingwall. A two-dimensional model of a longitudinal section of the orebody was also modelled, but not reported. This work was included in the present study to compare with the three-dimensional model.
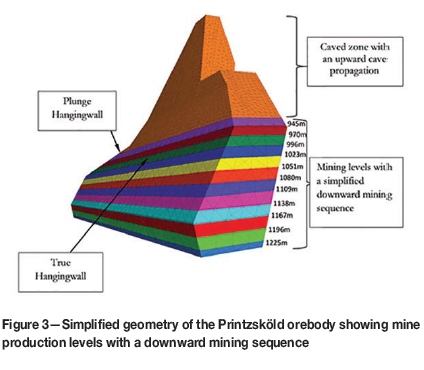
Another simplification that has been made concerns the mining sequence of the Printzsköld orebody in the current model, as shown in Figure 3. The draw schedule within each sublevel, or at different sublevels simultaneously, has not been simulated; instead, each sublevel has been excavated in full for each mining step in the model.
Mining was simulated to progress downwards on levels separated by 25-30 m (corresponding to actual sublevel height). This mining simulation started from the current active production level at 920 m and progressed to the future 1225 m level with a total extraction of approximately 70 Mt planned by November 2030. It should be noted that the possible continued caving as mining proceeds deeper was not explicitly simulated in the model. Rather, the cave back that had developed up until 2012 was kept at the same position and the possible behaviour of the rock around the cave analyzed as mining progressed downward.
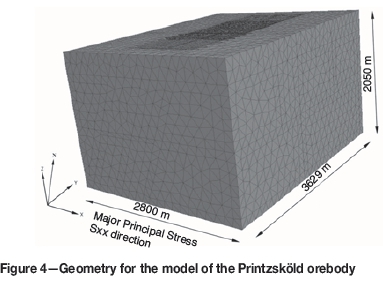
The model size was set to 2800 m χ 3629 m χ 2050 m to reduce possible model boundary interference (see Figure 4). A graded discretization was used with fine meshing close to the orebody and a gradually coarser mesh toward the model boundaries. The boundary conditions were that the model was fixed at the bottom, and with roller boundaries (zero horizontal velocity) on all vertical boundaries. The top surface was modelled as a free surface.
It was further assumed that neighbouring orebodies did not affect the Printzsköld orebody, hence only the Printzsköld orebody was included in the model. This assumption needs to be verified in future mine-scale models, but initial stress models by Perman, Sjöberg, and Dahnér (2011) indicated that interaction effects may be limited.
Initial stresses and material parameters.
Initial stresses were obtained from Sjöberg (2008), in which the vertical stresses were set equal to the pressure from overburden material and the horizontal stresses were found to be (through stress calibration):
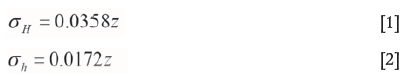
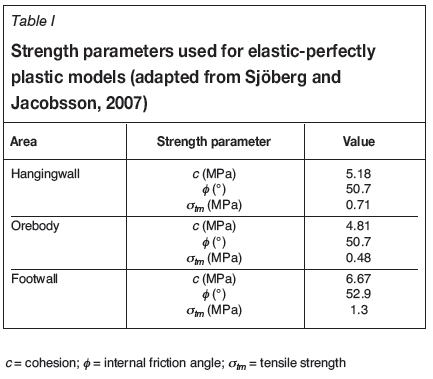
in which z is the vertical depth in metres. Here, oHis the maximum horizontal stress and ahis the minimum horizontal stress, with aHhaving an orientation of 130.6° from the local north of the mine. It should be noted that the model boundaries were oriented parallel and perpendicular, respectively, to the initial major horizontal stress, to avoid having to apply shear stresses to the model boundaries. The strength parameters used for elastic-perfectly plastic models are shown in Table I. These values were taken from Umar, Sjöberg, and Nordlund, (2013), and are based on a study by Sjöberg and Jacobsson (2007). These values are considered equivalent strengths for the rock mass, when modelled as a continuum.
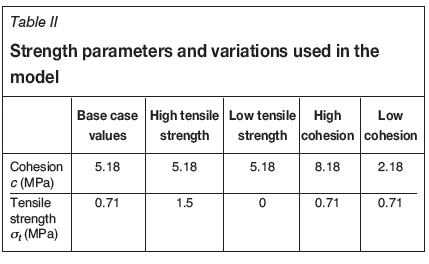
For plastic analysis, three scenarios were analysed to assess the effects of varying cohesion and tensile strength of the hangingwall rock. The three scenarios were base case, and low and high values for cohesion and tensile strength. The friction angle was kept at a value of 50.7° for the sensitivity analysis (see Table II). The cohesion value was varied by ± 3 MPa for the low,and high,cohesion cases. For the tensile strength, zero tensile strength was chosen for the low-strength case, and an approximately twice as high a tensile strength (1.5 vs. 0.7 MPa) for the high-strength case.
Evaluation
Comparisons with the 2D models were made for vertical and longitudinal cross-sections of the orebody. The mining stages corresponding to levels 970 and 1225 m were selected for interpretation and evaluation. The 970 m level was selected as this area will be mined in the near future. The 1225 m level was selected as it represented a significant difference in the amount of overall extraction compared to that of the current mining state.
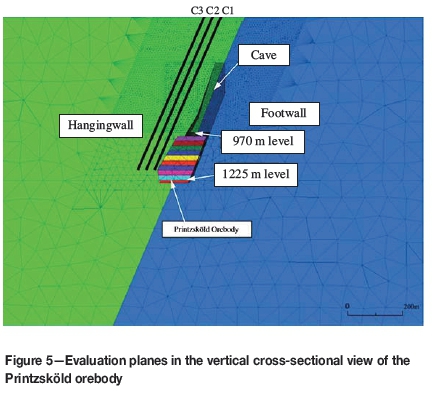
Three query lines were set in the vertical cross-section along the hangingwall to study parameter effects on the model in comparison to the two-dimensional model analysis presented in Umar, Sjöberg, and Nordlund (2013). These lines represented three evaluation planes that were established in the vertical cross-section view. Three evaluation planes were also established in the longitudinal cross-section of the Printzsköld orebody. These planes were used to monitor and evaluate the stress redistribution as mining progressed. Three cross-sectional view planes - C1, C2, and C3 - were chosen to evaluate how far into the hangingwall the stress redistribution reached. Plane C1, placed about 100 m from the cave boundary, was set as a starting point and established for comparison with the two-dimensional Phase2 model stress evaluations reported in Umar, Sjöberg, and Nordlund (2013) (Figures 5 and 6). Evaluation plane C2 was 50 m away from plane C1 and C3 was placed 50 m away from C2.
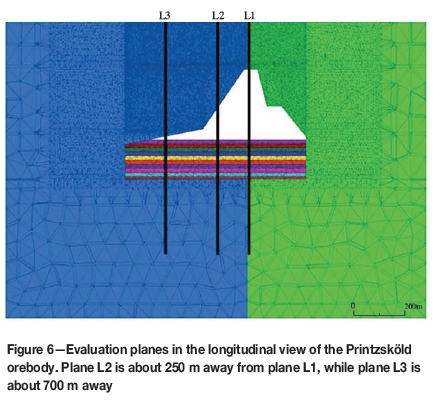
The evaluation planes in Figure 5 were situated in the true hangingwall while the longitudinal evaluation planes in Figure 6 cut across the orebody. Planes L1 and L3 in Figure 6 were set up to evaluate the behaviour in the cap rock and plunge hangingwall, respectively. On each plane, principal stresses and yielding were evaluated. L2 was used to give infill stress distribution information in the plunge hangingwall to ascertain the trend of failure as stresses build up in the cap rock.
The results are presented for both elastic and elasto-plastic analyses. These results are compared with those obtained in the two-dimensional analysis using Phase2 (Umar, Sjöberg, and Nordlund 2013). The 1109 m level was used as a control, to observe the trends and tendencies of rock mass behaviour. It was found that the rock mass behaviour when mining level 1109 m did not depart much from that when mining the 1225 m level.
The sign convention for stress results in 3DEC is negative for compressive stresses and positive for tensile. However, for the Phase2 results the convention is the opposite, i.e., positive for compressive stresses and negative for tensile stress.
Results
Elastic modelling
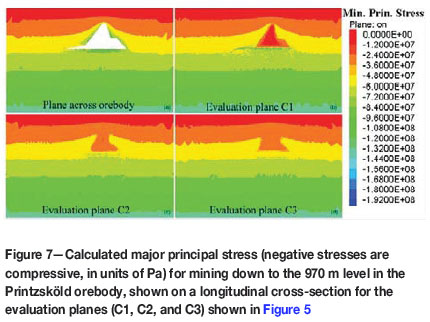
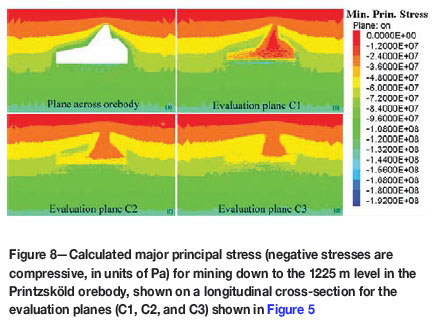
Results for the 970 m and 1225 m level are shown in the vertical cross-section and the longitudinal section in Figures 7 through 9. In the longitudinal section, a buildup of the major stresses in the cap rock and the plunge hangingwall can be observed. In Figures 7 and 8, (a) represents results evaluated on a plane that cuts through the orebody, while (b), (c), and (d) represent the major principal stress in various parts of the model on the evaluation planes (C1, C2, C3) for the 970 m and 1225 m levels. A high concentration o compressive stress was seen to develop in the cap rock when mining reached the 1225 m level.
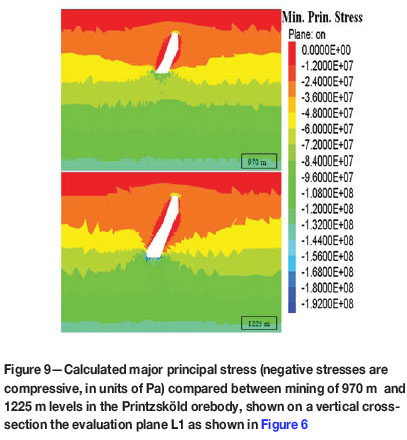
In the cross-sectional direction (shown in Figure 6) three monitoring planes (L1, L2, and L3) were used, which enablet assessment of the stress redistribution in the cap rock, true hangingwall, and plunge hangingwall. The major principal stresses on these evaluation planes are shown in Figures 9 through 11.
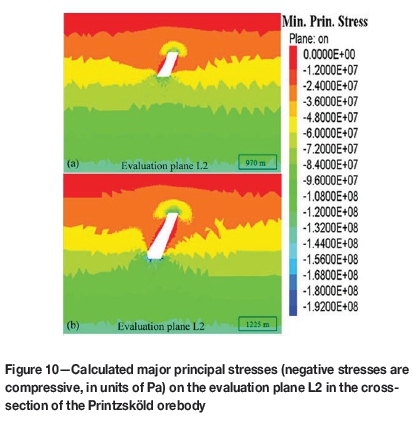
The evaluation plane L1 in Figure 9 cuts through the roof of the cave and the Printzsköld true hangingwall. A compressive stress regime is built up in the roof of the cave. A destressed region can be observed on the boundary of the cave going outwards into the hangingwall to about 100 m. Evaluation plane L2 (Figure 10) also shows a high-stress region in the upper part of the plunge hangingwall.
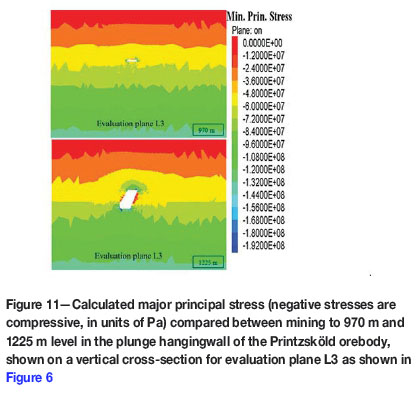
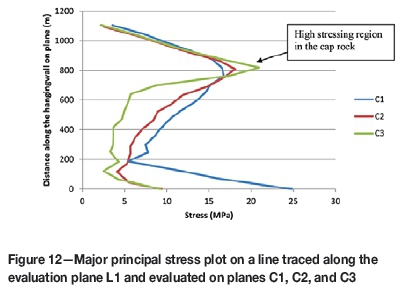
Figure 11 shows the monitoring plane L3 which addresses the plunge hangingwall on the fringes of the orebody. The major principal stress was also analysed along a line traced through evaluation plane L1 (from Figure 6) and results monitored from evaluation planes C1, C2, and C3. This was to determine how the major principal stress changed for the various distances of the planes from the cave boundary.
Figure 12 shows the major principal stresses plotted against distance for the three evaluation planes. The bottom of the cave is represented at the origin in the graph while the surface is at 1100 m (upper part of the graph). Figure 12 also shows zones of high stressing and destressing along each evaluation plane.
A stress variation evaluation was undertaken along a line traced along the evaluation plane C1 in Figure 5. The results were compared to the stress variations observed along the corresponding evaluation (or query) line analysis from the two-dimensional model analysed in Phase2 (Umar, Sjöberg, and Nordlund, 2013), shown in Figure 13.
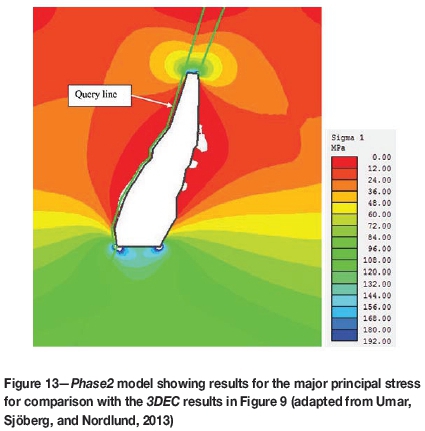
Figure 13 from Phase2 compares well with Figure 9b. Both figures have been taken showing the stress after mining the 1225 m level. However, larger stresses were found from the Phase2 model compared to the 3DEC model. Stress variation graphs from 3DEC and from Phase2 (Figure 14) show a similar trend in the behaviour of the stresses along plane C1 in the hangingwall for all mining levels. The maximum stress value in the 3DEC model in the cap rock is 20 MPa while the Phase2 model shows a maximum stress just above 100 MPa at the same location (both for the 1225 m mining step). One reason for this seemingly large difference is that the two-dimensional model does not include the abutment effect from the third dimension, which would lead to stresses being overestimated compared to a three-dimensional model It should also be noted that zone sizes are larger in the 3DEC model, which further reduces the stress concentrations compared to those in the Phase2 models.
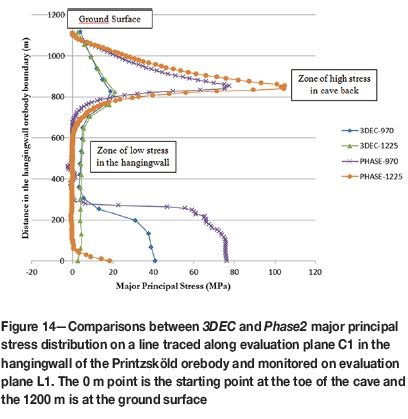
For both the 3DEC and the Phase2 models, the 970 m level stress behaviour shows a high stress buildup at the 300 m distance mark because this is the toe of the cave adjacent to the position of the line in the hangingwall. For the 1225 m level this point has become destressed and so the high stresses have been redistributed to lower levels. Destressed regions were observed in the hangingwall on all the three evaluation planes in the longintudinal and cross-sectional directions. In the cap rock, as seen from Figures 9 and 14, there does not seem to be much change in the major principal stress when mining from the 970 to the 1225 m level. This could be because the thickness of the crown pillar remains the same when mining to the deeper levels.
Further stress evaluation was conducted in the hangingwall and the cap rock of the Printzsköld orebody. Two evaluation lines were established, one starting from the cave back going vertically upwards to the ground surface with length of about 300 m (A) and the other from the cave boundary generated after mining the 1225 m level to about 1000 m into the hangingwall oriented in the northeastern direction and inclined at a dip of approximately 30° (B) (see Figure 15). The graphs in Figure 15 also show the plots of major and minor principal stresses against distance along the evaluation plane into the hangingwall. These plots illustrate the variations between the two principal stresses along the lines A and B.
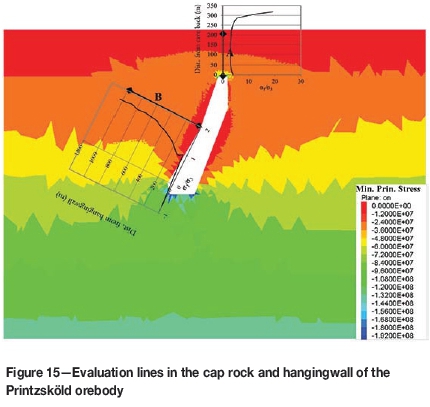
Major and minor principal stresses were also plotted along the two lines, with the results shown in Figures 16 and 17. In the cave back along line A, both minor and major principal stresses show a steady decrease when moving upward from the boundary of the cave. The stress buildup in the immediate cave back is accompanied by high confinement. In the hangingwall (along line B), the minor principal stress is about 5 MPa less than the major principal stress. The graph for line B shows a lack of confinement at the cave boundary in the hangingwall.
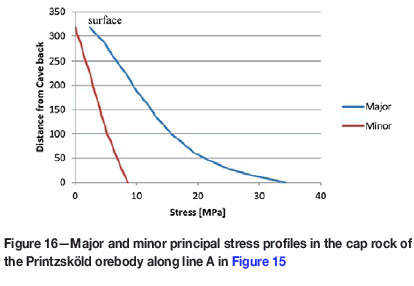
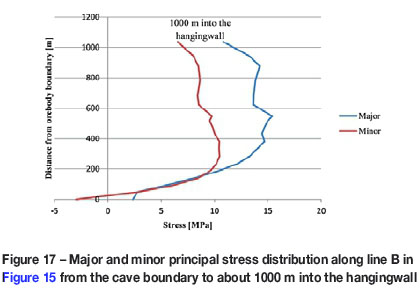
Plots of the major and minor principal stresses were used to check for confinement in the crown pillar and the hangingwall. It was evident that there was a high stress confinement at the cave back along line A after mining was simulated for the 1225 m level; the hangingwall showed an increase in confinment along line B from about 300 m to 800 m from the cave boundary. Thereafter there was a reduction in confinment at about 1200 m into the hangingwall.
Plastic modelling
The base case
The results for the base case scenario are shown in Figure 18 for mining of levels 970 m and 1225 m. The different colours in the legend indicate the current and past yield states for an element, with shear-p and tension-p denoting shear and tensile yielding in the past (previous time steps), respectively, and shear-n and tension-n denoting shear and tensile yielding 'now', i.e. at the particular time step being evaluated. The blue 'background' colour indicates that the material is still elastic, i.e. that no yielding has occurred. The results indicate that tensile failure was dominant in the hangingwall, whereas shear failure developed below the active mining level. This simulation also shows that as mining progresses deeper, the area of yielding increases. Also, mixed shear and tensile yielding is observed to be developing in the lower part of the hangingwall, and shear failure can also be noted in the footwall. The area of hangingwall yielding in this cross-section for mining the 970 m level is 35 600 m2, compared to 54 055 m2 for mining of the 1225 m level.
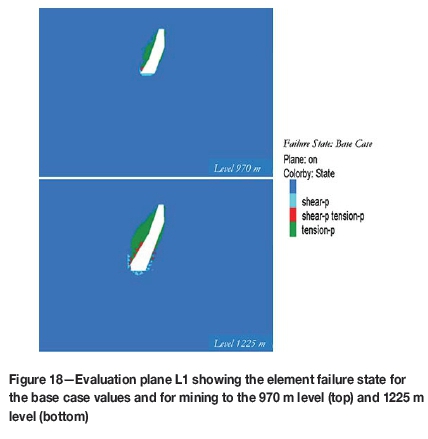
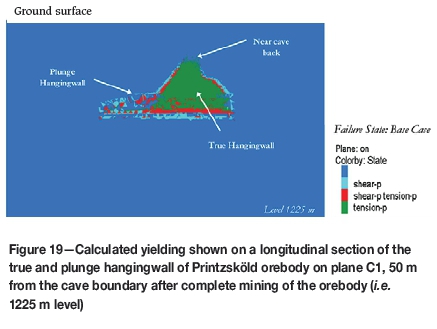
Figure 19 shows a simulation of yielding patterns in the true and plunge hangingwall sections after mining level 1225 m. Both shear and tensile failure have developed, with tensile yelding predominating on the C1 evaluation plane. The plunge hangingwall at this level fails primarily in shear. Similar tensile failure patterns were observed on the evaluation planes C2 and C3.
Effects of varying cohesion
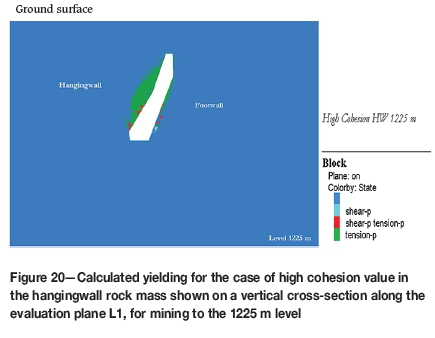
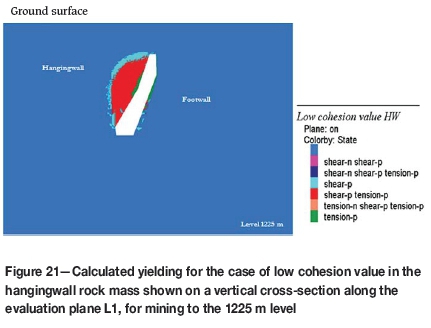
The sensitivity of the model to changing strength parameters was studied. This rock mass contains several weak zones and biotite schist zones, which affect the rock mass strength. In this initial study, the strength was changed for the entire hangingwall rock mass, to increase the understanding of what strength parameters are important to quantify in the continued work. Figures 20 and 21 show the results from the cases of high and low cohesion (cf Table II), respectively, which may be compared to the base case shown above. The results show a marked difference in the volumes of yield in the hangingwall, with a larger yielding obtained for the case of the lower cohesion value.
Effects of varying tensile strength
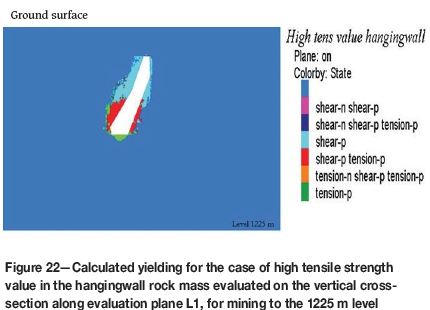
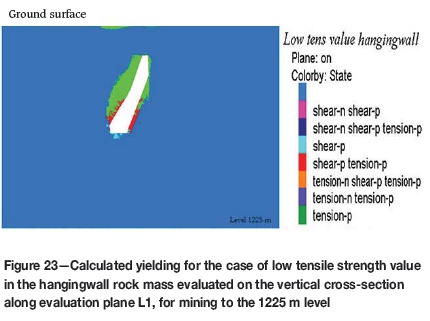
Tensile strength was increased to twice that of the base case values for the high-value case and reduced to zero for the low-value case (cf. Table II). Figures 22 and 23 show the results for the two cases. It can be seen that the overall area of yielding in the hangingwall and cap rock does not significantly change as the tensile strength is changed. However, the failure mechanism changes from shear to tensile failure, as could be expected. Moreover, for the low-strength case, some yielding near the ground surface can also be observed.
Comparison of sensitivity between cohesion and tensile strength changes
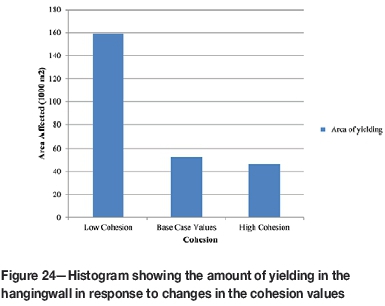
The changes observed for the variations of cohesion are higher in terms of area of yielding compared to the cases with varied tensile strength. However, changing the tensile strength affected the yielding mechanism. It was clearly inferred from model simulations that cohesion played an important role in the amount of yielding of the hangingwall rock mass. The type of yielding for low cohesion was more of shear, while that for high cohesion was predominantly tensile. Evaluation plane L1 was used to estimate the areal changes on this plane, which represented a volume variation along the evaluation plane. The variations, shown in Figure 24, show the differences in the area of the hangingwall affected by the cohesion changes (in terms of tensile or shear yielding) on the L1 evaluation plane.
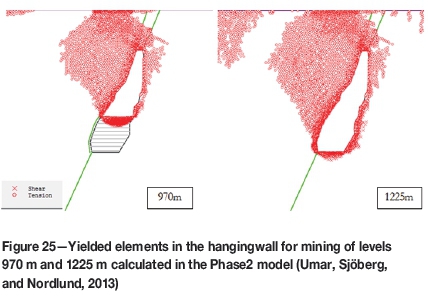
Comparisons were made between the plastic analysis results in 3DEC and the numerical modeling results presented in Umar, Sjöberg, and Nordlund (2013) in which Phase2 code was used. It was found that the results from the Phase2 model showed more conservative values for the hangingwall yielding than those shown in 3DEC, (compare Figure 25 and Figure 18). A larger area of yielding was noted in the Phase2 model compared to that in 3DEC. As stated earlier, the planestrain assumption used in Phase2 will generally result in exaggerated yielding compared to a 3D model.
Discussion
The results from the three-dimensional modelling presented in this paper have been compared with results from two-dimensional modelling presented in Umar, Sjöberg, and Nordlund (2013) using Phase2. Elastic modelling showed a good match with the Phase2 results, especially regarding the stress redistribution pattern. However, there is a difference in the values of the stress buildup, especially in the cave back. The two-dimensional Phase2 model gave higher stresses compared to those found from the 3DEC model. The primary reason for this is that the two-dimensional analysis assumes infinite cross-sections and thus it eliminates the effect of abutment from the walls perpendicular to the model plane. Hence it can be reasonably assumed that the 3DEC model yields more realistic stress values for a complicated orebody geometry such as that for the Printzsköld orebody.
Numerical simulations showed that tensile yielding in the hangingwall was more predominant compared to shear yielding, with the latter being observed primarily in the crown pillar and at the toe of the cave. Varying strength parameter values led to changes in the behaviour of the model in the hangingwall. It was found that lowering cohesion in the hangingwall caused an increase in the overall volume of yielding in either tension or shear. Since there are weak zones in this rock mass, this finding can be used to estimate failure extents within the hangingwall rock mass with low cohesion, such as the biotite schist zones found near the Printzsköld orebody.
The destressed zone in the true hangingwall can be thought of as a beam 'fixed' to the cave back and the toe of the hangingwall-cave boundary (see Figure 26). Bending of this 'beam' will induce tensile failure in the hangingwall. The cave back, on the other hand, is likely to fail in shear due to high compressive stresses, and thus advance upwards. This would lead to an extension of the exposed hangingwall 'beam', which in turn will promote additional tensile failure, thus resulting in progressive cave growth.
Conclusions and recommendations
The hangingwall of the Printzsköld orebody was analysed numerically using elastic and plastic material models. The following conclusions can be drawn from this study.
► As mining deepens there are high stress buildups in the cave back. Lowering the cohesion has an overall effect of increased yielding in the hangingwall. Simulations with high cohesion values produces very little yielding in the hangingwall, as expected
► The tensile strength variation had a limited effect on yielding in the hangingwall compared to that from variations in cohesion
► The failure pattern observed in the hangingwall was a mixture of tensile failure and shear failure. Shear failure was observed mostly near the crown pillar and also at the toe of the hangingwall.
The following recommendations are made with respect to continued studies.
► This simulation has been undertaken without considering the geological structures that may be present in the rock mass. It is therefore envisaged that further analysis of this orebody should incorporate potential large-scale geological features to address their possible effects on the stability of the hangingwall
► The potential for extension cracking, possibly resulting from caving, should be investigated further. This may be conducted using continuum modelling. However, it is also recommended that for future work more efforts should be made in explicitly simulating caving and cave advance, and the resulting cave geometry in the Printzsköld orebody. For this, a 'caving' model is required, and different approaches need to be investigated
► For this study, historical observations of caving were used qualitatively to understand the caving zone. For future work, it is envisaged that e.g., seismic monitoring data may be used as more quantitative data-set, thus allowing an improved calibration of the models.
Acknowledgements
This paper was written as part of an ongoing research project for Luossavaara Kirunavaara AB (LKAB) Malmberget mine, Sweden. The project is funded through the Hjalmar Lundbohm Research Centre (HLRC). The support from LKAB and the Centre for Applied Mining and Metallurgy is acknowledged. The authors would also like to thank the following members of the research team for their contributions in making this research a smooth run: Jimmy Töyrä, Linda Jonsson, Joel Andersson, and Fredrik Ersholm, all from LKAB. Also, thanks go to the assistant supervisor of the first author, Catrin Edelbro, as well as to Professor Erling Nordlund, both at Luleá University of Technology, for their guidance and support during this research.
References
Itasca Consulting Group Inc. 2013. 3DEC (3-Dimensional Distinct Element Code), Version 5.0. Minneapolis. [ Links ]
LKAB, 2014. Malmberget Mine Level. .https://wwww.lkab.com/en/Future/Urban-Transformations/Why/New-Mine-Level/Malmberget-Mine-Level/ [ Links ]
Perman, F., Sjöberg, J., and Dahnér, C. 2011. Detailed three-dimensional stress analysis of complex orebody geometry-model setup and results for the Malmberget Mine. Proceedings of the 2nd International FLAC/DEM Symposium, Melbourne, Australia, 14-16 February 2011. Itasca International Inc., Minneapolis. Paper no. 02-04. [ Links ]
Rocscience Inc. 2002. Phase2. Version 6.028 - Finite Element Analysis and Support Design for Excavations. Toronto, Ontario, Canada. http://www.rocscience.com [ Links ]
Sjöberg, J. 2008. Three-dimensional unit stress tensor modeling of complex orebody geometry. Proceedings of the 42nd US Rock Mechanics Symposium (ARMA), 29 June-2 July 2008. American Rock Mechanics Association (ARMA), San Francisco, CA. [ Links ]
Sjöberg, J. and Jacobsson, L. 2007. Bergmekaniska analyser för ny huvudnivá i MUJ (M1250). LKAB Utredning 07-701. (in Swedish). [ Links ]
Umar, S.B., Sjöberg, J., and Nordlund, E. 2013. Rock mass characterization and conceptual modeling of the Printzsköld orebody of the Malmberget mine, Sweden. Journal of Earth Sciences and Geotechnical Engineering, vol. 3, no. 4. pp. 147-173. [ Links ]
Paper received Aug 2015
Revised paper received Nov. 2015

