


Services on Demand
Article
 English (pdf)
 Article in xml format
 Article references
Indicators

Related links
-
 Cited by Google
 -
 Similars in Google
Share

 Permalink
Journal of the Southern African Institute of Mining and Metallurgy
On-line version ISSN 2411-9717
Print version ISSN 2225-6253
J. S. Afr. Inst. Min. Metall. vol.117 n.3 Johannesburg Mar. 2017
http://dx.doi.org/10.17159/2411-9717/2017/v117n3a11
GENERAL PAPERS
A mining perspective on the potential of renewable electricity sources for operations in South Africa: Part 2 - A multi-criteria decision assessment
R.G. VottelerI; A.C. BrentII
ISchool of Public Leadership, Faculty of Economic and Management Sciences, Stellenbosch University, South Africa
IICentre for Renewable and Sustainable Energy Studies, Department of Industrial Engineering, Stellenbosch University, South Africa and Sustainable Energy Systems, Engineering and Computer Science, Victoria University of Wellington, New Zealand
SYNOPSIS
The first in this series of two papers, on the potential of renewable electricity sources for mining operations in South Africa, investigated the internal structure of mining corporations to evaluate feasible alternative electricity sources that were identified as through earlier research. The purpose of this paper is to combine current knowledge about the external macroeconomic and the internal environments to produce a clear picture of how renewable sources of electricity could perform from the perspective of mining corporations in South Africa. The multi-attribute value theory (MAVT) approach was adapted to structure the research and results. The model was fed with real-time data provided from five different energy companies and four mining corporations operating in South Africa. The results show that the performance of hybrid versions of the currently used electricity sources (diesel generators and Eskom grid connection) with solar PV and onshore wind is favourable compared with the current sources alone. The advantage of diesel generators is significantly greater than that of the Eskom grid connection. By combining the macroeconomic influences with the MAVT results, hybrid solar PV versions are identified as having the greatest potential. In second place are hybrid wind solutions, which have the shortcoming that good wind conditions occur only in coastal regions where there are fewer mining activities. Geothermal hybrid versions are the least favourable owing to the lack of service infrastructure and high initial investment costs.
Keywords: Multi-criteria decision analysis, multi-attribute value theory, renewable electrical energy.
Introduction
Recent developments in the macroeconomic environment necessitate an investigation of the internal structure of mining corporations to evaluate possible alternative electricity-generating sources (Roehrl and Riahi, 2000). To be able to combine current knowledge of macroeconomic factors and the internal structure of mining corporations, the research process is presented in two papers. The first paper (Votteler and Brent, 2016) investigated the internal structure and argued that a strategic tool should be used to evaluate electricity sources from the perspective of mining corporations. The multi-criteria decision analysis (MCDA) approach was selected as the most appropriate strategic tool. Based on a literature review of previous similar MCDA approaches in energy planning, it was concluded that no adaptation of MCDA methods could be found from a corporate, mining, or South African perspective. Finally, the paper investigated the internal evaluation structure in collaboration with mining corporations, by identifying the criteria they use to evaluate electricity sources.
In this second paper we set out to identify the best MCDA method to investigate a potential fit for renewable energy sources at mining operations. We then implement the selected MCDA method. Previous macroeconomic research identified non-grid-connected solar PV, onshore wind, and geothermal power in hybrid versions along with the current on-site diesel generators and grid connection to Eskom as the most lucrative. The choice of these hybrid versions is based on the constant electricity demand of mining operations and the intermittency of the renewables. The business model identified was self-generation via own investment (Votteler and Brent, 2016). The first paper describes the evaluation criteria used by mining corporations to determine this choice. All further information for implementing the MAVT method was gathered in cooperation with mining corporations and renewable and conventional energy companies in order to use real-time data.
The purpose of this paper is to analyse and compare the strengths and weaknesses of these potential electricity sources, according to a possible fit to the specific needs of mining corporations and from their perspective. To optimize the learning process for mining corporations in order to equip them with an understanding of renewable energy technologies and for energy companies to learn how to approach these potential new customers, more research has to be conducted (Steinhaeuser et al., 2012).
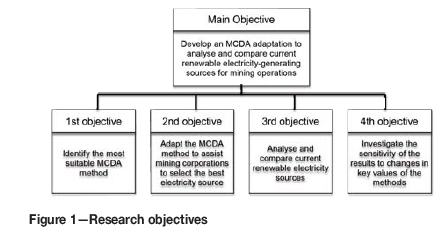
The research objectives are illustrated in Figure 1. The first objective, to investigate the best-suited MCDA, method was based on a literature review. The ensuing objectives were based on primary research investigations. The second objective was to adapt the selected MCDA method. The data was gathered in cooperation with energy companies supplying the electricity sources and mining corporations using them. Based on the third objective, the results of the adapted MCDA method were analysed to identify strengths and weaknesses of the selected sources. The last section investigated the sensitivity of the method to possible changes to the results when alternating key input data.
MCDA method selection
Research approach
To conduct secondary research, data was used that was gathered and recorded by others prior to the current project. The advantages were the assurance of readily available data and the relatively quick and inexpensive acquisition of such data. The disadvantages were that the information may be outdated, that there may have been a variation in the definition of terms, and that different units of measurement may have been used. Cross-checking the data could reduce these disadvantages; this would entail comparing similar data (Zikmund and Babin, 2010). The media used for the literature review were books, the internet, conference proceedings, journal articles, Master's and doctoral dissertations, and case studies.
Petticrew and Roberts (2006) identified six different types of literature review. This paper made use of a 'conceptual review', which aims to synthesize areas of conceptual knowledge that can contribute to a better understanding of the issues studied. The objective of such a review is to provide an overview of the literature in a given field, including the main ideas, models, and debates.
The first objective was to identify the most suitable MCDA method for the research context of this paper, which was based entirely on secondary literature. The literature is discussed in subsequent sections. Firstly, requirements of this research to identify the most suitable MCDA method are given and explained. By fulfilling the requirements it was possible to ensure that all the areas of the investigation were addressed. Secondly, the different MCDA 'schools of thought' are introduced and their possible use according to the requirements discussed. The value measurement school of thought was selected. The next step was to use the same requirements to analyse the possible contribution of each method. Three well-established and comprehensive methods were investigated.
The second objective was to adapt the selected MCDA method to the decision structure of mining corporations, evaluating different electricity-generating sources. The secondary literature provided the background knowledge for the selected MCDA method and the foundation for the adaptation.
Requirements of the MCDA method
This section describes the requirements of the MCDA method to best address the main research objective, namely to analyse and compare potential electricity sources for mining corporations. The required elements were used to scan different MCDA categories and methods to identify the one best-suited for adaptation in the context of this investigation. It is important to mention that it was often difficult to justify the selection of a method. None of them are perfect, nor is it possible to apply them to all decision problems. Each method entails its own limitations, characteristics, principles, and perspectives (Ishizaka and Nemery, 2013). Consequently, the following requirements were used to make the best possible selection.
1. Once-off decision - Specialist knowledge of the characteristics of the MCDA method is required in order to contribute successfully to this type of decision. The decision to select the best-suited electricity source has to be made once and is not recurring. Only after years of usage a re-evaluation may be necessary as price structures or performance levels may have changed (Khatib, 2008)
2. Investigate the evaluation structure - The implementation of the MCDA method has to bring about a clear understanding of the internal evaluation structure of mining corporations. It has to show how each criterion contributes to the overall decision. This can contribute to renewable energy companies having a better understanding of a potential new type of customer, namely mining corporations
3. Analyse alternatives separately - The method has to deliver the basis for a separate analysis of each alternative. It should be possible to illustrate and explain the strengths and weaknesses of an alternative independently of the other alternatives. The decision-maker has to understand the implications of selecting a certain option
4. Compare alternatives - It has to be possible to compare alternatives according to their strengths and weaknesses. The results should demonstrate the advantages and disadvantages of selecting one electricity source in preference to the others. The results ought to provide the decision-maker with the necessary information to optimize his or her selection
5. Incorporate unknown alternatives - As the concept of renewable electricity sources is relatively new for mining corporations in South Africa (Boyse et al., 2014), the method has to be able to incorporate the analysis of alternatives not known to the decision-maker. The basis of the adapted method, before implementing the data of alternatives, should not include any predispositions towards a specific outcome.
Possible MCDA methods
The purpose of this section was to select the MCDA method that is best suited to contribute to the research objectives. This was achieved by investigating the categories and methods according to the requirements listed above (see Table I). For structural purposes the reasoning was subdivided into the selection of the most appropriate MCDA category, and then the method.
Selection ofMCDA category
It is generally accepted that MCDA methods can be divided into three broad categories, or schools of thought, namely the value measurement methods, the goal, aspiration, or reference level methods, and outranking methods (Stewart and Belton, 2002). The list below introduces the theory of each category, followed by an examination of which requirements are or are not satisfied. Lastly, the category is selected and reasons are stated.
► Goal, aspiration, or reference methods - These methods establish, in coordination with the decision-makers, desirable or satisfactory levels of achievement for each evaluation criterion. The results of the implementation identify the alternative that is closest to realizing these goals and aspirations (Roy and McCord, 1996). The method is preferably used for decision problems of a repetitive nature or familiar to the decision-maker (Stewart and Belton, 2002). This contradicts requirement 1 and 5. In addition, the methods necessitate that performance measures are available in quantitative form (Chang, 2011). This eliminates requirements 2, 3, and 4, as selected criteria of this study are of qualitative nature
► Outranking methods - These methods compare alternative courses of action in a pairwise approach. This is initially done on a criterion-to-criterion basis in order to state the preference for one over the other. Thereafter the methods aggregate such preferences of all selected criteria in order to identify the level of evidence favouring one alternative over the others. Partial and complete rankings are constructed (Geldermann and Schöbel, 2011). Consequently, the methods investigate the internal evaluation structure and compare alternatives that are new or known to the decision-maker, which fulfils requirements 2, 3 and 4. Requirement 3 is not satisfied, as pairwise comparisons are used, which makes it impossible to analyse alternatives separately. The methods are used for discrete choice problems (Bouyssou et al., 2002), which satisfies requirement 1
► Value measurement methods - The methods create numerical scores for each alternative analysed to illustrate the preferences associated with each alternative. Initially, scores are established for each selected criterion separately. Thereafter, scores are synthesized on the basis of relative importance. This, in turn, effects aggregation into higher-level preference methods-which enables the drawing up of a complete ranking with scores. The basis of the methods differs as some are built on pairwise comparisons and others on preference functions (Keeney, 1992). The foundation of constructing preference functions for each criterion fulfils requirements 2 and 3. As the decision-maker does not have to formulate any pre-set ambitions, requirement 5 is satisfied. The methods are suited for once-off decision problems, to fulfil requirement 1 (Triantaphyllou, 2000).
For the purpose of this study, the value measurement school of thought was selected, while the outranking methods were a close second. The value measurement methods satisfied all requirements. Firstly, the value measurement methods were better suited than the outranking methods in regard to requirement 2. By creating value functions for each selected criterion, incorporating relative weights, the internal structure of mining corporations in order to to evaluate electricity sources is illustrated in detail. The outranking methods did not satisfy this requirement to the same extent, as criteria were not investigated separately. In addition, the outranking methods were not able to fulfil requirement 3, as the results of the analysis were not separate for each alternative, but appeared in relation to each other. Lastly, the goal, aspiration, or reference school of thought could not fulfil any of the requirements.
Selection of value measurement method
The selected value measurement school of thought, also known as the 'full aggregation approach', was the most detailed and comprehensive MCDA option (Eliasson and Lee, 2003). Within this school of thought different methods exist. This section investigates three established method designs that produce the most detailed results of the value measurement methods (Ishizaka and Nemery, 2013; Linkov and Moberg, 2012). In the following list, the choice of the best-suited method for the adaptation to the context of this paper is identified and discussed:
► Measuring attractiveness by the categorical-based evaluation technique method (MACBETH) - This method consists of three steps. The first step is to structure the problem, which is followed by constructing a judgement matrix on the basis of interval pairwise comparisons. If consistency of the matrix is proven, the attractiveness can be calculated (Ertay et al., 2013). As the method uses pairwise comparisons, it is difficult to analyse alternatives separately, which contradicts requirement 3. The other requirements can be fulfilled
► Analytical hierarchy process (AHP) - This method comprises three steps, similar to MACBETH. Firstly, the problem is structured, followed by the creation of a judgement matrix based on ratio pairwise comparisons. Again, if results are consistent, the attractiveness can be calculated. A sensitivity analysis can be conducted to reduce uncertainty (Stein, 2013). As this method also uses pairwise comparison, even though on a ratio scale, requirement 3 is difficult to accomplish. However, all other requirements can be satisfied
► Multi-attribute value theory (MAVT) - This method entails five steps. The first step is to structure the problem. The second is to determine the criteria that the decision-maker uses to evaluate the decision problem. Thirdly, a scale is developed to measure each criterion. Fourthly, a value function is created for each criterion. Lastly, the data for each alternative is implemented and results can be analysed and compared. A sensitivity analysis can then be conducted (Stefanopoulos et al., 2014). As a preference function is constructed for each criterion, alternatives can be analysed separately and in comparison to each other.
The MAVT was selected as it satisfies all the requirements. The method can be used for once-off decisions (Ferretti et al., 2014). It is the most comprehensive MCDA method and the most detailed way to investigate the internal structure of mining corporations, as a preference function is created for each criterion. The MACBETH and AHP methods are less satisfying on this requirement as each criterion is not treated separately (Ishizaka and Nemery, 2013:6). Consequently, only the MAVT is able to analyse alternatives separately, as results are not based on a pairwise comparison. The three methods enable the decision-maker to choose between unfamiliar alternatives, as no aspirations or goals are required.
The multi-attribute value theory approach
The first step is to structure the problem. As discussed in the preceding paper and again briefly in the introduction of this paper, the type of decision for mining corporations is of a once-off nature, as the electricity source will most likely be used for the life of the mine. The implemented method intends to assist and provide more structure in the decision-making of mining corporations in South Africa to enable them to understand how renewable energy could perform as a solution for their unique needs. Based on past macroeconomic research, the choice entails the following.
► The electricity sources available were diesel generator; hybrid diesel generator/solar PV; hybrid diesel generator/onshore wind power; hybrid diesel generator/geothermal power; Eskom grid connected; hybrid Eskom grid connected/solar PV; hybrid Eskom grid connected/onshore wind power; hybrid Eskom grid connected/geothermal power (Votteler and Brent, 2016)
► The business model used to realize the potential project was self-generation in the form of own investment (Votteler and Brent, 2016).
Determine criteria
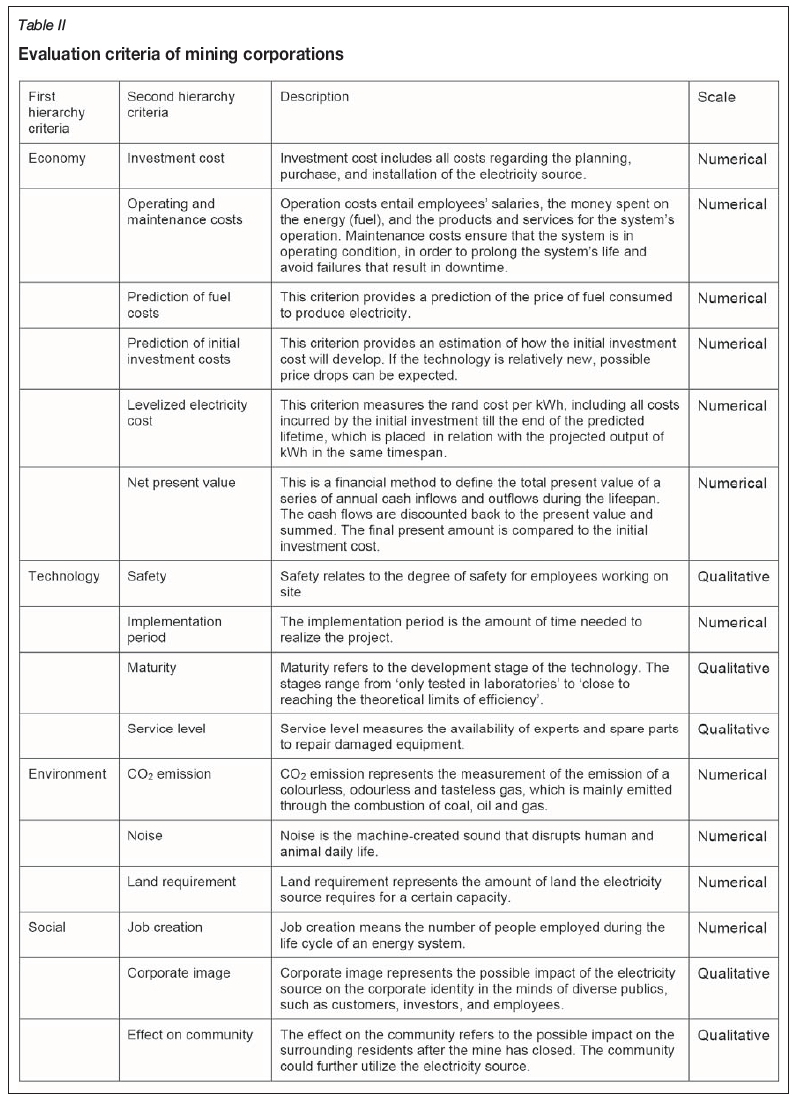
The second step was to identify the criteria that mining corporations are currently using to evaluate the decision problem stated above. The criteria, in Table II, were identified in the preceding paper in cooperation with four mining corporations.
Identify data
The third step was to develop a scale for each criterion. These scales are summarized in Table II. A local numerical scale was established for the 11 measurable criteria. A local scale entails all values of alternatives analysed, from the worst to the best. An example is provided in Figure 2 in the following section. The reason for developing scales is the fast-changing environment where values, which are based on factors like technological progress (Stewart and Belton, 2002), alter. This makes it impossible to use global scales.
A global qualitative scale was developed for the remaining five criteria to make comparability possible (Stewart and Belton, 2002). A pilot study was conducted with one expert from the renewable field and one expert from the mining industry to ensure that the qualitative scales were interpreted consistently. The data for the electricity sources to feed all criteria and to develop the scale were revealed in cooperation with four mining corporations and five different energy companies that have specialist knowledge of one or more of the sources. The data was backed up with professional literature to ensure accuracy.
Define value function and importance weight
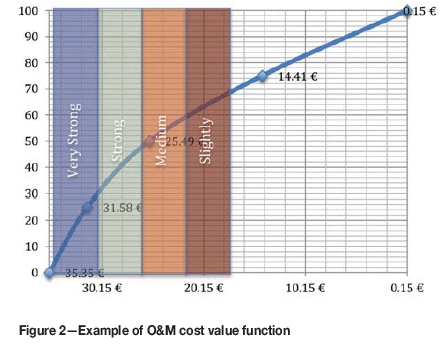
The fourth step was to develop the value functions and assess the relative importance weights of each criterion. The value function reflects the preference of the mining corporation as the decision-maker (Stewart and Belton, 2002). Figure 2 provides an example of the operating and maintenance (O&M) cost value function. The coloured sections are explained in the section 'Criteria and value functions' below. The vertical axis represents the value to the respondent, from worst (0) to best (100). The horizontal axis gives the scale for the specific criteria. The worst value is situated on the left with zero value points while the best value is situated on the right with 100 value points.
The procedure for all four mining corporations was the same. All respondents had to go through all criteria and were asked three questions. Firstly, they had to identify the point on the scale that represents halfway in value (50) for them. If there was no preference the point would stay in the middle and a linear function would result. In the case of the examples, an initial cost reduction was more important -which results in a convex function. A more convex curve would represent a stronger preference. A possible reason for the more convex curve could be a tight budget, and the tighter the budget the more convex the function would be, as the higher prices cannot be afforded. Question two and three followed the same procedure between the value points of 0 and 50, and 50 and 100. For each value function the average of the four responses was taken. Outliers were defined as a variation of more than 15% of the numerical scale that they are measured on. No outliers occurred. The reason for translating all criteria into scales from 0-100 was to reveal the respondents' value and to equalize numbers for result calculations (Stewart and Belton, 2002). The value score (vertical axis) for each criterion was determined at the rectangular crossing point on the value function, based on its numerical value (horizontal axis). In Figure 2, an electricity source with O&M costs of 15 euros would obtain a value score of 73.
The importance weight shows the magnitude of influence that a single criterion contributes to the final decision. The procedure entailed two stages. In the first stage, the importance weight within each category, namely economy, technology, environment, and social, was identified. The questioning was always conducted in the same way. The respondent first had to identify the most important criterion; this received 100 points, followed by the second most important with less than 100 points, depending on how much less it was influencing the decision. The second stage entailed rating the categories themselves, again starting with the most important one with 100 points. To obtain the overall relative importance weight, the weight of each criterion was multiplied with the corresponding category weight (Ishizaka and Nemery, 2013).
Determine results
This investigation produced two forms of results, which are discussed in detail in a later section. First, an overall score for each electricity source is presented. The score was calculated by multiplying the relative importance weight of each criterion with the corresponding value score. The multiplied scores of each criterion were added to obtain the overall value of the electricity source. The scores were normalized and measured against the best-performing source with 100 points. The second result is represented in two matrix diagrams for each electricity source. The matrix illustrates the performance of all criteria for each source. One matrix includes the importance weights, and the other excludes them.
The MAVT for mining corporations to evaluate electricity sources
Selected electricity sources
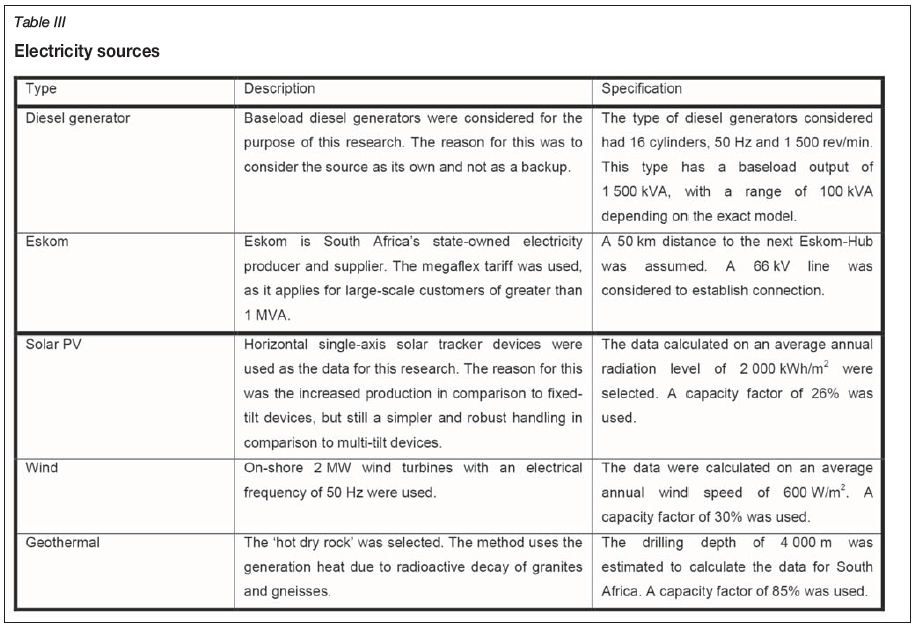
This section introduces the electricity sources that were considered for possible solutions at mining operations. As mentioned earlier, previous research by the authors argued that the selected renewable sources in hybrid versions with current sources presently have the highest potential for mining corporations in South Africa. Table III briefly describes each source and provides specifications of the exact type of technology used. The energy companies participating in this study recommended the types of technologies.
Key values used for calculations
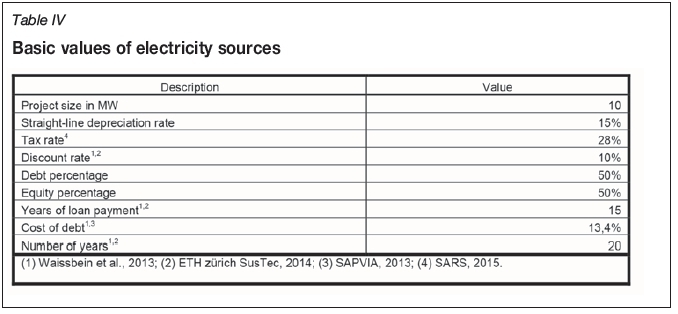
This section presents two different types of data tables. Table IV represents the general values, which were used for all electricity sources analysed, especially for the economic criteria. By applying the values it was ensured that the same foundation was used to compare sources. Owing to the relatively young market and the experimental stage in which mining corporations find themselves regarding renewables, a smaller project size of 10 MW was selected. Each value was discussed with all mining and energy companies contributing to this study and all were found to be most suitable. Where required, the values were double-checked with official sources to ensure that they were in line with international standards.
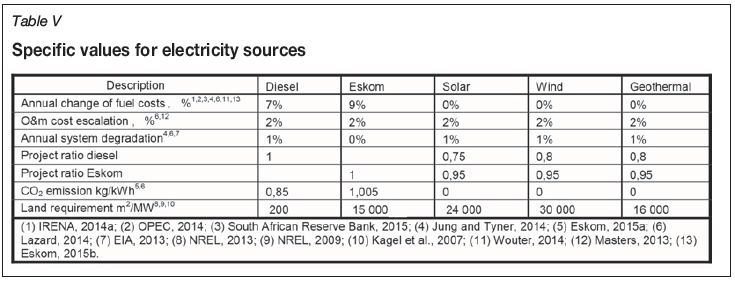
Table V provides the specific values for single and hybrid electricity sources. The values were used to calculate the data to feed the criteria of the MAVT method of this paper. The values were again provided by the energy companies and double-checked with professional, official sources. It is important to mention that the current sources, namely diesel generators and the grid connection to Eskom, are considered as the main sources. Technological standards, especially the intermittency of renewables, require the current sources to contribute continuously to the supply to ensure a stable system. Diesel generators have higher ratios than the grid connection to Eskom, because of their minimum load ratios. For illustration purposes, a 10 MW hybrid diesel-solar PV project would entail a 10 MW diesel generator and a 7.5 MW solar PV plant.
Criteria and value functions
This section represents an overview, illustrated in Table VI, of all relevant data regarding the adaptation of the MAVT method for South African mining corporations to analyse and compare current with hybrid renewable electricity sources. The left column of Table VI shows the criteria investigated, followed by the specific data for the electricity source options and lastly the results for the importance weight and value function. Most of the numerical measured criteria were again double-checked with professional, recognized official sources, including the results in Tables IV and V.
The numerical criteria data for the hybrid electricity options were calculated for fixed costs according to the project ratios in Table V. For example, the investment cost for a hybrid diesel-solar PV of € 1 425.00 was calculated by: 1*€450.00+0,75*€ 1 300.00. The two variable cost criteria, namely the actual and predicted fuel costs, were calculated according to the electricity contribution, where the renewable electricity has priority and the conventional source is used to satisfy the remaining demand. The levelized electricity cost and net present value entail scenarios of both fixed and variable costs, and consequently both were considered in the calculations.
The relative importance weight was normalized according to the most important criterion, namely investment cost with a score of 100. The number indicates by how much more, or less, weight a criterion influences the final decision. The number in brackets indicates the ranking for illustration purposes. The last column specifies the level of preference in the value function regarding each criterion. All functions were linear or convex, consequently the column indicates the extent to which the function is convex. The extent was categorized into four levels, as can be seen in Figure 2. The point moving on 50 points of the value scale was considered. For a linear function the point is in the middle of the horizontal axis. As the point moves further to the left, the convexity of the curve increases and therefore there is a preference not to pay the high O&M costs.
To enable understanding of all data measurements, the following list introduces the criteria measured according to a qualitative scale. A global scale was used, as the scale is set and unchanging. The respondents of mining corporations were asked to rate the corporate image and effect on community criteria, as they are specific to the mining industry. All other data for the qualitative criteria was gathered from the energy companies, because of their expertise in the field. The scales that were developed and measured are presented in Table VII.
Results
Overall ranking ofelectricity sources
This section contains the analysis and evaluation of the results of the MCDA implemented for the purposes of this paper. The results are based on the input data introduced in the previous sections.
As explained previously, two types of results were generated: firstly, the overall ranking of electricity sources analysed, and secondly, the individual performance matrix of each source based on the evaluation criteria. The overall ranking is illustrated in Figure 3. The hybrid version consisting of Eskom with solar PV was ranked as the best-performing source, followed closely by another hybrid version consisting of Eskom with onshore wind, and Eskom alone. The three hybrid versions with diesel generators, and the hybrid consisting of Eskom with geothermal power had very similar overall scores. The lowest-performing source was a diesel generator alone.
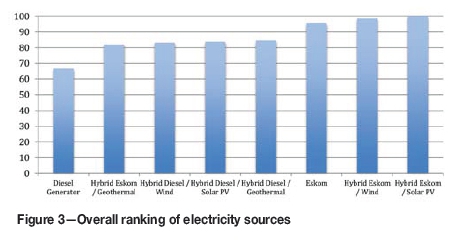
It is important to note from the results in Figure 3 that the hybrid versions of wind and solar PV along with current sources were always ranked more highly than current sources only. The difference between hybrid applications and only diesel generators was marked. However, the advantage of using only Eskom was relatively small.
Individual performance ofelectricity sources
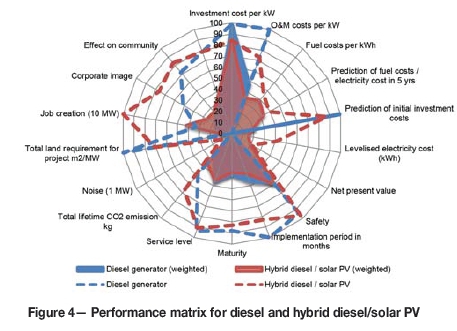
The individual performances of electricity sources are presented in this section. For illustration purposes two sources are always represented in each figure, giving the score for the currently used source only and for the corresponding hybrid version. Consequently, it is possible to identify and evaluate how exactly hybrid versions performed differently from the sources used currently. The solid shaded area represents the result including the importance weights. The dotted lines represent the criteria scores only, excluding the importance weights.
The performance matrix for diesel generators and a hybrid version with solar PV is illustrated in Figure 4. The advantages of diesel generators were the low initial investment cost, the small space requirement, and the short implementation period. However, the running costs, including the expected diesel price increases, were a serious weakness. A hybrid version with solar PV increased initial investment and lowered fuel consumption. The net present value indicated that about €44 million can be saved over a period of 20 years using a hybrid version. Further advantages of a hybrid version were lower levelized costs, fewer CO2 emissions, a better corporate image, and a more positive effect on the community.
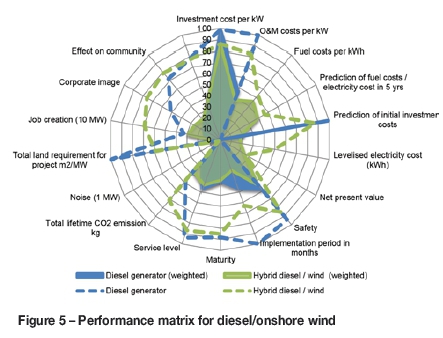
The performance matrix for diesel generators and a hybrid version with onshore wind is illustrated in Figure 5. This hybrid was very similar to the hybrid version with solar PV above. The implementation period of 15 months for the hybrid onshore wind version was slightly longer than the 12 months required for the solar PV hybrid version. Moreover, wind had a slightly lower job creation potential. The longterm net present value savings of a hybrid onshore wind version in comparison to only diesel generators amounted to about €55 million, with a possible levelized cost reduction of €0.081.
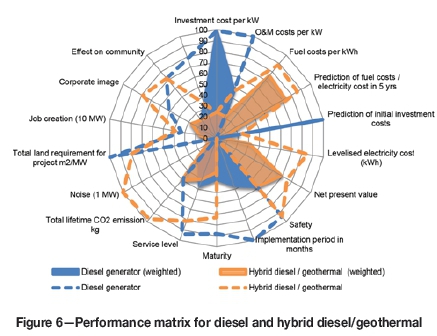
The performance matrix of diesel and a hybrid version with 'hard rock' geothermal power in Figure 6 showed distinctive, different characteristics from the solar PV and onshore wind hybrids. The strong advantages were superior fuel-related costs, levelized costs, net present value, and CO2 emission benefits. One reason for the advantages was the baseload characteristic of 85% of geothermal electricity generation. The clear disadvantages were the extremely high initial investment costs and an implementation period of 36 months. The net present value savings amounted to approximately € 147 million. All three hybrid versions with diesel showed very similar overall scores in Figure 3 and a considerably improved rating compared to only diesel generators.
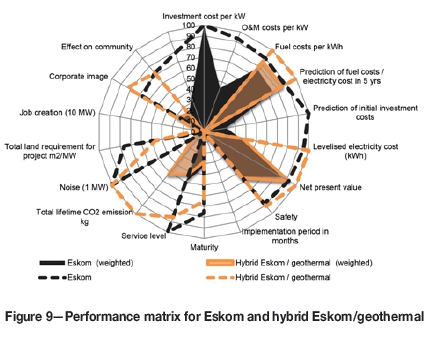
Figures 7, 8, and 9 represent Eskom and the renewable hybrid versions. Eskom in hybrid versions with solar PV, onshore wind, and Eskom alone were the best-performing sources. As can be seen in Figure 3, the improvement when using Eskom alone compared with the hybrid versions was not particularly significant. The hybrid version with geothermal was ranked in the second-last position and therefore performed worse than Eskom alone.
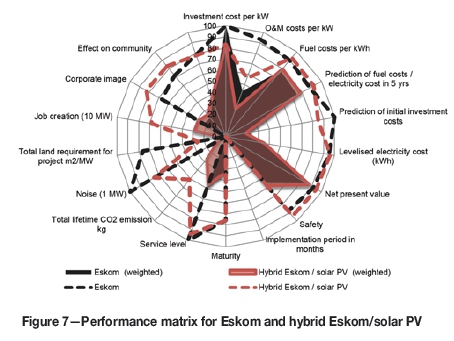
The reason for the minimal performance improvement can be seen in the matrix for Eskom and a hybrid version with solar PV. The disadvantage of the hybrid version was again the initial investment cost and the O&M costs. Slight improvements can be seen in fuel costs, levelized costs, and net present value. The hybrid version accumulated a net present value saving of €5 million over the timespan of 20 years. Further improvements can be seen in respect of job creation, corporate image, effect on community, and CO2 emissions.
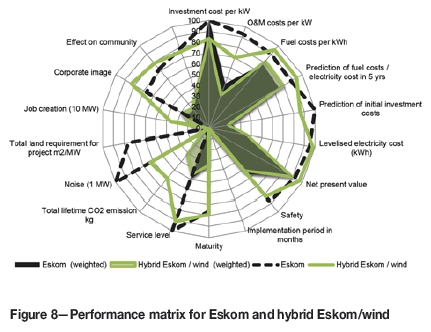
The performance matrix for Eskom and a hybrid version with onshore wind is illustrated in Figure 8. The performance on all criteria was very similar to the solar PV hybrid version, which displayed the same pattern as the diesel versions. The wind hybrid version performed slightly better on all economic criteria and in respect of CO2 emissions. The net present value savings in comparison to Eskom were only €10 million. However, worse performance, especially relating to safety, maturity, job creation, and space requirements, moved this option to the second ranking.
The performance matrix for Eskom and a hybrid version with geothermal power is shown in Figure 9. The overall poo ranking can be explained as being due particularly to the ver high initial investment and O&M costs, which represented th< worst values in comparison to the other sources, and their high importance weight. However, significant long-term benefits lay in having the lowest fuel costs, and were to be had in respect of levelized costs, net present value, and CO2 emissions. Net present expenses at €55 million were the lowest, and were €15 million less than only Eskom.
Discussion of results
The results show similar patterns for the use of renewables in hybrid versions with currently used electricity sources. Economically, the move to renewables has a long-term advantage as it requires a shift from constant high operational cost to an initially high capital investment with low operational expenses, especially for mines running on diesel generators. Considering the currently increasing Eskom tariffs, the benefits of using renewables will increase further.
In this study, solar PV had the greatest potential, as a vast number of mining areas are in prime solar radiated regions in central South Africa, the service structure is well developed (Votteler and Brent, 2016), and it is the best performing source from the perspective of mines connected to the Eskom grid and almost identical to all renewable hybrid versions with diesel generators.
Wind power was ranked second owing to the fact that it can be applied only on a limited scale in the coastal regions of South Africa, where there are few mines. The service infrastructure is also well developed (Votteler and Brent, 2016) and performance from the perspective of mines is only slightly behind that of solar PV. However, the economic performance of onshore wind is slightly better than that of solar PV.
Geothermal power had the weakest overall potential for mining operations in South Africa. Although it has long-term benefits from the perspective of mines, a considerable initial investment has to be made. The source did not outperform Eskom alone and is only minimally ahead of the other diesel hybrid versions. The disadvantage of a relatively young technology, in which there is little experience in South Africa, is that it increases the investment risk. Moreover, service infrastructure has not been developed yet and areas with good geothermal potential in the northeastern region of South Africa are well connected to the Eskom grid (Votteler and Brent, 2016). Nevertheless, the study has shown a great potential for future development, especially for long-term success, which could be realized with a growing geothermal industry in South Africa.
Sensitivity analysis
The following sections address how changes in the most influential input data would influence the overall results. The selected variables are the system lifespan, the predicted fuel cost, and the forecast implementation of a CO2 tax. The lifespan is of interest for mining corporations, as lifespans of mines differ-which has an impact especially on the economic framework of the project. The prediction of tariff increases by Eskom and fuel and diesel costs have a great influence on economic criteria and were therefore double-checked with official sources. However, exact forecasts for the next 20 years can be imperfect, which necessitates an investigation into consequences of the results for worst- and best-case scenarios. Lastly, the possible impact of a CO2 tax was considered, as all contributing mining corporations mentioned it as a point of concern.
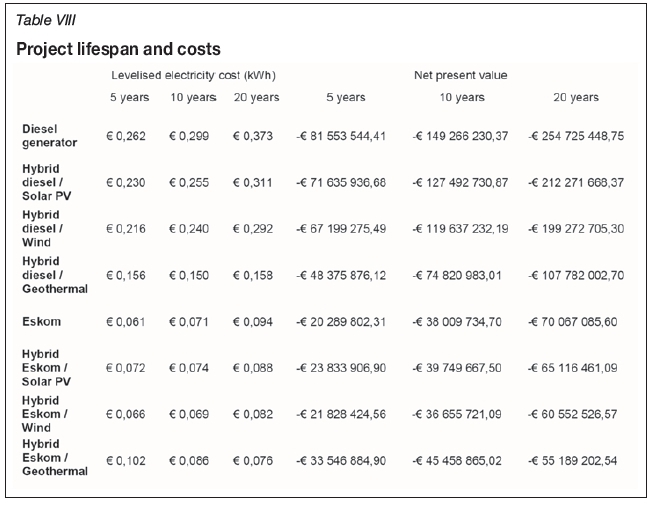
Lifespan of the project
The lifespans considered in this section are 10 and 5 years. The criteria selected to illustrate the effect on performance are the levelized costs and the net present value, as shown in Table VIII. The options with a diesel generator remain in the same order for both criteria; nevertheless, the shorter the lifespan the smaller the advantage becomes. Options with Eskom, on the other hand, undergo a change in ranking on those two criteria. On a 20-year lifespan all hybrid sources perform better than Eskom alone. On a 10-year span only the hybrid version with onshore wind can compete. Based on 5 years, Eskom alone is the best-performing option.
Nevertheless, the overall ranking on considering all criteria does not change significantly, as the change of lifespan affects only economic criteria and CO2 emission. The hybrid versions of Eskom with solar PV and wind are in top position, followed by Eskom alone. The only change is the shift of the diesel hybrid geothermal version from fourth to seventh place. The reason for this is the gain in weight of initial investment on a lower calculated lifespan, as there is a smaller saving on fuel costs.
Eskom tariffand diesel price forecast analysis
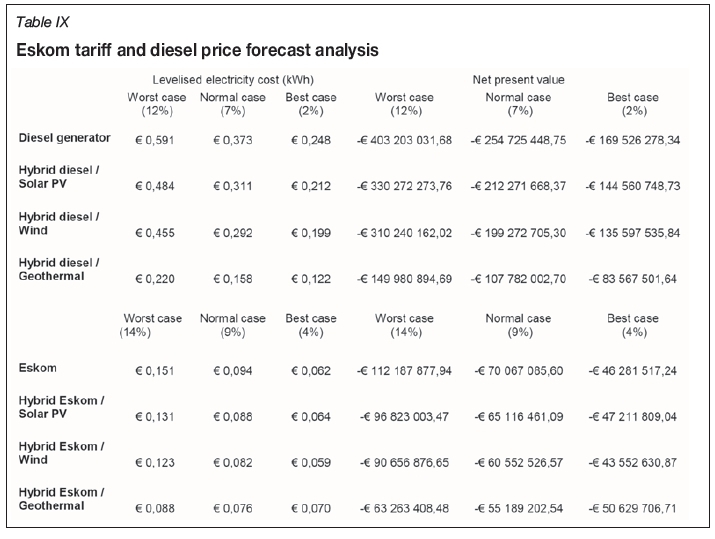
Changes in fuel and tariff costs of present sources over the next 20 years cannot be forecast precisely. As discussed previously, predictions were made with the aid of experts' opinions and a literature review. However, as the influence of the forecast on the running costs is considerable, a scenario analysis was conducted. The results are presented in Table IX. For illustration purposes, the levelized cost and net present value criteria were considered.
The costs of the diesel generator and hybrid version are presented in the top section of Table IX. A variation of about 5% of the predicted annual 7% diesel price increase was investigated. The different scenarios did not affect the overall ranking of the sources. The levelized costs showed a great sensitivity to a change in the diesel price, with the costs of the worst-case scenario being more than double those of the best case. The net present values showed that the usage of renewables lowers the sensitivity to fuel price changes. The differences in value between worst and best case were significantly less for the hybrid versions.
Again, the overall rankings for all Eskom versions were not affected by the changes. It is noteworthy that only the hybrid version with wind could compete with Eskom alone in the best-case scenario based on the two criteria. In the other scenarios Eskom is the most expensive version. The greater independence from tariff changes was still noticeable, but not as great as with diesel versions.
Implications ofa C02 tax
The possible impact of the implementation of a CO2 tax in 2016 is again illustrated with the criteria of levelized costs and net present value, as the effect is the greatest. The overall ranking of all electricity sources was not affected. A tax of R120 per ton of CO2 was considered, with an annual increase of 10%. As it is not yet certain how Eskom is going to handle the tax, the full amount was calculated for illustration purposes (Mbadlanyana, 2013; The Carbon Report, 2015). As can be seen in Table X, the effect on levelized costs for diesel and Eskom alone amounted to just over €0.01 and € 10 million net present worth. The usage of hybrid versions reduces the increase to less than €0.01 and €6 million.
Conclusion
The research presented in this paper is based on the results from the previous paper, in which the MCDA method was selected as the most appropriate research framework and the criteria that South African mining corporations used to evaluate the selected electricity sources were revealed. The purpose of this paper was firstly, to identify the most suitable MCDA method for adaptation, therefore the MAVT method was selected, and secondly to analyse and evaluate the selected sources - which was conducted in cooperation with mining and energy companies operating in South Africa.
The main results of the adapted MAVT method showed that the hybrid versions with solar PV and onshore wind were more favourable than diesel generators or the Eskom grid connection alone. The advantages of diesel generators were significantly greater than those of Eskom grid connection. As renewable sources are steadily advancing and the currently used sources are becoming ever more expensive, the trend will shift further towards renewables. In combining the macroeconomic influences with the MAVT results of this paper, hybrid solar versions were identified as having the greatest potential. Hybrid wind solutions were in second place, as good wind conditions occur only in coastal regions where there are fewer mining activities. Geothermal hybrid versions were selected as least favourable owing to the poor service infrastructure and high initial investment costs.
The performance matrixes indicate that the usage of renewable hybrid versions contributes to long-term success, but requires an initial shift from operational to capital expenses. Considering the overall rankings and specifically the levelized costs, renewables are already profitable with a 5-year lifespan and diesel generators. However, for Eskom hybrid versions, only wind is profitable over a 10-year span and the rest over 20 years.
This paper provides objective information for use by the management of mining corporations in South Africa. The aim is to illustrate how the relatively new opportunity of renewables could perform from the perspective of mining corporations, while at the same time considering the macroeconomic influences.
References
Bouyssou, D., Jacquet-Lagreze, E., Perny, P., Slowinski, R., Vanderpooten, D., and Vincke, P. 2002. Aiding Decisions with Multiple Criteria: Essays in Honor of Bernard Roy. Kluwer, Dordrecht. [ Links ]
Boyse, F., Causevic, A., Duwe, E., and Orthofer, M. 2014. Sunshine for mines: Implementing renewable energy for off-grid operations. Carbon War Room, Washington, DC. [ Links ]
Chang, C.T. 2011. Multi-choice goal programming with utility functions. European Journal of Operational Research, vol. 215, no. 2. pp. 439-445. [ Links ]
EIA. 2013. Updated capital cost estimates for utility scale electricity generating plants. US Energy Administration Information, Department of Energy, Washington, DC. [ Links ]
Eliasson, B., and Lee, Y.Y. 2003. Integrated Assessment of Sustainable Energy Systems in China. Kluwer, Dordrecht. [ Links ]
Ertay, T., Kahraman, C., and Kaya, I. 2013. Evaluation of renewable energy alternatives using MACBETH and fuzzy AHP multi criteria methods: The case of Turkey. Technological and Economic Development of Economy, vol. 19, no. 1. pp. 38-62. [ Links ]
Eskom. 2015a. Climate change. http://financialresults.co.za/2012/eskom_ar2012/fact-sheets/006.php#carbon [Accessed 14 July. 2015]. [ Links ]
ESKOM. 2015b. Tariff & charges booklet 2014/2015. Eskom, Johannesburg. [ Links ]
ETH Zürich Sustec. 2014. Derisking renewable energy investment NAMA finance case study exercise. united Nations Development Program, New York. [ Links ]
Ferretti, V., Bottero, M., and Mondini, G. 2014. Decision making and cultural heritage: An application of the Multi-Attribute Value Theory for the reuse of historical buildings. Journal of Cultural Heritage, vol. 15, no. 6. pp. 644-655. [ Links ]
Fraunhofer ISE. 2013. Levelized cost of electricity: Renewable energy technologies. Fraunhofer Institute for Solar Energy Systems, Freiburg. [ Links ]
Geldermann, J. and SCHOBEL, A. 2011. On the similarities of some multi- criteria decision analysis methods. Journal of Multi-Criteria Decision Analysis, vol. 18, no. 3-4. pp. 219-230. [ Links ]
IRENA. 2014a. Analysis of infrastructure for renewable power in Southern Africa. Abu Dhabi: International Renewable Energy Agency. [ Links ]
IRENA 2014b. Renewable power generation costs in 2014. International Renewable Energy Agency, Abu Dhabi. [ Links ]
IRENA. 2013. Renewable energy and jobs. International Renewable Energy Agency, Abu Dhabi. [ Links ]
Ishizaka, A. and Nemery, P. 2013. Multi-criteria Decision Analysis. Wiley, Chichester, UK. [ Links ]
Jacobson, N., Wyder, J., Franklin, S., and McCracken, P. 2013. Data collection of diesel generators in South IT Power Australia, Canberra. [ Links ]
Jongens, A.W.D. 2007. Environmental noise impact assessment for scoping purposes into the establishment of a wind energy facility along the West Coast, north of the Olifants River mouth. Savannah Environmental (Pty) Ltd, Cape Town. [ Links ]
Jung, J. and Tyner, W.E. 2014. Economic and policy analysis for solar PV systems in India. Energy Policy, vol. 74. pp. 123-133. [ Links ]
Kagel, A., Bates, D., and Gawell, K. 2007. A guide to geothermal energy and environment. Geothermal Energy Association, Washington, DC. [ Links ]
Keeney, R.L. 1992. Value-Focused Thinking: A Path to Creative Decisionmaking. Harvard University Press, Cambridge, MA. [ Links ]
Khatib, H. 2008. Economic evaluation of projects in the electricity supply industry. Institute of Electrical Engineering, London. [ Links ]
Lazard. 2014. Levelized cost energy analysis - version 8.0. Lazard Asset Management, New York. [ Links ]
Linkov, I. and Moberg, E. 2012. Multi-criteria decision analysis: Environmental applications and case studies. Taylor & Francis, London. [ Links ]
Masters, G.M. 2013. Renewable and Efficient Electric Power Systems. 2nd edn. Wiley, Hoboken, NJ. [ Links ]
Matek, B. and Gawell, K. 2014. The economic costs and benefits of geothermal power. Geothermal Energy Association, Bochum. [ Links ]
Mbadlanyana, T. 2013. The political economy of carbon tax in South Africa. Africa Insight, vol. 43, no. 1. pp. 77-90. [ Links ]
NREL. 2009. Land-use requirement of modern wind power plants in the United States. National Renewable Energy Laboratory, Denver, CO. [ Links ]
NREL. 2013. Land use requirements for solar power plants in the United States. National Renewable Energy Laboratory, Denver, CO. [ Links ]
OPEC. 2014. World Oil Outlook. Organization of the Petroleum Exporting Countries, Vienna:. [ Links ]
Petticrew, M. and Roberts, H. 2006. Systematic Reviews in the Social Sciences: A Practical Guide. Blackwell, Oxford. [ Links ]
Roehrl, R. and Riahi, K. 2000. Technology dynamics and greenhouse gas emissions mitigation: A cost assessment. Technological Forecasting & Social Change, vol. 63, no. 2. pp. 231-261. [ Links ]
Roy, B., and McCord, M.R. 1996. Multicriteria Mythology for Decision Aiding. Kluwer, London. [ Links ]
SAPVIA. 2013. NERSA consultation on refit rates. South African Photovoltaic Industry Association, Johannesburg. [ Links ]
SARS. 2015. Corporate income tax. http://www.sars.gov.za/TaxTypes/CIT/Pages/default.aspx [Accessed 14 July 2015]. [ Links ]
SOUTH AFRICAN RESERVE BANK. 2015. Inflation targets and results. https://www.resbank.co.za/MonetaryPolicy/DecisionMaking/Pages/TargetsResult.aspx [Accessed 10 July 2015]. [ Links ]
Stefanopoulos, K., Yang, H., Gemitzi, A., and Tsagarakis, K.P. 2014. Application of the multi-attribute value theory for engaging stakeholders in groundwater protection in the Vosvozis catchment in Greece. Science of the Total Environment, vol. 470-471. pp. 26-33. [ Links ]
Stein, E.W. 2013. A comprehensive multi-criteria model to rank electric energy production technologies. Renewable and Sustainable Energy Reviews, vol. 22. pp. 640-54. [ Links ]
Steinhaeuser, I., Sethia, A., Jaiswal, S., Rocha Oliveira, G., Sekine, Y., and Alves, L.C. 2012. Global corporate renewable energy index (CREX). Bloomberg New Energy Finance and Vestas, Copenhagen. [ Links ]
Stewart, T.J. and Belton, V. 2002. Multi Criteria Decision Analysis: An Integrated Approach. Kluwer, Dordrecht. [ Links ]
The Carbon Report. 2015. The proposed South African carbon tax. http://www.thecarbonreport.co.za/the-proposed-south-african-carbon-tax/ [Accessed 20 July 2015]. [ Links ]
Triantaphyllou, E. 2000. Multi-criteria Decision Making Methods: A Comparative Study. Kluwer, Dordrecht. [ Links ]
VESTAS. 2015. Technical specifications V100-2.0MW. Vestas Wind, Denmark. [ Links ]
Votteler, R.G. and Brent, A.C. 2017. A mining perspective on the potential of renewable electricity sources for operations in South Africa: Part 1. The research approach and internal evaluation process. Journal of the Southern African Institute of Mining and Metallurgy, vol. 117, no. 3. pp. 285-297. [ Links ]
Waissbein, O., Glemarec, Y., Bayraktar, H., and Schmidt, T.S. 2013. Derisking Renewable Energy Investment. United Nations Development Program, New York. [ Links ]
Wouter, F. 2014. Energy management AGA. Presentation. AngloGold Ashanti, Johannesburg. [ Links ]
Zikmund, W.G. and Babin, B.J. 2010. Exploring Marketing Research. 10th edn. Thomson,.Mason, OH. [ Links ]
Paper received Sept. 2015

