


Services on Demand
Article
 English (pdf)
 Article in xml format
 Article references
Indicators

Related links
-
 Cited by Google
 -
 Similars in Google
Share

 Permalink
Journal of the Southern African Institute of Mining and Metallurgy
On-line version ISSN 2411-9717
Print version ISSN 2225-6253
J. S. Afr. Inst. Min. Metall. vol.117 n.3 Johannesburg Mar. 2017
http://dx.doi.org/10.17159/2411-9717/2017/v117n3a9
GENERAL PAPERS
Geotechnical characterization of ore related to mudrushes in block caving mining
R.L. Castro; K. Basaure; S. Palma; J. Vallejos
Univeristy of Chile, Santiago, Chile
SYNOPSIS
Mudrushes are sudden inflows of mud ore into underground mining facilities. They may cause harm to people and equipment, production delays, dilution of ore, and mine closure. The aim of this work is to characterize, by geotechnical laboratory tests, mud from a block cave and to derive mechanical reasons for the failure of this material while it is being drawn. We used ore samples from extraction points closed due to mudrush potential from the Diablo Regimiento Sector at El Teniente Mine, which represent the three types of mud ore. Characterization showed that the samples comprise gravel and sand with silt and clay grain sizes, whereas the fine particles are classified as low-plasticity silt and clay. Only small differences in fines content, density, and packing were found. The effects of density and degree of saturation on ore strength in unconfined conditions were evaluated. It was found that relative density is the most relevant variable that governs the unconfined strength. Triaxial consolidated tests showed a linear relationship between deviatoric strength and effective confining stress. Deviatoric strength is related to the capacity to flow under triaxial conditions, and consequently it could be related to mudrushes. Unconsolidated, saturated material exhibited a very low deviatoric maximum strength followed by static liquefaction, resulting in residual strength values close to zero. In terms of mining, the geotechnical tests were related to the draw rate and the saturation conditions: a high rate of draw could cause unconsolidated conditions as the strength of the mud decreases close to zero, while a low extraction rate could be related to consolidated conditions where the ore is allowed to release the pore pressure. If the ore is under unsaturated conditions it presents a lower risk as it will develop uniaxial strength.
Keywords: mudrush, block caving, geotechnical characterization.
Introduction
Mining is the process of extracting minerals from the earth, and different mining methods have been developed over time (Lacy and Lacy, 1992). Block/panel caving is an underground mining method based on the action of gravity for ore breakage and transport. It has the lowest cost and the highest production rates of underground methods (Douglas, 1992; Heslop, 2000). In addition, block/panel caving is the safest underground mining method, although it has associated operational risks such as rockbursts, air blasts, and mudrushes (Heslop, 2000). A mudrush is a sudden inflow of mud from drawpoints or other underground openings inside the mine (Butcher et al., 2005). Mudrushes can cause damage to equipment, ore dilution, production delays, injuries, and fatalities.
In block/panel caving mines, an undercut level is developed in the base of the orebody and a production level is constructed some distance below. An arrangement of openings called drawbells is excavated between the undercut level and the production level, and drawpoints are located on the bases of the drawbells. A horizontal ore layer is extracted from the undercut level in order to collapse the orebody above, and broken ore then falls into the drawbells and is managed on the production level. As broken ore is removed from drawpoints, the ore above continues to break and cave (Douglas, 1992). This method is inherently susceptible to mudrushes, owing to the fact that it has all the elements that are necessary: mud-forming material, disturbances, discharge points, and water (Butcher et al., 2000). Mud is formed by fine granular particles and water (Becerra, 2011; Hubert et al., 2000; Jakubec et al., 2012; Lacy and Lacy, 1992; Samosir et al., 2008). Water comes from the surface or from underground sources, and fine granular particles come from surface or from abrasion of ore during caving. The discharge points are the drawpoints on the production level.
Mudrushes are triggered by disturbances, which may be dynamic, as in blasting, equipment movements, or earthquakes (Call and Nicholas, 1998; Jakubec et al., 2012), or static as in stable arch collapse above drawbells (Butcher et al., 2000, 2005; Jakubec et al, 2012) and ore drawing (Butcher et al., 2000, 2005; Call and Nicholas, 1998; Jakubec et al., 2012). Previous investigators have postulated two mechanisms for the occurrence of mudrushes. In one mechanism, the ore loses shear strength: an increase in the water content of mud can change its properties (Butcher et al., 2005; Jakubec et al., 2012), decreasing its shear strength. In the other mechanism, stress induces a high water pressure in the mud pores (Call and Nicholas, 1998; Hubert et al., 2000), resulting in a sudden decrease in the shear strength -a phenomenon called static liquefaction (Yamamuro and Lade, 1998) or flow failure (Yoshimine and Ishihara, 1998). The proposed mechanisms have not been proven quantitatively to date.
Call and Nicholas (1998) geotechnically characterized the ore from six samples involved in mudrushes in IOZ mine, Freeport, Indonesia. They found that ore involved in mudrushes had more than 20% of particles less than 2 mm, and could be classified as 'well graded fine gravel with coarse to fine sand', 'poorly graded to silty fine gravel', and 'poorly graded fine gravel to silty fine gravel' depending on each sample. They also compared the samples with other sandy gravel materials and concluded that, at greater than 80% saturation, the material is prone to liquefy due to the excess pore pressure. They performed five unsaturated, consolidated, undrained triaxial tests on a composite from two of the samples, using initial conditions of confining stresses from 50 kPa to 200 kPa, loose compaction, and water contents from 1% to 9%. Results showed that all samples reached 100% saturation after consolidation, and three of them developed liquefaction: instability with an increase in pore pressure (Yamamuro and Lade, 1998). Nevertheless, they did not establish the specific conditions in which liquefaction occurs, because of the small number of triaxial tests and the unspecific initial set of conditions.
In the present paper we study geotechnical properties of mud-type ore from the Diablo Regimiento Sector (DR) of Codelco's El Teniente Mine, Chile. The aim is to obtain geotechnical parameters to describe the ore, characterize the strength and behaviour under different conditions, and use the results to evaluate and quantify the mechanisms for occurrence of mudrushes. We first describe concepts for understanding the results and interpreting the experimentation. This is followed by a description of the material samples and experimental methods. Finally, we discuss the results and the proposed mechanisms for mudrushes based on experimental results.
Framework
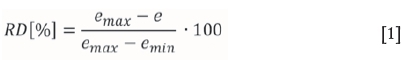
Mud ore is known to be a moist, fine-sized granular material; its void ratio and porosity are uncertain because of the density changes caused by the ore flowing through the column and drawbells until it reaches the drawpoints, where the material is extracted, (Kvapil, 1992). Water content is also a variable of mud ore in mine conditions, depending on the permeability of the ore and water sources (Call and Nicholas, 1998). In this section we discuss the physical relationships between water, void, and solid phases in a granular assemblage in order to describe compaction and water content in mud ores. Also, we present concepts to understand the behaviour of granular materials in relation to stress and pore pressure. Minimum and maximum packing densities are properties of granular materials that can be measured in a laboratory, but their values depend on the procedure used (Lambe and Whitman, 1969). Equation [1] represents the relative density, an index used to compare packing of different materials depending on their individual packing properties (Lambe and Whitman, 1969). emax and eminare maximum and minimum possible void ratios for a granular material, respectively, and e is the current void ratio, where void ratio is the ratio of void volume to solid volume (Lambe and Whitman, 1969). At zero relative density the material is in its loosest possible packing state, and a relative density of 100% indicates that the material is in the densest possible state.
Water in a granular material is retained in the voids between particles, and thus the quantity of water that a granular material can hold depends on the available voids. Saturation (Equation [2]) is a concept used to quantify water in a granular material in relation to voids available (Lambe and Whitman, 1969):
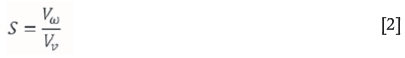
where Υω is the volume of water in the granular material and VVis the volume of voids between solid particles.
Equation [3] shows the relationship between void ratio and saturation, and water content ω and specific gravity Gs, where specific gravity is the unit weight of solid divided by the unit weight of an equal volume of water, and the water content is the ratio of water weight to solid weight (Lambe and Whitman, 1969). This equation is used to describe the relationship between volume and mass indexes.

The pore pressure concept mentioned in the previous section in relation to mudrush mechanisms refers to the pressure of water inside pores or voids of a saturated granular material such as soil or other aggregate. Pore pressure depends on the water level above the point where the pore pressure is evaluated, and on the stresses acting on the saturated granular material. Pore pressure is related to the concept of effective stress, as presented in Equation [4], where effective stress σis calculated by subtracting the pore pressure (u) from the total stress (σ). Additionally, it represents stresses supported only by the solid structure of the granular material.

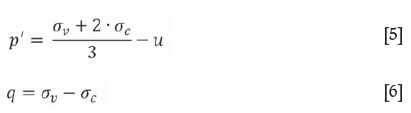
For granular materials, there are three types of triaxial tests depending on the conditions of drainage and initial consolidation. These are unconsolidated-undrained (UU), consolidated-undrained (CU), and consolidated-drained (CD) tests (Das, 2002). The drainage condition depends on the rate of shear stress and the permeability conditions in the field. The drained test is used for low-rate loads or high-permeability aggregates in which pore pressure can dissipate when the sample is under stress. The undrained test is for high-rate loads or low permeability, in which pore pressure cannot be dissipated or changed during the application of stress. Consolidation is the process in which water content decreases, with consequent reduction in volume due to the confining stress acting on a saturated granular material (Lambe and Whitman, 1969). Consolidation is complete when all pore pressure has been dissipated from the material, and consequently the water content and volume stay constant. In order to understand the mechanical behaviour, stresses developed in triaxial tests are interpreted using deviatoric (q) and mean stress (p), both depending on the principal stresses. Mean stress is the isotropic (spherical) component of stress, and deviatoric stress is the component that causes the shearing (Schofield and Wroth, 1968). Triaxial tests have well-defined principal stresses, with vertical compression (σ„) as the major principal stress and confining stress (¾) as the minor and intermediate principal stresses (Lambe and Whitman, 1969). Mean stress (p) can also be expressed as mean effective stress (p'). Equations [5] and [6] show the mean effective stress and the deviatoric stress for triaxial test conditions (Schofield and Wroth, 1968), respectively.
Granular materials such as silty sands can exhibit different deformation behaviours, depending on the initial density and the confining stress. Dilative and contractive behaviour indicate increasing or decreasing rates of volume change, respectively. In undrained conditions, dilative and contractive behaviour can be identified by the decrement or increment of pore pressure respectively. Consequently, according to Equation [4], dilative and contractive behaviour are indicated by the increment or decrement in mean effective stress respectively. Loose sand tends to contract until the mean effective stress reaches a minimum and the behaviour changes from contractive to dilative at a point termed the phase transformation (Yoshimine and Ishihara, 1998). Flow failure or static liquefaction occurs when a confined loose granular material with contractive behaviour exhibits instability or loss of shear strength before the phase transformation (Yamamuro and Lade, 1998).
Methods and material
Samples
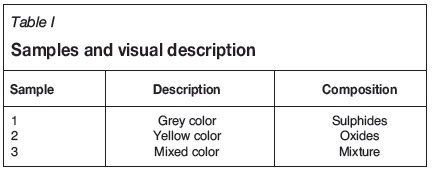
Samples for this study were obtained from Diablo Regimiento (DR) Sector at El Teniente mine, which is the largest underground copper mine in the world. It is located 50 km east of Rancagua city in Chile, between 2100 and 2800 m above sea level. The mining method is mechanized block/panel caving using load haul dump (LHD) machines. Mud has appeared in several drawpoints in El Teniente and there have been seven mudrush events since 1989 (Becerra, 2011). In DR, three kinds of mud ore have been identified, according to visual characterization by mine personnel: grey mud associated with sulphide ores, yellow mud associated with oxide ores, and a mixture of yellow and grey mud. Three samples of mud ore were collected from different drawpoints classified as constituting a critical risk (Becerra, 2011). Each sample is representative of one type of mud ore according to mine personnel, as shown in Table I.
Sampling was carried out by mine personnel in charge of water content. Samples were extracted using a hand shovel to take increments of mud on an imaginary horizontal line across the drawpoint 1.5 m from the floor. This method was developed by El Teniente in order to take samples that are representative of ore in drawpoints. Samples were transported in sealed plastic bags to the laboratory, where they were dried and prepared for testing.
Test work
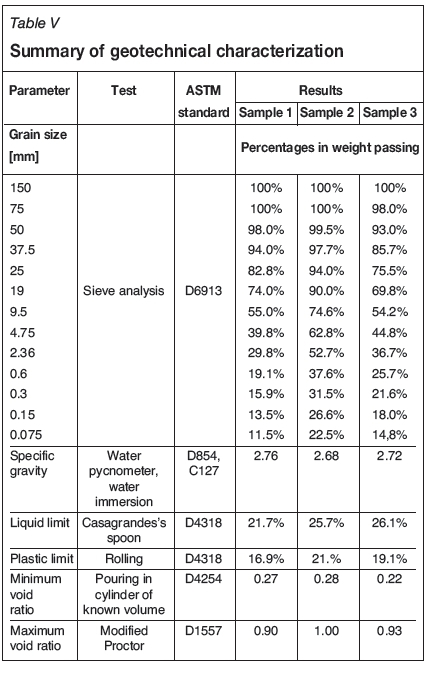
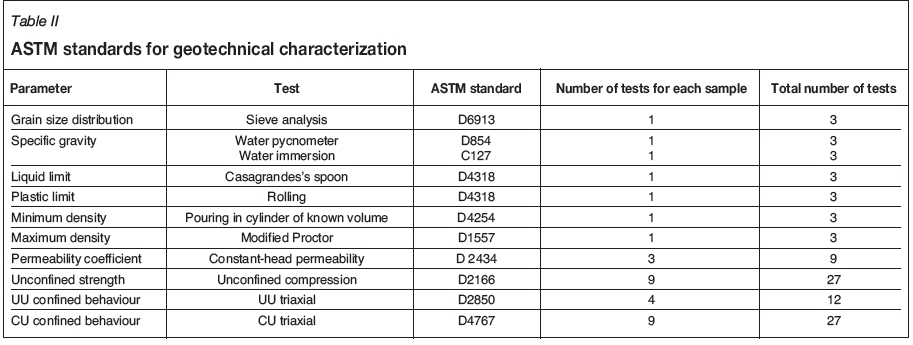
Samples were tested in the Solids Laboratory facilities of the Civil Engineering Department of Universidad de Chile. Tests were carried out to obtain a geotechnical characterization and determine the geomechanical behaviour of mud-type ore. Given the known characteristics of mud ore, ASTM standard tests for soils were selected for geotechnical characterization, one for each sample. Table II lists a summary of the tests.
The tests listed in Table II have different objectives: grain size distribution, specific gravity, liquid and plastic limits; the maximum and minimum densities are determined to characterize and classify mud-type ore, and to obtain index geotechnical parameters for use in the geomechanical tests. Unconfined compression tests were carried out to determine unconfined and partially saturated strengths of mud ore, and how the strength changes with different degrees of saturation and compaction. Finally, triaxial tests were performed in order to obtain geomechanical behaviour of mud-type ore in saturated confined conditions, and determine how it changes with different initial compaction grade, initial consolidation, and confining stress.
Grain size distributions were obtained using sieve analysis on 32 kg subsamples separated by quartering. Material was washed with water to separate fines using a 200 mesh (75 μΐη) sieve as filter. Finally, material was placed on the uppermost sieve and the sieve assembly was vibrated. The fines from cleaning and grains retained on sieves were weighed in order to calculate the grain size distribution of the samples.
Specific gravity testing was carried out using two different methods, depending on the grain size. For particle sizes greater than 4.75 mm we used the water pycnometer method, in which a volume of water is weighed, and then the same volume is filled with a known mass of solid material submerged in water. The mass difference was used to obtain the soil density, which divided by water density gives the specific gravity of the solid. For particle sizes over 4.75 mm, a dry portion of material was weighed and then submerged and its weight under water measured; the dry weight is divided by the difference between dry and submerged weights to obtain the specific gravity.
Liquid limit testing was performed on the fine fraction of samples (less than 0.425 mm). A wet layer of material is added over a specially designed standard spoon, and a groove is cut in the middle. The spoon is then repeatedly dropped from a standard height until the groove is closed. The aim of this procedure is to obtain the water content of two subsamples that require from 15 to 25 drops, two from 25 to 35 drops, and one close to 25 drops, then plot the number of drops versus water content and construct a straight line between the points. The liquid limit is the intercept of 25 drops and the straight line. The minimum density test method consists of filling a container of known volume and weight with material using a pouring device to place it as loosely as possible, and then weighing the container with the loose material inside to obtain the density. This procedure is repeated at least three times and the lowest density is selected as the minimum density.
Maximum density is carried out using the modified Proctor test, in which a wet portion of material is compacted in layers in a container of known volume. This procedure is repeated with different water contents to obtain the maximum wet density. Finally, the dry density is calculated from maximum wet density and water content to obtain the maximum density. Maximum and minimum void ratios are calculated using minimum and maximum density respectively with specific density for each sample. The plastic limit was determined only for the fine fractions of samples (less than 0.425 mm). This method involves forming an ellipsoidal mass with 1.5 to 2 g of wet material and rolling it with the hand against a ground-glass plate until it has a uniform diameter of 3.2 mm, then breaking it into several pieces and squeezing it together to repeat the procedure. The mass of material slowly dries with each cycle, and when the mass crumbles after reaching a diameter of 3.2 mm it is placed in a container and its water content, which is the plastic limit of the sample, determined.
Three constant-head permeability tests were performed on each sample in order to determine the permeability coefficient at different relative densities. Samples were compacted to RD values of 30%, 60%, and 70%. The test consists of measuring the time (in seconds) in which a volume (in mm) of water passes through a cylindrical permeameter filled with a saturated sample. Water temperature is also measured in order to normalize the water viscosity to 20°C. This procedure is repeated at least three times for each test and the results averaged.
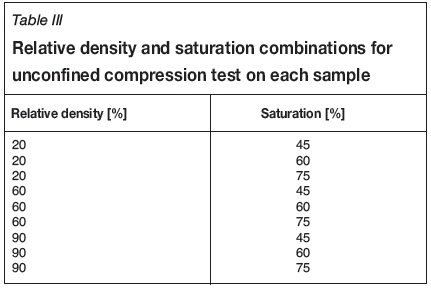
Equations [1], [2], and [3] in combination with index parameters are used to set different conditions of saturation degree and compaction for unconfined and triaxial compression tests. An unconfined compression test involves the axial compression of a cylindrical specimen in a strain-controlled compression device until failure. The test ends when there is a decrease in stress or decrease of more than 20% in axial strain. The maximum stress reached during testing is the unconfined compressive strength. Force and axial strain are measured during testing with a precision of 0.001 kN and 0.001 mm respectively. The initial cross-sectional area of the specimen is calculated as the average of nine diameter measurements with a precision of 0.1 mm in order to calculate the stress.
Nine combinations of relative density and saturation degree, as in Table III, were used to perform unconfined compression tests. Ranges for the relative densities and saturation degrees were selected in order to allow the correct selection of cylindrical specimens for testing in unconfined conditions. Specimens were moulded using the known characteristics of each sample to calculate, using Equations [1] and [3], the pertinent water contents. Finally, the moist sub-sample was compacted in five layers using a metal mould in order to attain the density and saturation set previously.
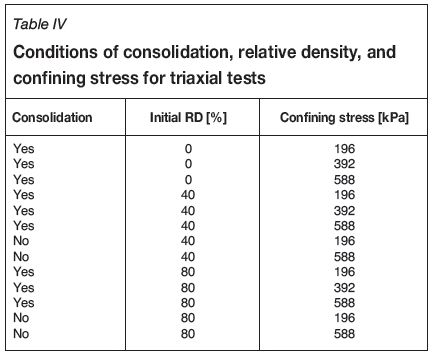
The triaxial test involves the axial compression of a saturated cylindrical specimen with constant isotropic confining stress imparted by the water pressure until 20% axial strain is reached. The specimen is separated from the confining water by a rubber membrane. At the base and top of the specimen, porous discs allow water drainage from the inside of the specimen. Drainage is connected to a valve in order to allow or close water drainage. For a consolidated test there is an initial consolidation stage in which the drainage valve is opened and water outflow is measured with a precision of 1 ml. In the compression test stage, the drainage valve is closed for undrained triaxial conditions, and the pore pressure is measured with precision of 0.1 kPa. Triaxial tests were carried out using three controlled variables: confining stress, initial relative density, and consolidation. Samples were fully saturated for all cases. For consolidated tests, three confining stresses and three initial relative densities were selected. For unconsolidated tests, pore pressure equals confining stress and the initial effective stress is zero for any confining stress. Consequently, the behaviour should not change for different confining stresses, and only two confining stresses are tested to verify this. Samples compacted to 40% relative density showed a very low strength (near zero), therefore tests at zero relative density were not performed and there are only four unconsolidated tests for each sample. Table IV summarizes the conditions for the 13 triaxial tests performed on each sample.
Results and discussion
Geotechnical characterization
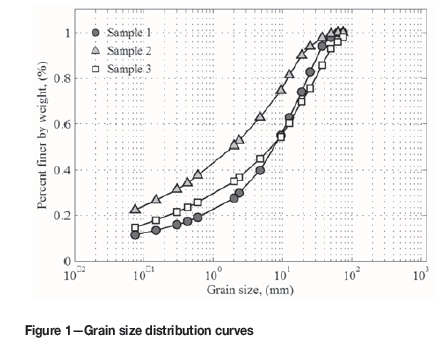
Geotechnical characterization is summarized using index values from the test results. Table V shows the indexes of ore from the three samples for each test. Grain size distributions are presented in terms of percentage weight passing each size in Figure 1. It can be seen that all samples have similar distributions: well-graded, with coarse sizes mostly under 50 mm and fines with sizes less than 75 μπι comprising over 10% by weight of the samples. Sample 2 contains more fines (less than 75 μΓΓΐ) than others - over 20% by weight - and sample 1 has the lowest percentage of fines. Sample 3 has the largest maximum particle size, between 150 mm and 75 mm, compared with the other samples whose maximum particle size is between 75 mm and 50 mm. Specific gravity results from Table V show small differences for the three samples, with sample 2 having the lowest specific gravity. We calculated the specific gravity as the average of the results obtained using the coarse and fine methods, taking note of the minimal differences between measured values of coarse and fine specific gravity (less than 2%) for all samples. Therefore specific gravity does not depend on grain size for the analysed material. Plastic and liquid limits are similar for all samples, which are all classified in the same group according to ASTM (D2487-00) standard: low-plasticity silt and clay. However, the liquid limits of samples 2 and 3 are, respectively 4% and 4.4% higher than the liquid limits of sample 1, and the plastic limits of samples 2 and 3 are 4.1% and 2.2% higher than the plastic limit of sample 1. These differences mean that, with the same water content, fines from sample 1 are more prone to flow than the other samples. Minimum and maximum void ratios are very similar for the three samples, with values between silty sand (from emax = 0.9 to emin = 0.3) and fine to coarse sand (from emax 0.95-0.2) according to typical values (Douglas, 1992). Sample 2 has the highest minimum and maximum void ratios: the maximum void ratio of sample 2 is 12%, 8% higher than samples 1 and 3. Moreover, the minimum void ratio of sample 2 is 6%, 25% higher than samples 1 and 3. This indicates that sample 2 is prone to looser density states, because its both its maximum and minimum density are lower than the values for the other samples. It must be noted that the above indexes could not be related to the strength of the granular mass.
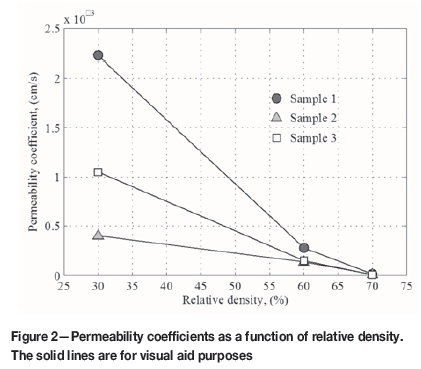
Permeability results are presented in Figure 2. The permeability coefficient is inversely related to relative density (RD). Sample 1 has the lowest values for all RD conditions, which means water can flow faster through sample 1 at the same compaction condition.
Geomechanical behaviour
Unconfined compression tests were carried out at various relative densities and saturation levels. The results show small changes in strength with saturation varying in the range 45% to 75%, and larger strength changes with relative density variations. Averaged unconfined strength values for each sample and RD, at different degrees of saturation, are plotted in Figure 3. For all samples, strength increases with compaction, and the exponential model of Equation [7] is fitted to each sample:

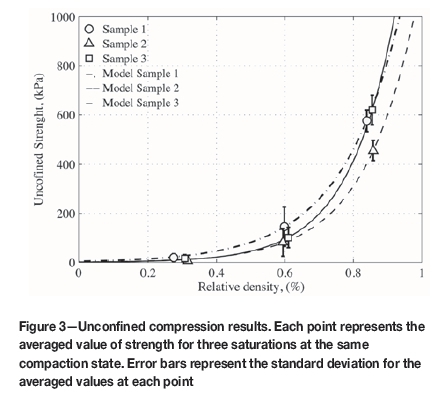
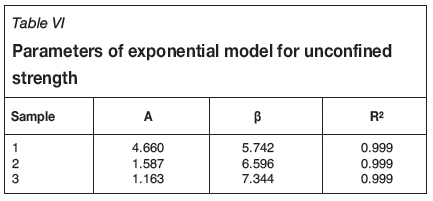
where Su is unconfined strength, a and β are model constants, and RD is the relative density. Sample 2 has less strength than the others at high relative densities. Using the exponential models we can see that samples 1 and 3 have strengths 30% and 49% higher than sample 2 at 95% relative density. Table VI contains the detail of the parameters fitted to unconfined strength values for each sample using Equation [7].
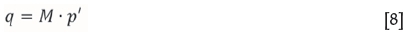
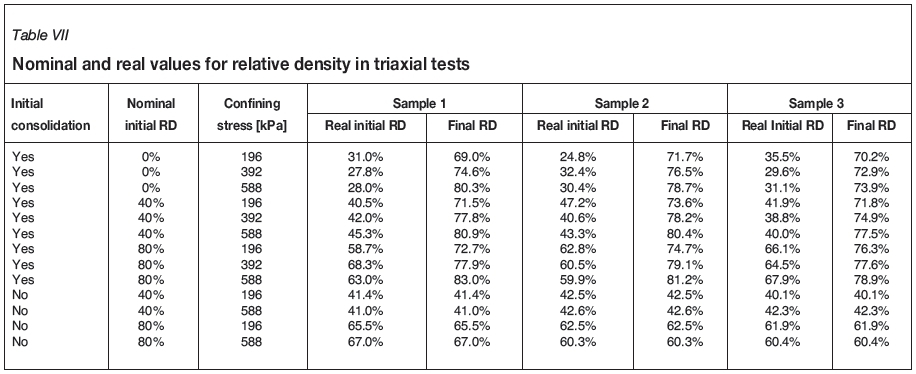
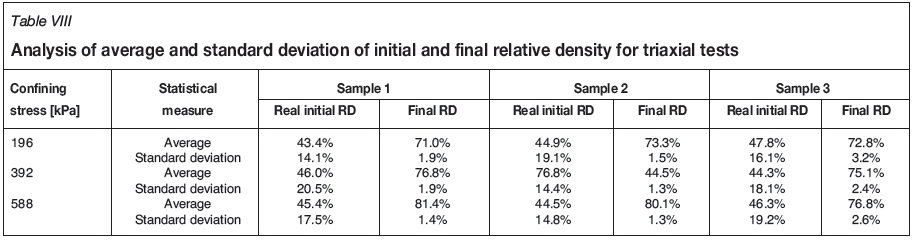
For triaxial testing the compaction conditions in Table IV were set. The real initial relative densities for tests conducted after saturation compaction changes are listed in Table VII, which also shows the final relative densities after consolidation The triaxial test results show the same behaviour for all samples. In order to explain material behaviour, only results from sample 2 are presented. In Figure 4a we observe a rapid initial increase in deviatoric stress for all consolidated tests. The deviatoric stress then stabilizes before passing 5% axial strain, followed by a low rate of increase. In some cases deviatoric stress reaches a maximum value and then slowly decreases to less than 8% of the maximum. Figure 4b shows deviatoric stress versus mean effective stress, and a contractive behaviour can be seen with an initial fast increase in deviatoric stress, which stabilizes when mean effective stress reaches the minimum at phase transformation for each test. After phase transformation, a contractive behaviour is exhibited with small increases in deviatoric stress. According to Figure 4a and 4b, the consolidated saturated triaxial strength at phase transformation and maximum strength depends on mean effective stress. It is also possible to see a relationship between relative density and strength. Final relative density after consolidation depends more on confining stress than initial relative density, as seen in Table IX, where we observe that the standard deviation values of initial relative density are 5 to 12 times greater than those of final relative density for the same confining stress. Consequently, the strength at phase transformation and maximum strength depend only on effective confining stress for consolidated undrained conditions. We can use Equation [8] to fit the strength at phase transformation and maximum strength separately for each sample in a linear relationhip that depends only on mean effective stress.
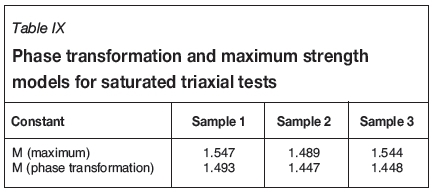
Fitted parameters of the model for all samples are presented in Table IX. They indicate that all samples have a similar failure curve for strength at phase transformation and maximum strength. The M parameter is obtained by the best fit of Equation [8] to the results. M is 4% higher in samples 1 and 3 than in sample 2 for maximum strength. On the other hand, for residual strength, the Mfactor is 3% higher in sample 1 than in samples 2 and 3. Unconsolidated tests for sample 2 are plotted in Figure 4c and Figure 4d. The deviatoric stress of unconsolidated mud increases rapidly to a maximum value and then decreases at a constant rate until it reaches almost zero strength, with maximum values around 30 kPa and residual values between 0.1 kPa and 10 kPa for all samples. These results show a loss of strength after phase transformation, consequently monotonic liquefaction or flow failure occurs due to the high pore pressures developed. Nevertheless, maximum and residual deviatoric strengths obtained in unconsolidated tests are minimal compared with those of consolidated tests, and do not depend on initial compaction or confining stress. Samples with dense compaction show a greater variation in pore pressure during testing, but mean effective stress is very low for all tests, due to the similar pore pressures and confining stress values that were applied in the experiments. Given these points, we conclude that mud-type ore in a saturated condition is more prone to flow under low mean effective stress than under high effective stress. A low mean effective stress condition is possible in the case of low confining stress and also when pore pressure is high according to Equation [4]. In unconsol-idated triaxial and unconfined compression conditions, the effective confining stress is zero (or near zero for triaxial conditions). Nevertheless, the strength for unconsolidated material under triaxial conditions is comparable with only the lowest values for unconfined tests, even when packing for unconsolidated tests is medium to high. Values of unconsol-idated strength are closer to those for loose unconfined tests, which can be explained by the partial saturation of unconfined tests. When saturation is not full, capillary forces are developed inside the granular structure, giving the ore an apparent cohesion. On the other hand, unconsolidated tests are fully saturated, and consequently there are no capillary forces acting. Also, high pore pressures are developed and flow failure or static liquefaction is present in this condition.
Mudrush mechanisms
In the first sections of this paper we identified different triggers and mechanisms for mudrushes from several authors. Here, considering the experiments conducted so far, we analyse the geomechanical behaviour in order to determine the feasibility of these different mechanisms and triggers. Deviatoric stress has been described as the stress that generates shear in a material, and a material 'flows' or deforms when the shear stresses acting on it exceed the shear strength of the material. Consequently, we assume that the deviatoric strength of the ore is directly related to its capacity to flow. We presented two mechanisms by which mud can lose sufficient shear strength to flow: liquefaction, and increase in water content. Additionally, we established that Diablo Regimiento mud is affected by static liquefaction or flow failure phenomena only in an unconsolidated condition, which means low mean effective stress. Also, we have shown that strength variations with saturation are minimal compared with compaction (RD) changes, and saturation depends not only on water content, but also on void ratio, as can be seen in Equation [3]. At constant saturation, the greater the volume of voids, the greater the water content, hence the results in Figure 3 also show indirectly an exponential increase in strength with a decrease in water content.
The shear strengths of the mud in a saturated condition and in partial saturation depend on effective confining stress and compaction (packing), respectively. Consequently, ore can lose shear strength only if it loses effective confining stress under saturated conditions or becomes looser under unsaturated conditions. Extraction from drawpoints involves loosening of the flowing ore, as demonstrated by the scale models of Kvapil (1992). Therefore the distribution of vertical stresses in zones under draw would reach low vertical stresses or low confined conditions. The greater the mass drawn in a cycle, the less the vertical load to be expected.
This also means that the zones that are not extracted will experience higher vertical loads, which implies compaction (for partial saturation) or consolidation (for full saturation). As mentioned previously, UU and CU conditions for triaxial tests represent extreme cases of consolidation before shearing. We hypothesize that, in the field, a very high rate of draw means no full consolidation of ore, and a low rate of draw gives enough time for full consolidation. As we have seen previously, no consolidation means zero (or very low) effective confining stress. It is important to note that the process of consolidation is always occurring, and a true non-consolidated mud in the field is improbable. We can, however, have cases that are closer to non-consolidated conditions as a result of extraction and the low permeability of the mud. Given these points, high rates of draw can be an important trigger mechanism for mudrush occurrences. To summarize, if ore is saturated and draw is too rapid to allow consolidation, it is then more susceptible to flow than a consolidated ore. On the other hand, if ore is not saturated, it also loses strength with drawing due to the packing becoming looser. Nevertheless, saturated strengths are lower than partial saturation strength, and ore in a saturated condition is always more prone to flow than in an unsaturated condition. In saturated conditions, mean effective stress can also decrease due to increasing pore pressure; this is possible if the water level is increased inside or over the drawbell owing to inhibited drainage of the water from the granular mass. A very compacted mud in the base of drawbells is a very low-permeability medium, which favours the accumulation of water. It is important to realize that mud ore can always flow if it is exposed to a disturbance that exceeds its shear strength.
Conclusions
Geotechnical parameters have been obtained for three samples of mud-type ore, comprising sand and gravel with silt and clay, from Diablo Regimiento Sector, El Teniente. There are differences between samples in the finest size fraction (less than 1 mm). The oxide sample is finer than the other two samples, and its liquid and plastic Atterberg limits are higher, which means that it is less susceptible to changing its state from solid to plastic and from plastic to liquid with increasing water content. This means that, given the differences in the samples, water content should not be considered as a flow parameter directly, because its influence can change depending on the characteristics of each kind of mud. Unconfined compression tests show no important variation in strength with an intermediate variation of saturation degree (from 45% to 75%), but a very important increase in strength related to an increase in packing density is developed for all samples, which was modelled using an exponential function for each sample. Triaxial tests showed a clear correlation between deviatoric strength and effective confining stress. Tests on unconsolidated material showed almost no deviatoric strength compared with the consolidated condition, and material in this condition is the only one prone to suffer static liquefaction or flow failure. For a mudrush it is necessary for the ore strength to be exceeded under a given stress state. At a high draw rate from the drawpoint, consolidation is not full and stresses are also low. Therefore ore strength is lower than in the case of fully consolidated ore. It is thus easier for a mudrush to occur with a high drawing rate. Water accumulation inside pores of ore within and over drawbells can increase pore pressure in the ore, lowering the effective confining stress and consequently making it easier for its strength to be exceeded and a mudrush to develop with a high level of water over the drawbell. Research on the mudrush phenomenon is in an initial stage and will require, from a geomechanical point of view, a thorough understanding of stresses acting in granular media during flow.
Acknowledgements
This work was supported by Innova Corfo with collaboration of Codelco Chile, El Teniente. The authors also acknowledge the support of the Department of Mining Engineering and the Advanced Mining Technology Center of the University of Chile.
References
Becerra, C. 2011. Controlling drawpoints prone to pumping. Proceedings of Geomin 2011, Session 7: Mine Production Geology / Geo-metallurgy. [ Links ]
Butcher, R., Joughin, W., and Stacey, T.R. 2000. Methods of combating mudrushes in diamond and base metal mines. SIMRAC OTH601 Project. Safety in Mines Research Advisory Committee, Johannesburg [ Links ]
Butcher, R., Stacey, T., and Joughin, W. 2005. Mud rushes and methods of combating them. Journal of the South African Institute of Mining and Metallurgy, vol. 105. pp. 807-824. [ Links ]
Call & Nicholas, Inc., Freeport McMoRan Copper and Gold, Co., and Hydrologic Consultants, Inc. 1998. IOZ wet muck study. [ Links ]
Das, B. 2002, Soil Mechanics Laboratory Manual (6th edn). Oxford University Press. Chapter 18. [ Links ]
Douglas, J. 1992. Block caving. SME Mining Engineering Handbook (2nd edn). Society for Mining, Metallurgy and Exploration, Littleton, CO. Chapter 20.3. [ Links ]
Heslop, T. 2000. Block caving - controllable risks and fatal flaws. Proceedings of Massmin 2000, Brisbane, Australia, 29 October-2 November. Australasian Institute of Mining and Metallurgy, Melbourne. [ Links ]
Hubert, G., Dirdjosuwondo, S., Plaisance, R., and Thomas, L. 2000. Tele- operation at Freeport to reduce wet muck hazards. Proceedings of Massmin 2000, Brisbane, Australia, 29 October-2 November. Australasian Institute of Mining and Metallurgy, Melbourne. [ Links ]
Jakubec, J., Clayton, R., and Guest, A. 2012. Mud rush risk evaluation. Proceedings of Massmin 2012, Sudbury, Ontario, 10-14 June 2012. Canadian Institute of Mining, Metallurgy and Petroleum, Montreal. [ Links ]
Kvapil, R. 1992. Sublevel caving. SME Mining Engineering Handbook (2nd edn). Society for Mining, Metallurgy and Exploration, Littleton, CO. Chapter 20.2. [ Links ]
Lacy, W. and Lacy, J. 1992. History of mining. SME Mining Engineering Handbook (2nd edn), Society for Mining, Metallurgy and Exploration, Littleton, CO. Chapter 1.1. [ Links ]
Lambe, W. and Whitman, R. 1969. Soil Mechanics. Wiley, New York. Chapters 3, 9, and 27. [ Links ]
Samosir, E., Basuni, J., Widijanto, E., and Syaifullah, T. 2008. the management of wet muck at PT Freeport Indonesia's Deep Ore Zone Mine. Proceedings of the 5th International Conference and Exhibition on Mass Mining, Lulea Sweden, 9-11 June 2008. Schunnesson, H. and Nordlund, E. (eds). Lulea University of Technology [ Links ]
Schofield, A. and Wroth, P. 1968. Critical State Soil Mechanics. McGraw-Hill. [ Links ]
Yamamuro, J. and Lade, P. 1998. Steady-state concepts and static liquefaction of silty sands. Journal of Geotechnical and Geo-environmental Engineering, vol. 124, no. 9. DOI: 10.1061/(ASCE)1090- 0241(1998)124:9(868) [ Links ]
Yoshimine, M. and Ishihara, K. 1998. Flow potential of sand during liquefaction. Soils and Foundations, vol. 38, no. 3. pp. 189-198. DOI: 10.3208/sandf.38.3_189 ♦ [ Links ]
Paper received Nov. 2015
Revised paper received Jul. 2016

