


Services on Demand
Article
 English (pdf)
 Article in xml format
 Article references
Indicators

Related links
-
 Cited by Google
 -
 Similars in Google
Share

 Permalink
Journal of the Southern African Institute of Mining and Metallurgy
On-line version ISSN 2411-9717
Print version ISSN 2225-6253
J. S. Afr. Inst. Min. Metall. vol.117 n.2 Johannesburg Feb. 2017
http://dx.doi.org/10.17159/2411-9717/2017/v117n2a11
WITS SPECIAL EDITION - VOLUME II
Characterizing a mining production system for decision-making purposes in a platinum mine
T.C. SebutsoeI; C. MusingwiniII
IImpala Platinum Mines, Rustenburg Operations, Rustenburg, South Africa
IISchool of Mining Engineering, University of the Witwatersrand, South Africa
SYNOPSIS
The primary objective of any mining business unit is to make profit by extracting, processing, and selling minerals from a particular mineral deposit. It is important to optimize extraction of the mineral resource given time, capital, and space constraints. Mineral extraction is often associated with uncertainty due to variable technical and human factors. Technical factors such as grade distribution, ground conditions, and equipment reliability influence the performance of a mining production system (MPS). The performance of the MPS is also impacted by human factors such as employee skills, health, and attendance. Uncertainty associated with technical and human factors often leads to actual output differing from what was planned. Therefore an in-depth analysis of the significant causes of deviations from the planned outcomes is relevant.
In this paper we investigate the empirical relationships between inputs and outputs in a MPS in order to assist management in directing efforts at key production drivers. Once a MPS has been empirically characterized, more effort and resources can be focused on the key decision-making variables (DMVs) in order to meet the planned outcomes.
For a typical underground, tabular, narrow-reef conventional drill-and-blast platinum mine the face advance, face length mined, number of teams, team efficiencies, and team size have a statistically significant relationship with the centares (m2) produced, which is a key performance indicator (KPI). The production function derived in this study can be used to align the physical, technical, and human factors together to predict the optimal output level. The most significant production lever of the MPS is the face advance.
Keywords: mining production system (MPS), productivity, key production drivers, decision-making variables (DMVs), optimization.
Introduction
A mining production system (MPS) is a result of an iterative process of design, planning, and optimization of mining input variables and decision-making variables (DMVs). The MPS exists within the mineral extraction link of the complete mining value chain. It represents the stage where mining companies have the opportunity, through production, to start generating returns on the investments undertaken. Returns on shareholders' investments can be realized at this stage.
More often than not, the actual performance of the MPS is somewhat different to that in the optimized MPS plan. This behaviour or characteristic is observed in an ensemble of output results of the key performance indicators (KPIs). These results are sometimes above target, on target, or below target due to uncertainty associated with technical and human factors, resulting in actual output being different to that planned. The first two circumstances are perhaps the most desired. However, in most cases the MPS, especially in the case of mature mines, tends to deliver below target. The variability of the KPIs of interest is influenced by internal variables or DMVs. The variable units or DMVs can be either controllable or uncontrollable. It is therefore important to understand and know to what degree the controllable variables can be controlled to achieve the desired output and to minimize the effects of the uncontrollable variables. This paper is part of an MSc research study at the University of the Witwatersrand, based on a platinum mine MPS case study where actual data was available for analysis.
Importance of empirical characterization of a mining production system
Commentary on the mining industry's productivity has been topical in the last decade due to the declining productivity trends across several commodities. Research, analysis, and publications from institutions like the Chamber of Mines, Statistics South Africa, Ernest and Young (EY), McKinsey, DuPont, PricewaterhouseCoopers (PwC), and many independent market analysts have highlighted this trend. All the reports highlight declining labour productivity versus increasing wage bills, rising input costs due to inflation, decreasing revenues, falling metal prices, declining throughput, and instability of the labour markets.
Several solutions are cited to resolve the declining productivity problem. The following are some of the suggested solutions that are relevant to the management of a MPS:
► Reduce costs
► Increase face time/utilization
► Improve mine safety
► Optimize mine development
► Increase and optimize production
► Comply with mining plans and performance targets
► Increase control on the mining operation.
The solutions listed above are in principle relevant and make sense. However, the challenge is whether they are specific enough, measurable, achievable, realistic, and time-bound (SMART). The practicality of implementing them all at once is the biggest challenge.
An empirically characterized MPS will quantitatively define a complete relationship between the KPIs and the DMVs. With those relationships in place, the inherent nature of the system can be optimized by focusing on the significant DMVs, as these result in the most deviations from planned output. An empirically characterized system highlights the contribution or impact of individual DMVs related to the KPI. This will help in re-directing the optimization efforts to the DMVs with the highest impact, as opposed to generic efforts to try to resolve the system as a whole.
The mining value chain and the MPS
The MPS represents a specific set of activities within the mineral extraction link of the mining value chain (Figure 1). The links of the mining value chain represent distinct processes that are dependent on each other, whether upstream or downstream. Each link contains processes that must be complete for that unit to function and service other units upstream or downstream.
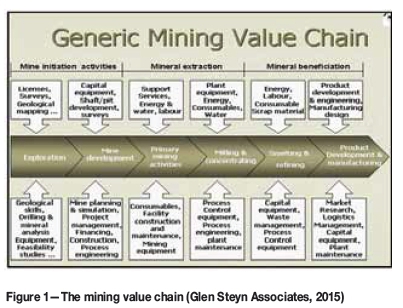
The mineral extraction link is perhaps the most important link in the value chain. From this link the mine obtains the volumes of total throughput (Figure 1). Cambitsis (2013, p. 769) commented that 'While cost management and improvement are crucial to running an effective and profitable organisation, the greatest gains can generally be obtained by increasing production volumes or throughput'. According to Song, Rinne, and van Wageningen (2013), mining has four basic stages: namely, exploration, development, production, and closure. Of these four, they noted that production or exploitation of the ore is the only obvious stage in which stakeholders can recover investments and take profits. It therefore follows that improvement in production volume has a significantly higher impact on the bottom line and is the lever with the most impact on profits. Cambitsis (2013) compared the impact on profit of a 10% decrease in costs and 10% increase in throughput. The study found that for the same percentage change, the response of profit to the change in throughput was far higher. If the mineral extraction link malfunctions, it chokes the links downstream of it, resulting in an underperforming value chain. It is therefore important that this link must be well designed, planned, optimized, and managed properly.
A mining production system can be schematically represented by the model in Figure 2.
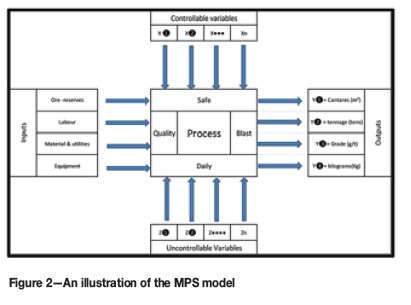
The MPS consists of initial conditions that are technical and human in nature. These conditions are required as the backbone of the system (inputs). They form the internal capacity or the production engine of the MPS.
Ore reserves must be available and the MPS must have flexibility to respond to changes in the operating environment. The importance of ore reserve availability was highlighted by Mohloki and Musingwini (2010) as the foundation of any mining project or producing mine. Sufficient available ore reserves suggest that the development required to open mineable ground is sufficiently ahead of the stoping operations. A typical rule of thumb suggested is two years (Storrar, 1977). Musingwini, Minnitt, and Woodhall (2007) suggested that 18 months should be the minimum ore availability period. They further indicated that low ore availability reduces flexibility, while higher availability increases flexibility. Flexibility is the ability to swiftly move the mining production operation to different faces when disruptions arise due to issues of grade control or unexpected geological structures. Flexibility is important in enhancing a mine's profitability through accommodating financial, technical, and social changes. Flexibility is also essential for managing economic cycles and dealing with risks inherent in the resource such as potholes, faults, and grade variability in a typical platinum mine (Macfarlane, 2006).
The human capital employed is required to be healthy, fit, trainable, and skilled enough to support the mining business. The equipment must be appropriate, reliable, and easy to use.
Consumable materials and utilities must also be available timeously and in the right quantities. Phillis and Gumede (2011) noted that the management of critical resource inventories is an important productivity lever.
The production parameters are applied to the initial conditions to plan and yield a desired outcome of the system (a safe, quality daily blast). A quality blast achieves the desired face advance to produce a proportionate amount of in situ rock material that is then extracted from the mine at the required grade, resulting in the planned amount of metal being produced. Such a blast is done within the planned dilution, without any under- or overbreaks that affect the stability of the sidewalls, footwalls, and hangingwalls. In addition, such a blast enables subsequent activities to be carried out safely without any constraints. The production parameters are a set of measurable and controllable variables that determine, define, and restrict the operation of the MPS. They are a result of an iterative process of design, planning, and optimization. Conveniently, they can be referred to as the decision-making units (DMUs) and the optimum value or condition of each can be found. Within the production process there are random variables that affect the system's desired outcome. The random variables are in the form of constraints, breakdowns, and nuisance variables that result in variations from planned output. An obvious DMV to manage is a lost blast in a particular production panel as it results in zero advance for that panel, hence zero centares (m2) production. However, a blast does not necessarily result in a good advance, and poor blasting will result in failure to achieve the planned centares. The objective of the MPS is to constantly deliver production at the right quantity, quality, and consistency as planned. This can be achieved by minimizing the risk of falling short by actively managing the controllable key DMVs.
Performance measure of the MPS
The performance of the MPS is measured by the ability to deliver the planned outputs. The achievement of the planned outputs or key performance indicators will determine whether the mining business is profitable or not. Attention must therefore directed to the KPIs and DMVs that determine the MPS volumes or throughput, which are outlined below.
Centares mined (m2)
Centares mined (m2) = face length mined per team (m) x advance per blast (m) x number of blasts x number of teams.
Tonnage mined (t)
Tonnage (t) = centares mined (m2) x stoping width (m) x specific gravity (t/m3).
Grade produced (g/t)
The grade produced from an orebody is a measure of the quantity of contained economic mineral or minerals of interest per ton of mined rock material. The higher the grade the higher the quality of the orebody.
Platinum kilograms produced (kg)
Metal content produced (kg) = [tonnage (t) x grade produced (g/t)] ÷ 1000
For polymetallic orebodies (i.e. deposits producing more than one metal), the metal content produced is dependent on the metal ratios or 'prill splits'. A prill split in platinum mining indicates the relative proportions of the various platinum group elements contained in a ton of ore. The prill split is classified as a 4E prill split if it reports on the elements platinum (Pt), palladium (Pd), rhodium (Rh), and gold (Au).
The above KPIs were empirically modelled in respect to their DMVs. The result is a relationship that can be used to yield a desired output. The main advantages of empirical modelling include the following:
► Indicates which variables (DMVs) are most influential on the response KPI
► Assists in determining where to set the values of the DMVs so that the value of the KPI is near the required value
► Assists in determining where to set the DMVs such that the variability of the KPI is small
► Assists in determining where to set the value of the DMVs so that the effects of the uncontrollable variables are minimized.
The MPS management tools (what to manage first)
The ultimate goal of the MPS is to achieve the production targets by ensuring a safe, quality daily blast. The four main initial conditions of the MPS are ground (available ore reserves), people, materials, and equipment (GPME). These become the most important variables that can make the achievement of the goal possible. Line management has direct control over these factors and therefore has the responsibility of controlling and managing them in a manner that will add value to the mining business. All the variables (DMVs) that determine the KPIs must be managed accordingly in order to achieve the desired KPI targets. Due to the interdependent nature of the relationships, the first obvious DMV to manage is the blast.
Due to the interdependency of the sequential mining activities it is critical that these processes are carried out continuously and consistently. Poor execution of any of the sequential activities results in the plan not being achieved. A very important concept in managing systems that are dependent on sequential execution is the theory of constraints (TOC), which is discussed later in this paper. If the preceding phases are not completed or done on schedule, the desired product (an equipped panel for mining) will not be realized. The preceding steps are therefore said to be constraining the system.
The MPS and lost blasts
It was mentioned in the previous section that for an MPS to produce, the four initial GPME factors must be present. It is not sufficient to have these factors only. There is a single most important event that must occur to initiate the generation of the required centares, and this is a blast. The interdependent nature of the variables indicates that if any of the variables is zero, then no production will be realized. More often than not, the four factors are always available and only require a blast event to occur. A blast can be seen as the impetus that starts a chain of events that will eventually lead to the generation of platinum kilograms to be sold. A lost blast is an undesired event which results in a planned panel failing to generate the planned channel tons at the required grade, thus failing to generate the required metal content on the day. When a lost blast occurs, the labour costs associated with that workplace are incurred without any revenue accruing to the organization. The effect of zero revenue coupled with the cost of labour obviously has a negative effect on the bottom line. In most cases lost blasts occur in the same workplace, which indicates the failure of line supervision and line management to eliminate the cause of the lost blast.
It is an industry norm in narrow-reef, hard-rock tabular mines to plan for an average of 23 shifts in a production month. The full potential capacity of a team is the ability to produce on every single planned shift. However, for practical reasons the business plan (BP) targets are set at an average of 60% of the full potential. This implies that an allowance has already been made for lost-blast effects. It is surprising that lost blasts exceed the allowed occurrence as per the BP.
The labour factor is the most important input in the above relationship. It uses the resources (inputs) (ore reserves, materials, and utilities, and equipment) to generate one single primary output of the MPS objective function (centares mined) by initiating the blast event. The labour in the MPS controls further down the line the tons mined and quality achieved (grade). If any of the four variables prevents the MPS from achieving its objective then it becomes a constraint in the system and must be corrected so that it is no longer a limiting factor.
It is not sufficient to only identify a constraint within the MPS. Further analysis is required to establish why the constraint exists. The root cause of the constraint behaviour must be identified. A root cause is the highest level of a problem, and is defined as a factor that causes noncon-formance and should be permanently eliminated through process improvement (ASQ, n.d.). Root cause analysis (RCA) is a technique used to uncover the causes of a problem. RCA helps to identify not only what and how, but also why something happened. For the purpose of this paper, RCA has was used to analyse constraints as captured by the allowed lost blast reasons booked on a mineral resource management (MRM) system of a platinum mine.
RCA application on lost blast analysis (constraint analysis)
For the purpose of RCA application the four initial conditions were allocated ID codes (1-4) as follows:
► Ground (ore reserves): 1
► People: 2
► Materials and services: 3
► Equipment: 4.
In the following example, RCA is applied to a roofbolter breakdown being the reason for lost blasts at four different working places. A roofbolter is used to install active roofbolt support on the immediate face in the hangingwall as permanent support before a blast. Conventionally, the reason for a lost blast is a breakdown of the bolter (equipment breakdown, ID code 4). However, by appropriately applying RCA, the reason then changes to shortage of spares in the store (shortage of equipment). Further analysis reveals that someone is responsible for making sure that there is enough material at the face to achieve a blast and that there is enough buffer at the stores to ensure an uninterrupted mining process. The final RCA indicates that a person (people) (ID code 2) is the underlying constraint. The failure of a supervisor to provide enough material to achieve a blast has resulted in a lost blast, and hence loss of production for that day.
Figures 3 and 4 show the distribution of lost blast analysis for a mine for a month of production. The lost blasts filtered here are only stoping lost blasts. In total the MPS MRM system has provided for nearly 77 lost blast reasons grouped under the following categories:
► Labour (day shift and night shift)
► Engineering
► Finance
► Rock engineering
► Geology and ventilation.
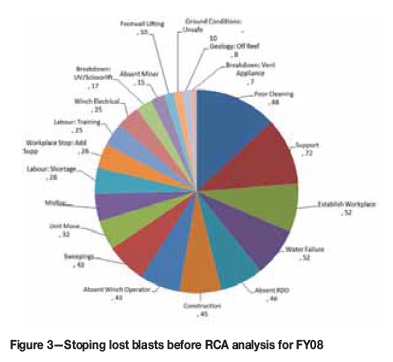
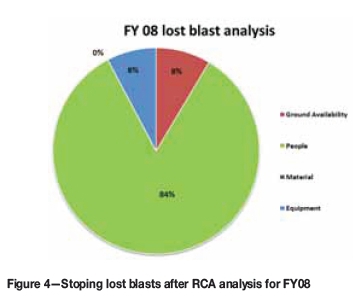
The RCA methodology facilitates the grouping of lost blasts into only four categories (GPME), hence minimizing the ambiguity and therefore directing the controlled action to the actual root cause. Figure 3 depicts the reasons identified for lost blasts before the application of RCA for the financial year 2008 (FY08). When RCA was applied to the same data the causes could be attributed as shown in Figure 4.
Theory of constraints (TOC) application
The MPS activities are sequential and cyclic in nature. A safe, quality daily blast can be seen as a project delivered on any particular day, while the activities that yield a safe quality daily blast can be seen as milestones within the blasting project. The sequential flow of these activities is important to the achievement of the objective. When the upstream activities do not occur, the objective is missed and the system fails or is constrained. The theory of constraints (TOC) is available to understand a system of this nature. TOC is a systems-management philosophy developed by Eliyahu M. Goldratt in the early 1980s (Institute of Management Accountants, 1999). It is a tool that assists managers to achieve the bottom line and capacity improvement quickly at little or no cost (ApicsAu, 2016). The main objective of TOC is to identify a constraint in the system. In the example of a safe, quality daily blast the production value chain would be drill-blast-clean-support. If any of the four events does not occur the cycle cannot be completed or repeated. It then becomes necessary to identify where the problem is. The RCA process will generally lead to identification of the real cause of the problem. When the problem (constraint) is identified, the TOC methodology suggests a further four critical steps to solve the problem. There is a five-step focusing process in TOC that helps to manage the change based on the work of Eliyahu Goldratt (McNesse, 2014). The five steps are:
► Identify the bottleneck
► Exploit the bottleneck
► Subordinate all other elements to the bottleneck
► Elevate the bottleneck to get more from it
► Repeat the process.
Case study
The MPS under study is designed as an underground platinum mine consisting of a vertical shaft system (main shaft and ventilation shaft) to access the orebody. The orebody comprises two distinct reef planes, the Merensky and the UG2 reefs, which dip at about 9 degrees east and strike roughly north-south. The average platinum group metal (PGM) grade is about 3.71 g/t over a 1.1 m average stoping width. The two reef planes are scheduled to be mined concurrently. Underground mining operations follow traditional narrow-reef, tabular mining practices. The orebody is mined on a conventional breast layout grid of 180 m raiselines and 300 m back lengths. This layout gives a total of about 18 stopes with in-stope grid pillars accounted for. Access to the stopes is by means of off-reef haulages leading to secondary development to reef. Based on geological and other conditions, certain portions of ground are left unmined. A stoping team mining about 27 m of available face length has the potential to achieve 621 m2/month. For practical reasons the BP target is 373 m2/month per stope team, which is 60% of the full potential. This equates to about 13 blasts at an assumed face advance of 1 m per blast.
The production data used for the case study spans a period of eight BP years. It is based on direct evidence collected or reported over the eight-year period. Standardized statistical methods were used to enhance the accuracy of the analysis and to validate empirical conclusions about the data. The data was chosen specifically because it spans the highs and the lows of the MPS in question.
Results and discussions
The critical parameters that are assumed to influence or predict the value of the target KPI (centares) have been identified and are briefly described below. The parameters represent monthly figures that were used in the regression analysis for a total of 84 mining months over the eight years as follows:
► Face advance-the distance that the total face length mined has been advanced by mining teams underground
► Face length mined-the mineable face length perpendicular to direction of advance that the teams accessed and worked on
► Achieved blasts-the number of blasts booked (achieved) on the MRM system against all the mining teams
► Teams-the number of mining teams planned to mine
► Team efficiency-the average m2 that a team achieves
► Team size-the number persons at work assigned to a team per panel
► Off-main development-the off-reef main development done to access the orebody
► Re- and predevelopment-the in-stope development that is done to open a mineable face length
► Development to mill-the on-reef secondary development on the mining main grid layout to open blocks of mineable reserves via raises and winzes.
In statistical terms, the suggestion or inference is that the above parameters influence or are good predictors of the dependent variable (centares) and must be tested. The choice of variables is based purely on experience and knowledge of the mining environment. The inference is that the independent variables have some effect or predictive value with respect to the future values of the dependent variable (centares).
The variables that are included in the final regression model (run 2) are those variables that have statistical significance in describing or predicting the dependent variable. A preliminary statistical screening (run 1) was done to identify the variables that were insignificant so that a refined testing (run 2) could be done with only the variables that really had some degree of influence on the dependent variable. In this way, illogical relationships were eliminated while improving on the strength of correlation relationships between significant variables.
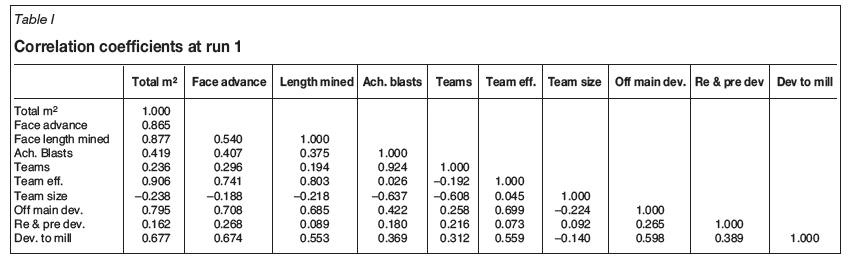
Table I depicts the correlation coefficients between the variables selected for the regression run 1. The correlation coefficient measures the strength of the linear relationship between two variables. The coefficient is measured on a relative scale of -1 to +1. A positive correlation indicates that the variables move in the same direction, while a negative correlation indicates that the variables move in opposite directions. Team size in Table I has a negative correlation to the total m2, while all other variables have a positive correlation. The variables with the a strong correlation (>50%) after run 1 in descending order are team efficiency, face length mined, face advance, off-main development, and development to mill.
Table II indicates the regression statistics results at run 1. The R2 value is 0.998, meaning that 99.8% of the variation within the centares analysis is explained.
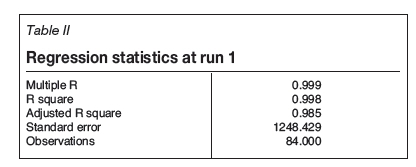
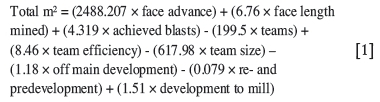
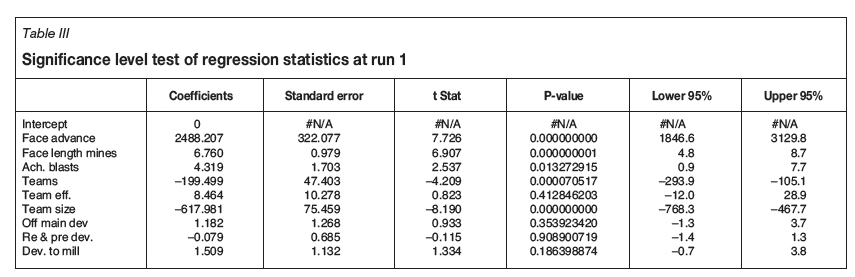
Table III highlights the significance level test of the variables used in the regression analysis. A predetermined confidence level of 95% was selected for the purpose of testing. The implication here is that a P-value higher than 0.05 for any variable indicates that the variable has little influence in terms of predicting the dependent variable. Therefore teamefficiency, off-main development, re- and predevelopment, and development to mill were eliminated and the regression analysis was done as run 2.
The predictive production function derived from Table III is shown by Equation [1] :
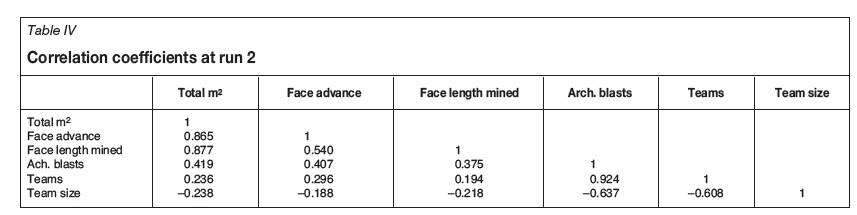
Tables IV, V, and VI present the results of run 2. Table IV depicts the correlation coefficients between the variables selected for the regression run 2. Team size in Table IV has a negative correlation to the total m2, while all other variables have a positive correlation.
Table V indicates the regression statistics results at run 2. The R2 value is 0.999, meaning that 99.9% of the variation within the centares analysis is explained.
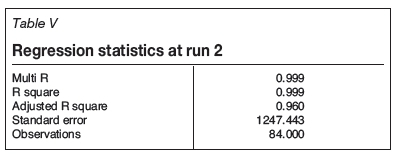
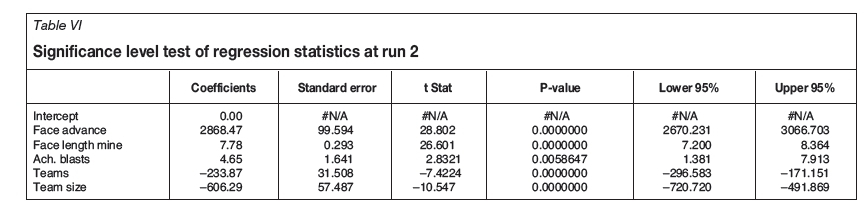
Table VI highlights the significance level test of the variables used in the regression analysis. A predetermined confidence level of 95% was selected for the purpose of testing. The coefficients of the variables are indicated along with the P-value. The P-value indicates that the variables are all significant and relevant in predicting the future values of the dependent variable, total m 2.
The predictive production function from Table VI is shown by Equation [2]:
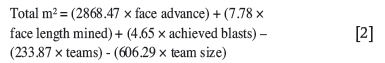
The results indicate that:
► An increase in actual blasts yields only 4.65 m2, showing that the number of blasts reported on the MRM system does not have a significant influence on the centares produced. It is the advance per blast that is a good predictor of centares generated
► A 1 m increase in face advance will result in an increase of 2868 m2
► A 1 m increase in face length mined will result in an increase of 7.78 m2
► An additional team will result in a decrease of 234 m2. This coefficient can be interpreted as the average efficiency of the teams in this mine and can be attributed to diminishing marginal returns due to safety, space, and time constraints. A larger production team does not necessarily produce more centares because of safety, space, and time constraints
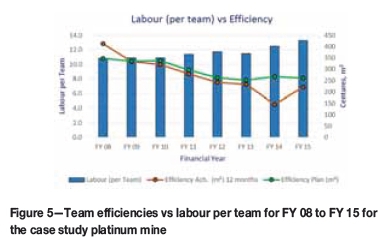
► An increase in one employee per team will result in a decrease of 606 m2, again due to diminishing marginal returns. This fact has been observed lately with the decline in productivity per worker, while the number of employees per team has increased in the panels. Figure 5 depicts a gradual increase in the labour size per team. Despite the labour per team increasing from an average of 10 men per team to 13.3, output or efficiencies have declined. The increase in labour has been due to additional stope activities like netting and bolting, which are necessitated by safety reasons.
In predicting what a mine must produce in any given month during the drafting of the business plan, the production function (Equation [2]) can be used to align the physical, technical, and human factors together to predict the optimal output level. The production function also highlights that the most significant production lever of the MPS is the face advance. However, face advance is achieved only with a blast. Therefore the focus should be on ensuring that lost blasts are minimized. The production function characterizes the mine's monthly production output. It can also be broken down further if a daily output prediction is required.
Conclusion
An approach to the estimation of a mining production function has been presented. It is suggested that the parameters face advance, face length mined, achieved blasts, team efficiency, pre- and redevelopment, off-reef development, development to mill, and team size could be important in the estimation of the production function. The result of the regression analysis shows that face advance, face length mined, number of teams, team efficiencies, and team size have a statistically significant relationship with the centares (m2) produced. Platinum mines should focus on achieving blasts that result in high face advances. The first four parameters have a positive significant relationship with centares. An important productivity consideration is that team size has a negative significant relationship with centares produced, as shown by the production function, because a larger team does not necessarily produce more centares due to safety, space, time, and other constraints.
Acknowledgements
The authors would like to acknowledge Professor R.C.A. Minnitt of the School of Mining Engineering, University of the Witwatersrand for assisting with the statistical validation of the data used.
References
ApicsAu. 2016. Effective management: achieving your goals. https://wiww.apicsau.org.au/events/effective-management-achieving-your-goals [Accessed 14 April 2016]. [ Links ]
ASQ. Not dated. What is Root Cause Analysis (RCA)?. http://asq.org/learn-about-quality/root-cause-analysis/overview/overview.html [Accessed 14 April 2016]. [ Links ]
Cambitsis, A. 2013. A framework to simplify the management of throughput and constraints. Journal of the Southern African Institute of Mining and Metallurgy, vol. 113, no. 10. pp. 769-773. [ Links ]
Glen Steyn Associates. 2015. Core Competencies. http://www.glensteyn.co.za/page/core-competencies [Accessed 14 February 2015]. [ Links ]
Institute of Management Accountants. 1999. Theory of constraints (TOC) Mangement system fundamentals. http://www.imanet.org/docs/default-source/thoughtjeadership/operations-process-management-innovation/theory_of_constraints_(toc_management_systems_fundamentals.pdf?sfvrsn=2 [Accessed 14 April 2016]. [ Links ]
MacFarlane, A. 2006. Establishing a new metric for mineral resource management. Journal of The South African Institute of Mining and Metallurgy, vol. 106, no. 3. pp. 187-198. [ Links ]
McNesse, D.B. 2014. Theory of Constraints. [http://www.spcforexcel.com/publications/Theory_of_Constraints/13B63E123ED3A6769B6575CE93 DA 4F2F/Theory%20of%20Constraints.pdf [Accessed 14 April 2016]. [ Links ]
Mohloki, L. and Musingwini, C. 2010. Sustainable ore reserves generation at variable stoping rates for a uG2 conventional mining layout. Proceedings of the 4th International Platinum Conference, Platinum in transition 'Boom or Bust', Sun City, South Africa, 11-14 October 2010. Southern African Institute of Mining and Metallurgy, Johannesburg. pp. 309-316. [ Links ]
Musingwini, C., Minnitt, R.C.A., and Woodhall, M. 2007. Technical operating flexibility in the analysis of mine layouts and schedules. Journal of the South African Institute of Mining and Metallurgy, vol. 107, no. 2. pp. 129-136. [ Links ]
Phillis, R. and Gumede, H. 2011. Can buffer stores improve productivity. Journal of the Southern African Institute of Mining and Metallurgy,vol. 111, no. 1. pp. 37-43. [ Links ]
Song, Z., Rinne, M., and van Wageningen, A. 2013. A review of real-time optimization in underground mining production. Journal of the Southern African Institute of Mining and Metallurgy, vol. 113, no. 12. pp. 889-897. [ Links ]
Storrar, C. 1977. South African Mine Valuation. 2nd edn. Chamber of Mines of South Africa, Johannesburg. [ Links ]
Paper received Jun. 2016
Revised paper received Feb. 2017

