


Services on Demand
Article
 English (pdf)
 Article in xml format
 Article references
Indicators

Related links
-
 Cited by Google
 -
 Similars in Google
Share

 Permalink
Journal of the Southern African Institute of Mining and Metallurgy
On-line version ISSN 2411-9717
Print version ISSN 2225-6253
J. S. Afr. Inst. Min. Metall. vol.117 n.2 Johannesburg Feb. 2017
http://dx.doi.org/10.17159/2411-9717/2017/v117n2a10
WITS SPECIAL EDITION - VOLUME II
3D geological modelling and resource estimation for a gold deposit in Mali
L. Chanderman; C.E. Dohm; R.C.A. Minnitt
School of Mining Engineering, University of the Witwatersrand, South Africa
SYNOPSIS
Mineral Resource estimation (MRE) and classification are highly dependent on the confidence in the model of the orebody geometry, known as the geological model, within which the estimates are constrained. An understanding of the geology of a deposit is thus fundamental to the Mineral Resource evaluation process. The geological model is a function of the structural and depositional complexity of the geology captured by drilling information, which is limited in the early stages of a project. The information effect has a significant impact in terms of the interpretation of the geology as well as the estimation of grade continuity and the resultant risk associated with the Mineral Resource estimate and classification.
Therefore, as new drilling information becomes available, it is necessary to update and refine the geological model to appropriately constrain the resource estimates. The grade information is also updated, including statistics and the spatial correlation characteristics. This refinement is based on geological interpretations derived from the drillhole information that becomes available throughout the life of the mine; orebody knowledge that comes from working experience of the deposit, as well as familiarity with the software package used for modelling, is also important.
In updating, the potential to identify new resources in previously unknown areas may be realized. The opposite may also occur where previous interpretations of ore continuity are refuted. Both scenarios could result from a better understanding of the geology of the deposit and thus a more realistic MRE, which reduces geological risk. This paper describes how newly drilled advanced grade-control holes for a gold deposit in Mali were used to refine the 3D geological model for the deposit in an attempt to identify the potential for additional oxide ore using conventional geostatistical evaluation techniques.
Keywords: geological modelling, resource estimation, geostatistical evaluation.
Introduction
This paper describes a methodology that can be applied when constructing a geological model of a deposit following a conventional approach. An understanding of the geology of a deposit is fundamental to the Mineral Resource estimation (MRE) process, since estimates are constrained by the geological complexity captured within the geological model, usually based on geology, geometry, structural nature, and grade distribution of the deposit. The risk associated with the geological model and the choice and suitability of estimation techniques have an impact on Mineral Resource confidence, which is reflected by the resource classification category associated with the estimate. Each deposit is unique, therefore the MRE process for each deposit varies. The workflow adopted in this study is based on a gold deposit containing an oxide zone (oxides) and a deeper sulphide zone (sulphides) comprised of unweathered (fresh rock) material, located in southwestern Mali. The mine does not have the plant capability to treat sulphides due to the indentation hardness, and most of the oxide Mineral Reserve on the concession has already been depleted. Exploring the potential for additional oxide resources is thus a natural step to increase the life of the mine.
Background
Any MRE process is iterative, requiring a good understanding of: the underlying geology, good resource evaluation practice, and relevant knowledge of the literature, including company reports and maps, to recognize and learn from past experience. This information provides a reference and known a-priori information about the deposit to guide both the modelling and estimation processes. The first step in the MRE process is data collation and preparation to serve as the basis for modelling, analysis, and estimation. This data includes collar, survey, alteration, assay, lithology, hardness, and redox information that is validated to ensure it is error-free. Light detection and ranging (LIDAR) surface topography strings are another type of data that is validated to ensure that the topography is accurately represented. Once all the data is deemed of high quality and suitable for estimation, the second step of the MRE process is 3D geological modelling based on the drilling data. During this step, validated data is used to generate a series of wireframes to represent the extent and current understanding of the deposit's geology and mineralization. These wireframes are the basis for the geological model, which in turn is the foundation of the MRE, therefore care must be taken to ensure that no error is introduced or allowed to propagate in the process. Irrespective of the computer modelling technique applied, it is vital that the geologist prevents automatic software routines from making programmed assumptions about the geology, because software packages do not have the intellectual experience of the deposit that the geologist has. This process of modelling the geology is essential for defining domains (stationary regions) which make reliable estimation possible. Domains can be defined using grades in an iterative process of selecting mineralized intersections from each borehole and then plotting the distribution of the data and assessing the statistics to identify whether trends exist within the domains. Domaining assists in selecting interpolation techniques; defining subsets within the deposit data and highlighting outliers and extreme grade values, and essentially establishing whether relationships between variables exist.
The third step in the MRE process is exploratory data analysis (EDA), which involves improving the understanding of the domains and their refinement. EDA is generally considered to be the most important aspect in the MRE process because domains are the foundation for reliable variography - the basis of geostatistical estimation. Numerous tests are performed on the domains to ensure that no mixing of populations occurs, as this violates the assumption of stationarity necessary for geostatistical estimation. Unusually high-grade samples (also called extreme values) can result in overestimation of a resource. Histograms, log probability plots, and mean and variance plots can be evaluated to determine whether grade caps and top cuts are to be applied to the domains. If the practitioner is satisfied with the choice of estimation domains, step 4 of the MRE process can be undertaken.
Step 4 involves the calculation of experimental directional variograms followed by the analysis thereof to determine the preferred direction of continuity of the mineralization, and finally the fitting of the variogram models. This is followed by step 5: a quantitative kriging neighbourhood analysis (QKNA) to determine an optimum combination of search neighbourhood and block size to ensure conditional unbiasedness during kriging, as defined by the user. Only once all these steps are satisfactory, can step 6 follow, in which important considerations need to be taken regarding the choice of estimation method and the appropriateness of the method to the deposit's geology and available data.
In most situations, as is often the case for operating mines, the choice of estimation method is motivated by what has been tried and tested over the years. In dealing with natural phenomena, where each deposit is unique, the resource geologist's experience with the deposit can be more influential than what the statistics reveal. Once an estimation method is found to be relevant for the deposit, it is applied to estimate the grades into the block model. Boundary analyses of domains is good practice for determining whether the grade variations across the mineralization-waste boundaries are 'hard' or 'soft' and thus whether to include this information in the estimation method. The end result will be a geological model with estimated grades.
However, for mine planning purposes it is important to know the estimate of the recoverable resource tonnage and content. This is achieved through step 7, in which uniform conditioning (UC) is applied, which allows for a change of support to be applied to the estimation block size tonnages and grade above a cut-off grade in terms of the size of the selective mining unit (SMU). This brings the MRE process towards its final stages, where all the previous steps are validated in step 8 to ensure that the model is realistic and reliable. The model can be validated by generating model statistics and grade plots to check for discrepancies or grade inconsistencies. Visual comparisons; sectional plots through the model, and grade-tonnage curves are techniques that allow for comparisons between the global MREs and the input grades. The Mineral Resource is then classified in accordance to the relevant codes for the reporting of mineral resources in a classification exercise. The final step in the process is model reconciliation. This step is carried out to quantify and qualify the reasons for differences between the updated geological model and consequential updated resource estimate and any previous models for the deposit. The results are then reported in terms of available resource tons and average grades; selected assessment criteria can be applied to identify any inherent risks to the resource estimate, reflected by the reported resource categories.
Geological modelling
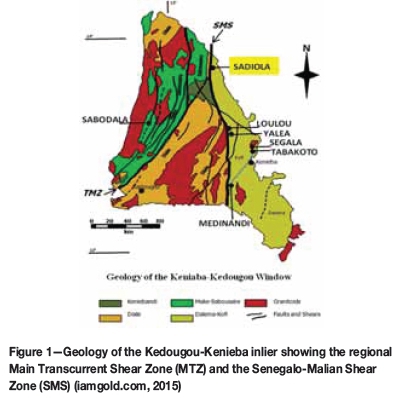
The gold deposit under study is located on the West African craton in the Malian portion of a Paleoproterozoic inlier known as the Kedougou-Kenieba window (KKI) (Diena et al., 2012) shown in Figure 1. The Birimian components of the KKI have been interpreted as a collage of at least two N-S trending terranes. To the west, an older (approx. 2.2 Ga) greenstone belt volcanosedimentary succession intruded by major calc-alkaline batholiths belongs to the Saboussire Formation. It is separated from the dominantly sedimentary Kofi Formation by the major north to northeast trending Senegalo-Malian Shear Zone (Aida et al., 2012; Masurel et al., 2012).
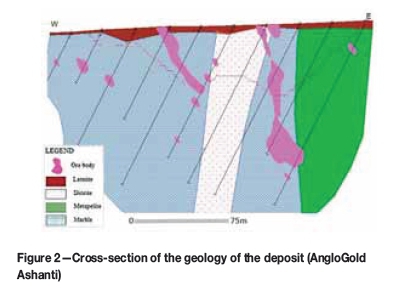
The mineralization has a strong structural control and is spatially associated with a complex weathering and alteration pattern, possibly associated with a mesothermal origin -typical for gold emplacement in West African Birimian rocks (Aida et al., 2012; Masurel et al., 2012). The strata are folded and dip gently to the east (25-50 degrees) and comprise graphitic metapelites overlying impure carbonates (Figure 2).
The mineralization is thought to be controlled by a combination of lithology, structure, weathering, and alteration, necessitating the need for updated geological wireframes of the weathering surfaces, hardness boundaries, extent of the graphitic alteration, and gold mineralization as new information became available. All drilling data was validated in terms of geology and geochemical analysis before modelling.
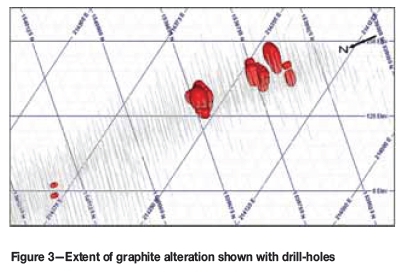
Graphite alteration can reduce metallurgical recoveries. The extent of the graphite alteration therefore needed to be investigated. A graphite wireframe (Figure 3) was created using the interpolation technique in Leapfrog® mining software based on the logged alteration codes in the drill-hole file. Indicator kriging (IK) was then applied to estimate the extent of the graphite. However, these results did not visually compare well to the modelled graphite and were therefore ignored.
The drill-holes were composited to 2 m intervals and then used to generate grade envelopes in Leapfrog® in an attempt to separate out higher grade areas in order to estimate them separately. The data was transformed to Gaussian space before interpolation; a spheroidal variogram was used and a geological threshold grade was selected for the interpolation. The spheroidal interpolant function in Leapfrog® was selected to create the grade envelope based on the fixed-range spherical variogram used in geostatistical modelling. The spheroidal interpolant function approximates the spherical variogram while forming a smooth interpolant. The process of choosing a suitable threshold grade was iterative and aimed at identifying the direction of strongest continuity in the mineralization based on knowledge and understanding of the deposit. The choice of grade threshold can be revealed only by iteration, since grade continuity is irregular. The aim is to identify the grade that displays the strongest continuity to honour the principles of stationarity that underlie the theory of geostatistics. The threshold grade decision is thus dependent on both the data and the intuition of the modeller.
The approach followed to constrain the ore envelopes in this study tended towards the more conservative - a balance between over-constraining (exaggerating the grade continuity) and under-constraining (including large quantities of boundary waste) the wireframes was taken to avoid misrepresenting the grade and recoverable metal. Manual refinement of the envelopes was required to avoid allowing the interpolation software to introduce inappropriate assumptions about the deposit geology. This manual adjustment involved using 'dummy' high- or low-grade points to either extend mineralization where the modelled connectivity was less than desired or restrict mineralization where the modelled connectivity was more than desired (or there were unreasonable extensions beyond data support -often termed Leapfrog® 'blowouts').
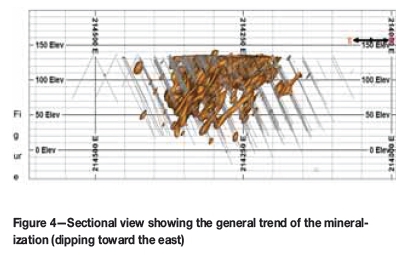
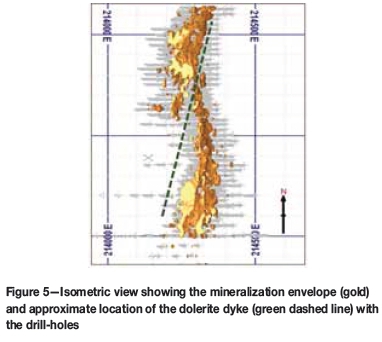
The resultant interpretation of the mineralization is shown in Figure 4 - it strikes approximately N-S (for 1.1 km) and dips at 50 degrees towards the east. Near its centre, there is a break in the mineralization where a dolerite dyke has intruded along a fault that has separated and displaced the mineralization (Figure 5). The previous and updated mineralization interpretations were carefully assessed and they compared well in terms of the geological controls governing the mineralization.
Exploratory data analysis
Samples within the mineralized envelope were deemed 'ore' and those outside, 'waste'. Domains are defined as zones that are geologically and statistically homogenous (supported by variography and statistical analysis) (Duke and Hanna, 2001). The domains in the study were defined using grades in an iterative process of selecting mineralized intersections in each borehole using Leapfrog®. Mineralized domains were identified on the basis of logged samples and grade continuity, and were guided by the previously modelled mineralized wireframes. The spatial limits of these domains are controlled by the 3D geological mesh (Schofield, 2011) and were examined in a boundary analysis exercises. Six domains (laterite ore, saprolite ore, hard ore, laterite waste, saprolite waste, and hard waste) were identified. The 'ore' (or mineralized) domains (laterite, saprolite, and hard) were compared to determine whether they should be estimated together or separately.
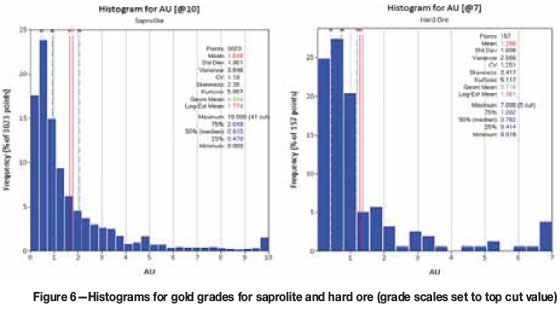
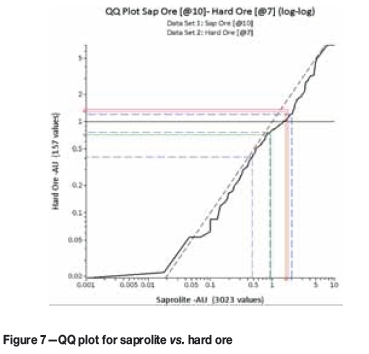
The statistics and distributions of the hard and saprolite ore were compared and found to be fairly similar, but the saprolite mean ore grade was higher at 1.65 g/t than the hard ore mean grade of 1.29 g/t.
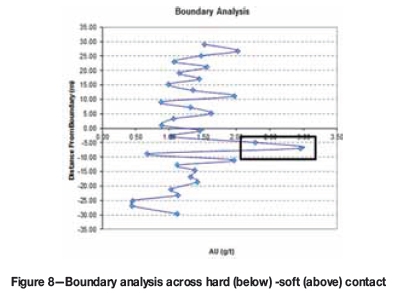
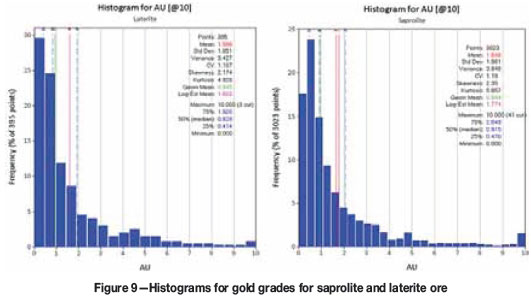
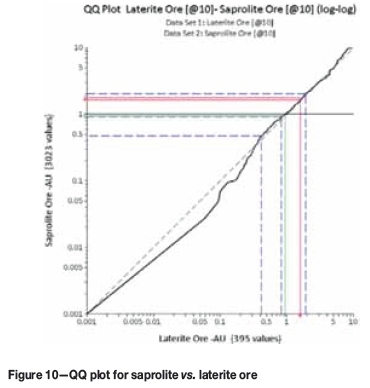
In addition, the grade variation along the hard-soft contact was investigated (Figure 8). The results showed slight grade enrichment immediately below the hard-soft contact and that the grade tended to decrease gradually with depth. It was therefore decided that the saprolite and hard ore zones should be estimated separately, applying a hard boundary between them for estimation. Comparison of the laterite and saprolite mineralization grades (Figure 9) showed comparable means of 1.59 g/t for laterite and 1.65 g/t for saprolite. The QQ-plot (Figure 10) also showed that, even though the laterite data-set comprised very few samples, the two data-sets had similar grade distributions (except at the lower end of the distribution below about 0.5 g/t). The laterite and saprolite zones were thus combined during estimation. It was, however, noted that further work would be required on boundary analysis as in reality the laterite and saprolite are very different, despite statistics suggesting that they are similar. The zones were combined for variography, but it was decided that they should be considered separately for future estimation updates.
This threshold grade used for geological modelling purposes differs from the calculated cut-off grade, which is associated with the economics of the deposit rather than the geostatistics. Several grade envelopes were modelled at various grade threshold scenarios and the selected threshold used was the one that showed the best grade continuity. Swath plots were generated using the Bloy® Geostats Kit (GSK) to identify any trends in the Au grade data. The plots were generated along strike (northing) at 25 m intervals and along elevation at 10 m intervals based on the block model cell dimensions. The results indicated that the domaining was acceptable and that no further separation into sub-domains was required i.e. the data displayed stationarity.
Variography
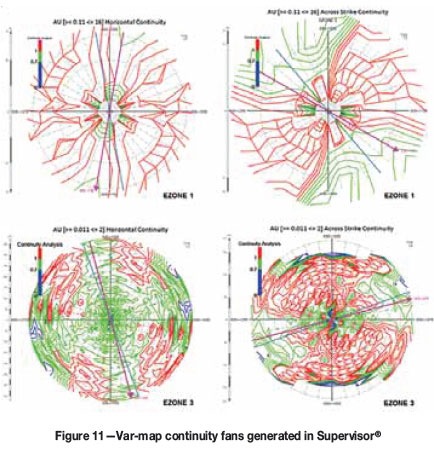
An insufficient amount of data was available to obtain a robust variogram model for the hard ore domain. Variograms that are informed by inadequate data could result in the introduction of errors in the estimation process. The soft ore domain parameters were therefore used for the hard ore estimation. Top and bottom cuts were applied for variogram calculations to improve the resulting variogram structures based on an assessment of the statistics and shapes of histograms for Au grades for each domain before and after cuts were applied. Supervisor® (v8) geostatistical software was used to calculate and model the variograms to assess spatial continuity. The directions of continuity were evaluated by making use of variogram contours (Figure 11) on the horizontal, across-strike, and dip planes to determine continuity along strike, down dip, and across plunge.
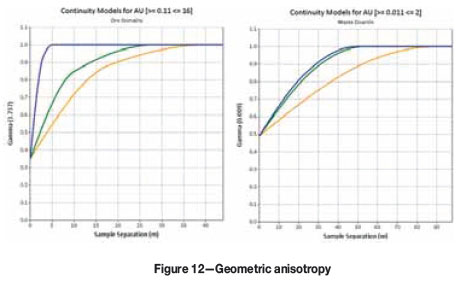
The nugget effect was determined from the downhole variogram. Next, directional variograms were calculated to identify any changes in grade behaviour i.e. anisotropy in the different directions. The ore and waste domains produced anisotropic (geometic anisotrop) nested variogram models with the same sill in all directions but different ranges (Clark, 1979).
Various lags ranging from 17 to 43 m were used along and across strike, and 2 m lags for downhole (composite length). The angular tolerance applied also varied between 12 and 30 degrees for the along and across strike variograms, and between 10 and 35 degrees for down dip. The shortest direction variograms (along the mineralization thickness) were typically in the downhole direction. To test the variogram orientations in Datamine®, a 3D ellipsoid was constructed for the ore domains and modified to better represent the orientation of the mineralization.
Quantitative kriging neighbourhood analysis
Kriging is a 'minimum variance estimator' if the search neighbourhood is properly defined. The objective of quantitative kriging neighbourhood analysis (QKNA) is to determine the optimum combination of search neighbourhood and block size that results in conditional unbiasedness during kriging, as defined by the user (Bertoli et al., 2003). QKNA was done using the Bloy® Geostats kit (BGK), which involved optimization based on a simulated drilling grid that approximates the drill spacing of the data informing the estimate. To optimize the number of composites, the close-spaced theoretical sample spacing of 25 m x 25 m x 7 m was used, together with a discretization of 5 m x 5 m x 5 m. The maximum and minimum numbers of samples were varied and assessed and a minimum number and maximum number of optimal samples selected for the ore zones. For the block size optimization (based on the ore variogram applied for both hard and soft ore estimation) a theoretical sample spacing of 25 m x 25 m x 7 m was assumed, together with a discretization of 5 m x 5 m x 5 m and a selected minimum and maximum number of samples. Search ellipses were oriented according to the approximate orientation of the mineralization with search distances set to approximate the variogram ranges. The optimal model block size was found to be 25 m x 25 m x 10 m. Smaller block sizes, although more optimal than larger 25 m x 25 m or 50 m x 50 m blocks, are not useful for uniform conditioning and were therefore ignored. For optimal UC results, larger block sizes are recommended to ensure a sufficient number of SMUs in the estimation panel. The search neighbourhood was optimized based on a simulated drilling grid that approximated the drill spacing where less data was available. The search ranges selected were not limited to the variogram ranges. For the search distance optimization, the wider spaced theoretical sample spacing of 25 m (X) x 25 m (Y) x 10 m (Z) was used together with the optimized block size, a discretization of 5 m (X) x 5 m (Y) x 5 m (Z), and the optimized minimum and maximum number of samples.
Grade estimation
Kriging provides the best estimate since it results in the smallest standard error, narrowest confidence interval, and most confidence (lowest risk) (Bertoli et al., 2003). The deposit lent itself well to the use of ordinary kriging (OK) as an estimation technique since the method performed well on historical models for the deposit. The data did not show any significant trends at the scale of modelling and the variograms were characteristic of local stationarity. The block model grades were estimated using OK in Datamine® Studio 3.
The estimates were kriged into a sub-celled block model to best represent the wireframe volumes and contacts. The estimation and search parameters used for estimation were based on the results of the parameter optimization during the KNA, whereby both kriging efficiency (KE) and slope of regression (RSlope) were used to investigate conditional bias for a given set of estimation parameters. Histograms, log probability plots, and mean and variance plots were analysed to determine whether grade caps were appropriate per domain. Estimates are sensitive to grade capping, therefore attempts were made to keep the values capped to no more than 0.6% of the total data-set, based on company guidelines. The variability in each domain (as expressed by the CV) decreased slightly after capping. Top cuts (99th percentile or above) are generally applied to remove the extreme grade values from the resource database while including the high-grade assays below the top cut that are recognized as a real feature of the assay distribution (Pocock, 2001, citing Enterprise Metals, 1990). It was decided best to include the extreme grade values, because the histograms and variograms for each domain showed that they were reliable and should be used in the estimation.
Uniform conditioning
The aim of UC is to estimate the tonnage and the metal content of blocks (SMUs) inside a panel conditioned to the panel grade and distribution, which is estimated assuming local stationarity (e.g. OK) (Geovariances, 2015). The ISATIS® geostatistics software package was used to generate a recoverable resource model using the UC technique.
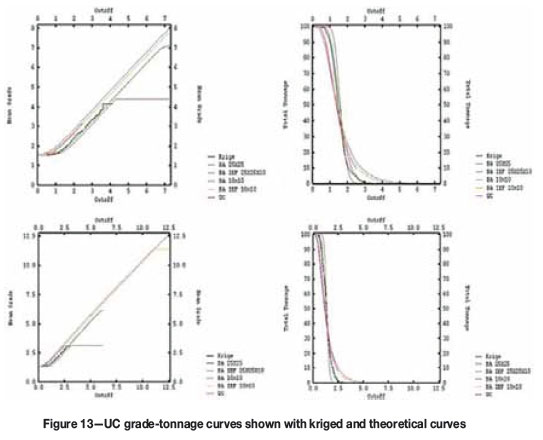
The detailed mathematical calculations underlying the process are not presented, as they are beyond the scope of this paper; however, more information can be found in the thesis by Neufeld (2008). The UC methodology followed was in accordance with the work by Neufeld (2008), which involves estimating the panel grades, fitting a discrete Gaussian model (DGM) to the data, determining the change-of-support coefficients, transforming the panel estimates, and finally calculating the proportion and quantity of metal above the different cut-offs. An SMU size was assumed based on the selectivity achievable with the mining equipment. A tonnage adjustment factor was applied and was based on a volume representing half the SMU size. It was expressed as a percentage of the panel size (2.7%). Any proportions smaller than this percentage were removed as they would not be recoverable in practice. The SMU estimates were then added to the kriged block model in Datamine® Studio 3. The UC results were compared with the kriged results and the theoretical grade-tonnage curves (block average with and without the information effect - IEF). Overall, the UC curves compared well with the theoretical curves - especially in the well-informed domains, and the degree of selectivity achieved appeared reasonable. In Figure 13 the kriged curves are shown in black; the UC curve in blue, and the theoretical curves in red and green (without and with the information effect respectively). UC was not applied to the waste zone (dummy UC values were placed in the grade and proportion fields).
Model validation
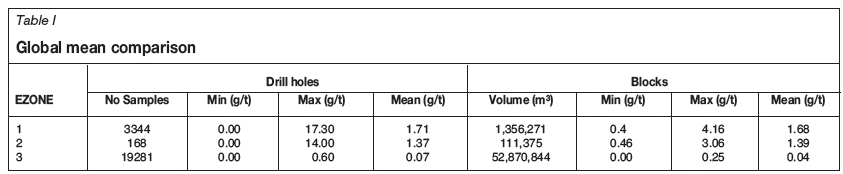
The block model estimates were validated by visually comparing the model estimates against input grades; comparing the global and input means; creating sectional plots of number or composites, model grades, and composite grades; and calculating grade-tonnage curves. Globally, the model means for the ore zones were within 10% (± 2%) of the input data means (Table I), indicating that the estimates are representative of the input data and thus acceptable.
Slice plots were generated for each estimated zone (EZONE). The input sample composite averages and calculated block model grades were calculated on the eastings (vertical N-S slices) that correspond to the dimensions of the block model block, which was 25 m thick (Figure 14). The purpose was to compare the input sample data with the resulting block model data to ensure that no gross over- or underestimation occurred (smoothing). The northing composites generally compared well, but local over- and underestimation was attributed to the estimation process and the selection of the composite level relative to the parent block centroids.
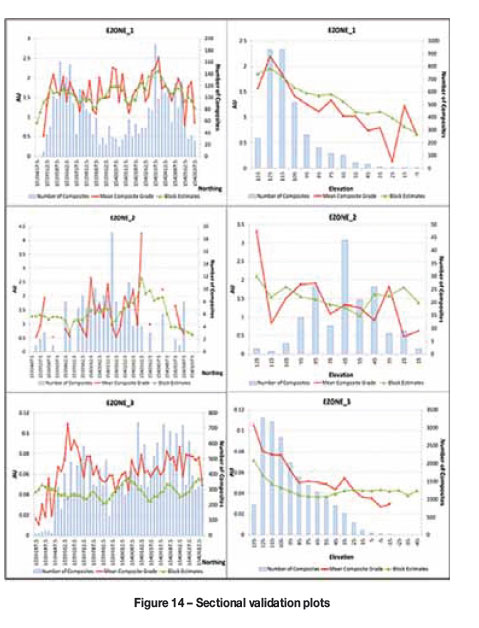
Other deviations occurred due to reduced tonnages at the edge of the deposit as well as differences in grade in lower grade areas - generally at the flanks of the deposit, where the density of drilling decreases, material is classified as Inferred Mineral Resources. In the case where block estimates were higher than the composites, this was possibly due to the orientation of the kriging ellipse against the orthogonal nature of the slice plots or 'edge effects' due to nearing the domain boundary. Overall, the block averages followed the general trend of the input sample data. On a local scale, the model did not provide reliable estimates of grade, but on a larger scale, it represented unbiased estimations of the grade distributions based on the underlying sample data. EZONE 3 showed that the sample grades were in some cases higher than the block estimates, which may suggest a bias since the grades were extremely low as this is a waste zone.
Mineral Resource classification
The Mineral Resource was classified in accordance to the South African Code for the Reporting of Exploration Results, Mineral Resource and Mineral Reserves (SAMREC) 2009 and Joint Ore Reserves Committee (JORC) Code 2012. The deposit was further classified in accordance to the relevant company guidelines. The drill-hole spacing selected for the classification was based on drilling studies on historical reconciliation for the mine. A drill spacing of 25 m by 25 m was considered sufficient to classify the Mineral Resource as Indicated, and 50 m by 50 m as Inferred. No Measured Resource was defined.
Model reconciliation
The previous Mineral Resource model was compared with the updated Mineral Resource model within a common volume to quantify the differences as a result of the model update. Grade-tonnage curves for the common volume were also calculated. Changes were ascribed mostly to the changes in the interpretation of the mineralized envelopes, the estimation search parameters, and the general increase in the bulk densities assigned to the various rock types.
The detailed reconciliation study showed that the new MRE identified an additional 7191 ounces of Indicated (oxide) Mineral Resource, 1893 ounces of which was previously classified as Inferred. The increase was attributed to the extension of some of the mineralized zones and better grade continuity for others based on the updated geological model.
Conclusion
This study described the identification of additional oxide ore potential at a gold deposit in Mali based on 3D geological modelling and geostatistical evaluation techniques as informed by newly drilled advanced grade-control holes. The findings of the ten-step MRE process adopted revealed that the deposit contained an additional oxide Mineral Resource (7191 ounces) identified in the new 3D geological model. Due to the new drilling information, the geological understanding of the deposit was improved, making it possible to better constrain the resource estimates within a new geological model. This included improvements in the interpretation of the mineralized envelope in the areas where the drilling campaign provided new information. In some areas the continuity of the modelled mineralization was extended, and in other areas the envelopes were constrained to reduce the boundary waste that was previously included. The new data also allowed for the updating of variograms, estimation parameters, and top-capping applied. Potential risk to the model could originate from bias identified in grade-tonnage curves which exists irrespective of the effectiveness of the estimation process, as well as the inherent risk associated with geological uncertainty as a result of not being able to completely capture the true nature of the geology. From the context of a conventional approach to 3D geological modelling and MRE, the results were acceptable. However, to fully characterize the geological uncertainty, stochastic approaches to orebody modelling and estimation should be considered.
Acknowledgments
The authors express their gratitude to AngloGold Ashanti Limited for permission to use all data and the relevant software necessary for the project. Special thanks to Mr Vasu Govindsammy (Evaluation Manager, AGA) and Miss Emi Maritz (Senior Evaluation Geologist, AGA) for their assistance and support.
References
Clark, I. 1979. Practical Geostatistics. Applied Science Publishers, Barking, Essex. 129 pp. [ Links ]
Duke, J.H. and Hanna, P.J. 2001. Geological interpretation for resource modelling and estimation. Mineral Resource and Ore Reserve Estimation - The AusIMM Guide to Good Practice. Edwards, A.C. (ed.). Australasian Institute of Mining and Metallurgy, Melbourne. pp. 147-156. [ Links ]
Geovariances. 2015. Localized multivariate uniform conditioning. http://www.geovariances.com/en/IMG/pdf/_GeovMining_LocalizedMu ltivariateUniformConditioning.pdf [Accessed 12 January 2015]. [ Links ]
Masurel, Q., Thebaud, N., Miller, J., and Ulrich, S. 2012. Tectonics, magma generation and gold endowment: a study of the contrasting mineralization styles in the world-class Sadiola gold camp, Mali, West Africa. Society of Economic Geologists Conference: Building Exploration Capability for the 21st Century, Keystone, CO, 27-30 September 2014. Society of Economic Geologists, Littleton, CO. [ Links ]
Masurel, Q., Thebaud, N., Miller, J., Stanislav, U., and Ockert, T. 2012. The world-class Sadiola gold camp, Mali, West Africa: Evidence for contrasting styles of carbonate-hosted mineralisation within an orogenic gold province. Proceedings of Gold14@Kalgoorlie, Kalgoorlie, WA, 8-10 October 2014. Australian Institute of Geoscientists. https://wwww.google.co.za/url?sa=t&rct=j&q=&esrc=s&source=web&cd=16&cad=rja &uact=8&ved=0CDEQFjAFOApqFQoTCO6xqJaE _sYCFQwcPgodmisD6w&url=http%3A%2F%2Fsjsresource.worldsecuresystems.com% 2F_literature_127582%2FBulletin_No_59_(Low_Res)&ei=KpG3Ve70C4y4-AGa14zYDg&usg=AFQjCNGeInZfYf-X094WxiMEadhio1tgkg&sig2=Uetf9ejxQuB8zwAKpAJ7Sg&bvm=bv.98717601,d.cWw [Accessed 10 June 2015]. [ Links ]
Neufeld, C.T. 2005. Guide to Recoverable Reserves with Uniform conditioning. Guidebook Series, vol. 4. Centre for Computational Geostatistics (CCG), Canada. [ Links ]
Pocock, J.A. 2001. Why feasibility resource estimates under-valued the Peak ore body. Mineral Resource and Ore Reserve Estimation - The AusIMM Guide to Good Practice. Edwards, A.C. (ed.). Australasian Institute of Mining and Metallurgy: Melbourne. pp. 299-314. [ Links ]
Schofield, N.A. 2011. Geological domaining and resource estimation - a discussion. Proceedings of the 35th APCOM Symposium, Wollongong, NSW. Australasian Institute of Mining and Metallurgy, Melbourne. [ Links ]
SAMREC. 2009. South African Mineral Resource Committee. The South African Code for Reporting of Exploration Results, Mineral Resources and Mineral Reserves (the SAMREC Code). 2007 Edition as amended July 2009. pp. 11-12. http://www.samcode.co.za/downloads/SAMREC2009.pdf [ Links ]
Vann, J., Jackson, S., and Bertoli, O. 2003. Quantitative kriging neighbourhood analysis for the mining - a description of the method with worked case examples. Proceedings of the 5th International Mining Geology Conference, Bendigo, Vic, Australia. Australasian Institute of Mining and Metallurgy, Melbourne. [ Links ]
Paper received Apr. 2016
Revised paper received Sep. 2016

