


Services on Demand
Article
 English (pdf)
 Article in xml format
 Article references
Indicators

Related links
-
 Cited by Google
 -
 Similars in Google
Share

 Permalink
Journal of the Southern African Institute of Mining and Metallurgy
On-line version ISSN 2411-9717
Print version ISSN 2225-6253
J. S. Afr. Inst. Min. Metall. vol.117 n.2 Johannesburg Feb. 2017
http://dx.doi.org/10.17159/2411-9717/2017/v117n2a7
WITS SPECIAL EDITION - VOLUME II
Analysis of the effect of ducted fan system variables on ventilation in an empty heading using CFD
T. Feroze; B. Genc
School of Mining Engineering, University of the Witwatersrand, South Africa
SYNOPSIS
The effect of some of the system variables in forcing and exhausting ducted fan systems on ventilation in an empty heading was investigated using computational fluid dynamics(CFD) and comparative analyses. The diameter of the duct, duct mouth to face distance, and the power of the fan (quantity delivered by the fan) were varied and their effect on ventilation determined through a comparative analysis of the flow rates calculated close to the face of the heading. Estimation models were developed, which can be used to calculate the flow rate close to the face of the empty heading for different settings of the system variables studied.
The study showed that recirculation for a forcing ducted fan system can be reduced by increasing the duct diameter or increasing the duct mouth to face distance. For the exhausting ducted fan system, higher flow rates were achieved by reducing the duct mouth to face distance, and increasing the fan design flow rate and duct diameter.
The outcomes of this investigation will help ventilation engineers in deciding the optimum duct fan system required for sufficient ventilation.
Keywords: ducted fan, ventilation, CFD.
Introduction
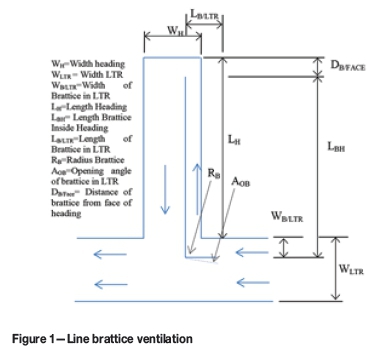
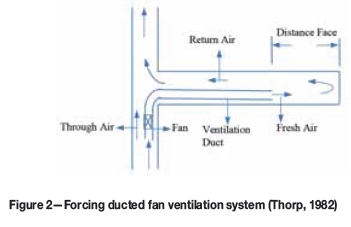
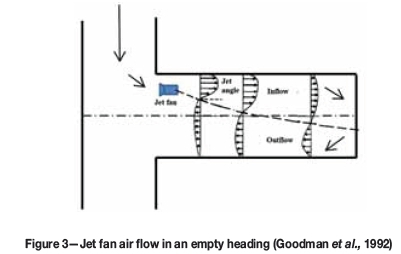
The ventilation of underground mines, irrespective of the type of mine and mining method, is divided into two broad branches, the primary ventilation and secondary or auxiliary ventilation. The primary ventilation is responsible for the total volumetric flow through the mine and the auxiliary ventilation is responsible for the ventilation of the development ends, production areas, and facilities disconnected from the main circuit with no through-ventilation connections. Auxiliary ventilation is the more difficult to achieve (Bise, 1996), and the disruption of this ventilation system is considered to be one of the primary factors contributing to methane and coal dust explosions (Creedy, 1996). A number of causalities have been recorded by many authors due to these explosions (Phillips and Brandt, 1995; Dubinski et al., 2011; Phillips, 2015). The ventilation of short headings, less than 10 m in depth, can be carried out without the use of any auxiliary equipment (Feroze and Phillips, 2015). However, for headings deeper than 10 m, auxiliary ventilation systems are required. These are generally classified into the three basic types, namely line brattice (LB) ventilation systems, ducted fan systems, and jet fans (Figures 1 through Figure 3 respectively).
Ducted fan systems are also classified into three types, namely forcing, exhaust, and overlap. The decision to select a particular type of ducted fan system depends on the nature of the hazard (Pawinski and Roszkowski, 1985; McPherson, 1993). A ducted fan is generally installed on the intake side in the forcing configuration and on the return side in the exhaust configuration (Reed and Taylor, 2007).
The forcing system of duct and fan consists of a line of ducting, to which a fan is connected to force air into the heading. It is usually used in mines with high methane hazards, and can effectively remove the methane hazard through dilution (Taylor et al., 1997). Szlazak et al. (2003) have shown that the methane concentration measured in headings is lower with the forcing system than with exhaust systems under the same ventilation and methane emission conditions. The high velocity of air helps in mixing the methane with air, which prevents it from settling on the roof and provides cooler air at the face (McPherson, 1993). Studies by Schultz (1993) and Kissell (2003) indicated that the proportion of fresh air reaching the face is 39.9% for the forcing system and 10% for the exhaust system. Torano et al. (2009) found these proportions to be 35% and 12%, respectively. The forcing system results in a positive gauge pressure, thus a cheaper and flexible duct can be used (AMC Consultants, 2005). In South African coal mines, forcing ducted fans generally are used.
The exhaust system of duct and fan consists of a duct line to which a fan is connected to exhaust air into the heading. It is primarily used in mines with higher dust hazards since a forcing system with high velocity spreads the dust. Rigid ducting is required because of the negative pressure involved, adding to the cost (AMC Consultants, 2005). This system is not suitable for long headings since the resistance of the duct becomes large, warranting the use of multiple fans in series (McPherson, 1993). The possibility of methane build-up is a general concern with this system. In Polish coal mines in 2002, the contributions of the forcing, exhaust, and overlap auxiliary ventilation system were 16%, 43%, and 41% respectively (Szlazak, 2003).
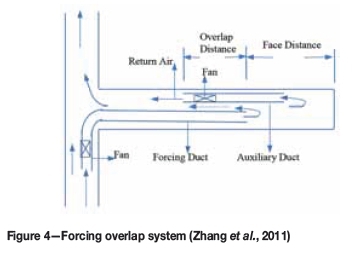
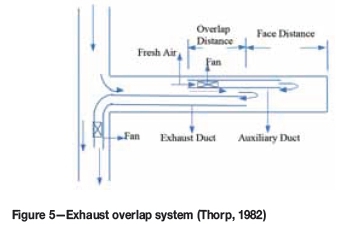
An overlap ventilation system is a combination of a primary and a secondary duct. The overlap of a primary forcing duct and a secondary exhaust overlap duct, as shown in Figure 4, is called the forcing overlap. The overlap of a primary exhaust duct and a secondary forcing overlap duct, as shown in Figure 5, is called the exhaust overlap system. An overlap system is in the forcing overlap configuration during cutting operations, whereas an exhaust overlap configuration is used when thermal, methane, and dust hazards are encountered simultaneously (Szlazak, 2003).
The ducted fan system is well-studied, but not much information is available in the literature to demonstrate the effect of the system variables associated with these methods on ventilation of an empty heading. The system variables, such as the diameter of the duct, the length of the duct, distance of the duct mouth to face, the power of the fan (quantity delivered by the fan), the orientation of the duct (distance from the sidewall and the roof), the airflows in the LTR etc. affect ventilation, but the magnitudes of these effects need to be established. This study demonstrates the use of computational fluid dynamics (CFD) and comparative analyses to estimate the effect of some system variables associated with forcing and exhaust ducted fan systems on the ventilation of an empty heading. The presence of dust and methane was not considered. The understanding of these effects is important and will help ventilation engineers in the selection of an optimum ducted fan system for sufficient ventilation.
Research matrix
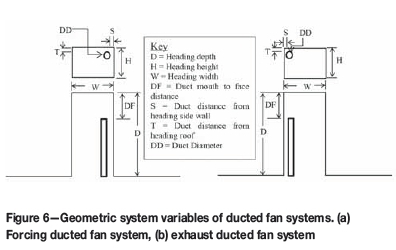
The diameter of the duct, duct mouth to face distance, and fan design flow rate were varied for both the forcing and exhaust duct systems. The range of values chosen for these variables, and the values for those that were kept constant, were based on the most common settings in practice. The details of these variables and their values are given in Table I and shown in Figure 6 for both the forcing and exhaust ducted fan systems. All possible combinations of these variables were used to develop scenarios for each fan system. The ducted systems considered were assumed to be leakage-free.
Numerical modelling of the ducted fan system using CFD
The numerical modelling, comprising the creation of the geometry, meshing of the geometry, solving the complex set of mathematical equations iteratively, and analysis of the results, was carried out using the commercially available ANSYS Fluent numerical code. The K-ε realizable model was used for this study. This model was used after validating the results, using experimental studies described later. The experimental results showed that the model is suitable for studying ducted fan systems using CFD. The details of the turbulence model are available in the software manual (ANSYS Fluent Theory Guide, 2015).
Model geometry and meshing
The three-dimensional models were generated in the ANSYS design modeller software for all the cases. The length of the LTR modelled on both the upstream and downstream side of the heading was kept at 10 m for all the cases. As far as possible, a structured hexahedral mesh with a size of 0.04 m was created using the ANSYS Mesher. The mesh size was selected after performing mesh-independence tests. Inflation layers, where required, were used at the boundaries of the geometries to allow smooth transition from the laminar flow near the wall to turbulent flow away from the walls.
Boundary conditions
► At the inlet of the LTR, 'Velocity inlet' boundary condition was used with an air velocity of 2 m/s
► At the outlet of the LTR, 'Outflow' boundary condition was used
► 'Fluid fan' boundary condition was used for both the fans
► At all the walls an enhanced wall function was used in all the simulations.
Results and discussion
Forcing ducted fan system
The variation of the fan design flow rates (maintained at the exit of the duct), diameter, and length of the duct changed the volumetric flow rates inside the heading at similar locations. The air flow rates (into the heading) close to the face of the heading were calculated for each case and are tabulated in Table II. These flow rates were calculated using the positive axial velocities going into the planes constructed parallel to the face of the heading at distances of 0.5 m, 0.4 m, and 0.3 m from the face. The percentage of fresh air at these distances was also calculated, using the quantity of air delivered by the fan and the quantity of air actually present at these distances (assuming the quantity of air delivered by the fan is reaching the face of the heading). This enabled the calculation of the maximum percentage of fresh air reaching the face and thus the minimum recirculation (100 - % of fresh air) near the face of the heading for each case.
The total flow rates and the amount of fresh air close to the face of the heading, using a forcing ducted fan system, varied as follows.
► Volumetric flow rate close to the face of the heading:
- When the diameter of the duct and the duct exit flow rate were kept constant, the flow rate close to the face of the heading increased with decreasing duct mouth to face distance
- When the diameter of the duct and duct mouth to face distance were kept constant, the flow rate close to the face of the heading increased with increasing air flow exiting from the duct
- When the duct mouth to face distance and the duct exit flow rate were kept constant, the flow rate close to the face of the heading increased with decreasing duct diameter, as expected.
► Volumetric flow rate of fresh air close to the face of the heading:
- When the diameter of the duct and the duct exit flow rate were kept constant, the percentage of fresh air close to the face of the heading decreased with decreasing distance of the duct mouth to the face
- When the diameter of the duct and the distance of the duct mouth to face were kept constant, the percentage of fresh air (in the total air reaching the face) close to the face of the heading remained constant with increasing air flow exiting from the duct
- When the distance of the duct mouth to the face and the duct exit flow rate were kept constant, the percentage of fresh air close to the face of the heading increased with increasing duct diameter, as expected.
Mathematical formulation to estimate air flows for forcing duct system
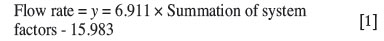
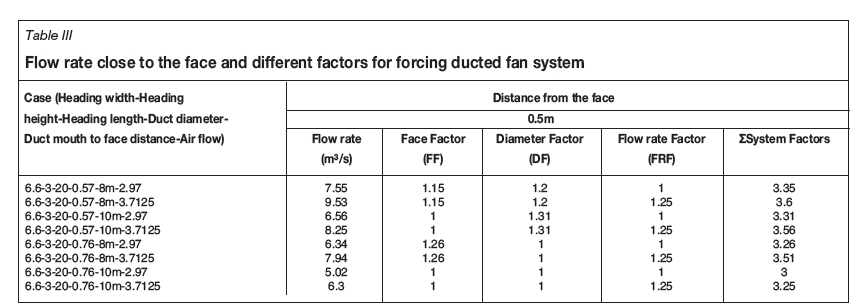
In order to find a relationship to estimate the flow rates reaching the face (0.5 m from face) of the heading using a ducted forcing fan system, the flow rates close to the face of the heading for all the cases were plotted against the summation of the system factors as given in Table III and shown in Figure 7. These factors were calculated to cater for the effects of change in diameter, change in the duct mouth to face distance, and the change in flow rate exiting the duct (fan design flow rate). A linear relation (Equation [1]) was found between the summation of these factors and the corresponding flow rates close to the face of the heading. The factors for each system variable were calculated using comparative analyses as given below:
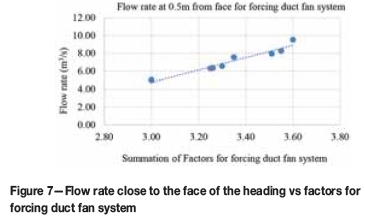
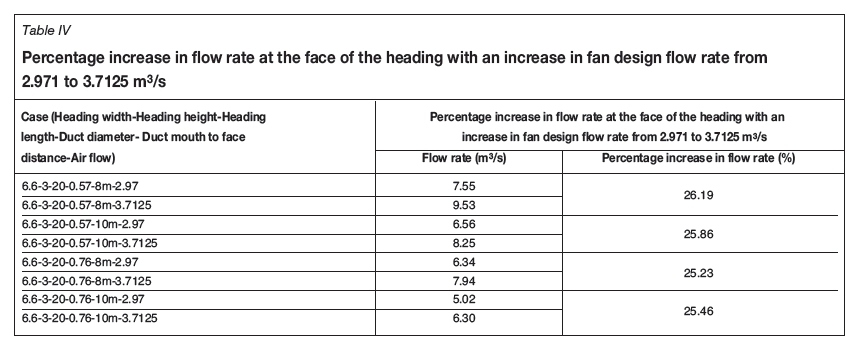
► Flow rate factor (FRF)-All the cases in this study were simulated with two flow rates at the exit of the duct (fan design flow rates): 2.97 m3/s and 3.971 m3/s. The difference between these two flow rates is 25%. A comparison of flow rates at the face of the heading for each set of cases run with these flow rates and similar remaining settings is given in Table IV. It was found that an increase in design flow rate exiting the ducted forcing fan resulted in an approximately proportional increase in the flow rate close to the face of the heading. Therefore, a flow rate factor of unity was assumed for cases using a flow rate of 2.971 m3/s at the exit of the duct, and hence a flow rate factor of 1.25 (an increase of 25% compared to 2.971 m3/s) was used for the cases using 3.7125 m3/s of fan design flow rate.
► Diameter factor (DF)-To find this factor, cases with different duct diameters and similar remaining settings were grouped together. As expected, the change in diameter changed the flow rates close to the face of the heading for each set. The percentage change in the flow rate close to the face of the heading with a reduction in diameter from 0.76 m to 0.57 m varied with the duct mouth to face distance as given in Table V. When this distance was 8 m, the flow rate increased by approximately 20% with the reduction in diameter from 0.76 m to 0.57 m. For a distance of 10 m the increase was approximately 30%. A diameter factor of unity was assumed for a 0.76 m duct diameter for all duct mouth to face distances. Therefore, the diameter factors became 1.2 for the 0.57 m diameter duct with 8 m distance, and 1.30 for 10 m distance. The factors for the intermediate diameters and duct mouth face distances can be interpolated. For example, for the 0.6 m diameter duct with 9 m duct mouth to face distance, this factor can be calculated as follows using Equation [2] (the formula for interpolation):

where (X1,Y1), (X,Y), ((X1,Y1) are three points of a linear relation, X, Y lies between the other two points, and all the points except Y are known:
Factor at 8 m distance =1.2 + [(1-1.2) x ((0.6-0.57) / (0.76-0.57))] = 1.168
Factor at 10 m distance =1.3 + [(1-1.3) χ ((0.6-0.57) / (0.76-0.57))] = 1.2526
Factor at 9 m distance = 1.168 + [(1.2526-1.168) χ ((9 - 8) / (10-8))] = 1.2103
► Face factor (factor for distance of the duct mouth from face) (FF)- To find this factor, cases with different duct mouth to face distances and similar remaining settings were grouped together. It was found that a change in this distance changed the flow rate close to the face of the heading for each set. The percentage change in flow rate close to the face of the heading with a reduction in duct mouth to face distance from 10 m to 8 m varied with the duct diameter as given in Table VI.
When the duct diameter was 0.57 m the flow rate increased by approximately 15% with a reduction in the duct mouth to face distance from 10 m to 8 m. For a duct diameter of 0.76 m, this increase was approximately 26%. A face factor of unity was assumed for a 10 m duct mouth to face distance for all the duct diameters. Therefore, the face factor for a duct mouth to face distance of 8 m and 0.76 m duct diameter became 1.26 (26% increase in flow rate compared to 10 m distance) and for 0.57 m duct diameter, 1.15. The factors for the intermediate diameters and duct exit distances from the face of the heading can be interpolated using Equation [2]. For example, for a 0.6 m diameter duct and 9 m distance of the duct mouth from the face, this factor can be calculated as follows: Factor at 10 m = 1 (as per rule) Factor at 8 m = 1.15 + [(1.26-1.15) x ((0.6-0.57) / (0.76-0.57))] = 1.1673 Factor at 9 m = 1.1673 + [(1-1.1673) χ ((9 - 8) / (10-8))] = 1.08365
► Error - mathematical model-The maximum error of the mathematical model used to estimate the flow rates for all the cases simulated in this study was found to be less than 7%, as shown in Table VII.
Exhaust ducted fan system
Similar to the forcing ducted fan system, the variation of fan design flow rates, diameter and length of the duct changed the volume flow rates calculated inside the heading at similar locations. The air flows delivered by the exhaust ducted system close to the face of the heading have been calculated for each case is tabulated in Table VIII. These flow rates were calculated using the positive axial velocities going into the planes, which are constructed parallel to the face of the heading at distances of 0.5 m, 0.4 m, and 0.3 m. The flow rates decreased closer to the face.
► Volumetric flow rates close to the face of the heading: The flow rates close to the face of the heading (0.5 m from the face), ventilated using a forcing ducted fan system, varied as follows.
- When the diameter of the duct and the duct design flow (fan design flow rate) rate were kept constant, the flow rate close to the face of the heading increased with decreasing distance of the duct mouth to face
- When the diameter of duct and the distance of the duct mouth to face were kept constant, the flow rate close to the face of the heading increased with increasing duct design flow rate
- When the distance of the duct mouth to face and the duct design flow rate were kept constant, the flow rate close to the face of the heading increased with increasing duct diameter.
Mathematical formulation to estimate air flows for exhaust duct system
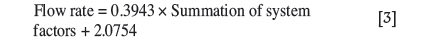
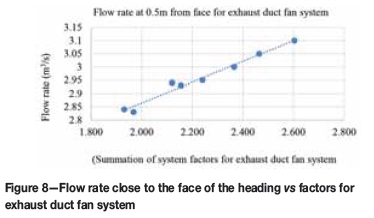
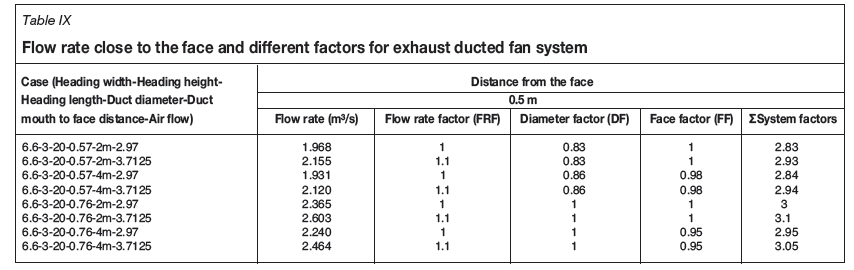
In order to find a relationship to estimate the flow rates reaching the face (0.5 m from face) of the heading, using an exhaust ducted fan system, the flow rates close to the face of the heading for all the cases were plotted against the summation of the system factors as given in Table IX and shown in Figure 8. These factors were calculated to cater for the effects of change in diameter, change in the distance of the duct mouth to face (face factors), and the change in fan design flow rate. A best fit linear relation was found between the two quantities and is given in Equation [3]. The factors were calculated using comparative analysis as discussed below:
► Flow rate factor-All the cases in this study were simulated with two fan design flow rates: 2.97 m3/s and 3.971 m3/s. The difference between these two flow rates is 25%. A comparison of flow rates at the face of the heading for each set of cases run with these flow rates and the same remaining settings is given in Table X. It was found that a 25% increase in the fan design flow rate increased the flow rate at the face of the heading by approximately 10% for all duct diameters and all duct mouth to face distances. A flow rate factor equal to unity was assumed for the 2.971 m3/s duct design flow rate. The flow rate factor for a fan design flow rate of 3.7125 m3/s is therefore 1.10 (10% greater than for 2.971 m3/s). The factors for other duct design flow rates can be interpolated using the methods discussed for the forcing duct fan system.
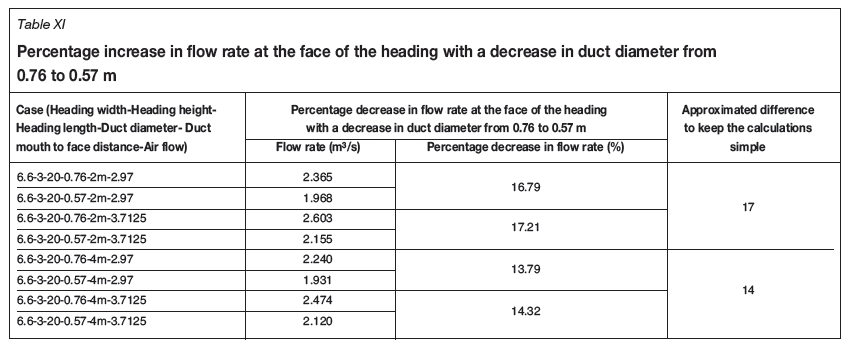
► Diameter factor-To find this factor, cases with different duct diameters and similar remaining settings were grouped together. It was found that a change in diameter changed the flow rates close to the face of the heading for each set. The percentage change in the flow rate close to the face of the heading with a reduction in diameter from 0.76 m to 0.57 m varied with the duct mouth to face distance as given in Table XI. When this distance was 2 m the flow rate decreased by approximately 17% with a reduction in diameter from 0.76 m to 0.57 m. For a distance of 4 m the decrease was approximately 14%. A diameter factor of unity was assumed for 0.76 m duct diameter for all duct mouth to face distances. Therefore, the diameter factors became 0.83 for the 0.57 m diameter duct with 2 m distance, and 0.86 for 4 m distance. The factors for the intermediate diameters and duct mouth to face distances can be interpolated using the methods discussed for the forcing ducted fan system.
► Face factor (FF) (for distance of the duct mouth to face of the heading). To find this factor, a set of cases with different duct mouth to face distances and similar remaining settings were analysed. It was found that the change in duct mouth to face distance changed the flow rate close to the face of the heading. With an increase in duct mouth to face distance from 2 m to 4 m, the percentage change in flow rate close to the face of the heading varied with the duct diameter as given in Table XII.
When the duct diameter was 0.57 m the flow rate decreased by approximately 2%, and for the duct diameter of 0.76 m the decrease was approximately 5%. A factor equal to unity was assumed for the 2 m duct mouth to face distance for all duct diameters. Therefore the face factor for a 4 m duct mouth to face distance with 0.76 m duct diameter became 0.95 (a 5% reduction in flow rate compared to 2 m distance) and for 0.57 m diameter duct it became 0.98.
► Error of the mathematical model-The maximum error of the mathematical model for the exhaust ducted fan system, used to estimate the flow rates for the simulated cases of this study, was found to be less than 1% as shown in Table XIII.
As expected, the flow rates close to the face of the heading with both the 0.57 m and 0.76 m diameter ducts were much lower for the exhaust duct system than for the forcing duct system. The air velocities, as seen from the velocity vectors, were also low. The flow rate increased with increasing diameter of the duct, increasing fan/duct design flow rate, and reduction in the duct mouth to face distance. Therefore, when using an exhaust duct ventilation system, the duct mouth to face distance should not be more than 4 m, and the largest possible/permissible diameter should be used to maximize the flow rate close to the face of the heading.
It was seen from the results that in the studied configurations, forcing ducted fan system produced much higher flow rates close to the face of the empty heading than the exhaust duct fan system. The recirculation was also found to be higher for the forcing ducted fan system. An overlap system using both the forcing and exhaust systems, which is seldom used in the South African mining industry and was not considered in this investigation, is expected to overcome the limitations of both the systems.
Validation case study
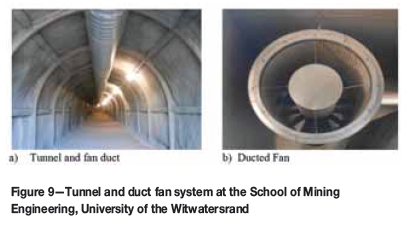
A number of numerical models are available in CFD software. The choice of a model depends on a number of factors, the most important of which is the reliability of the results. To demonstrate the reliability and accuracy of a numerical model, validation of the model is required. A numerical model is generally validated using one of three approaches: comparison of simulated results with laboratory results, using experimental results from the literature, and comparison of simulated results with experimental results. A numerical model validated using one of these techniques is considered suitable for studies involving a large number of situations in similar environments without further experiments in the actual environment. The numerical model used for the present study was validated using an experimental study undertaken in the School of Mining Engineering at the University of the Witwatersrand.
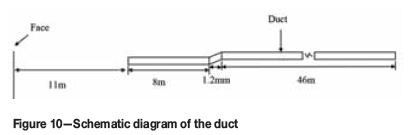
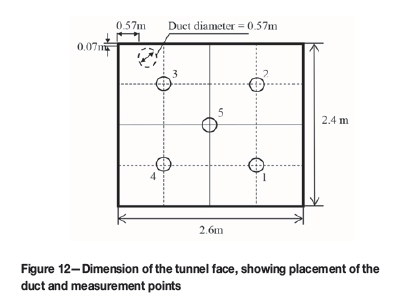
The School has constructed a 66.2 m long mock tunnel equipped with a ducted fan ventilation system, as shown in Figure 9. The duct length is 55.2 m and the diameter of the duct is 0.5 m. The duct delivers an air flow of 1.98 m3/s with an average air velocity of approximately 10.08 m/s at the exit of the duct. The duct mouth to tunnel face distance is 11 m as shown in Figure 10.
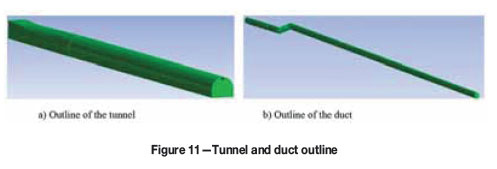
The tunnel and duct models are shown in Figure 11. The tunnel is dome-shaped at the entrance, but becomes rectangular near the face. The width and height of the tunnel at the face are 2.6 m and 2.4 m respectively. The distances of the duct from the top and left wall of the tunnel are 0.07 m and 0.57 m respectively, as shown in Figure 12.
The air velocities were determined at several points on a vertical plane at a distance of 0.5 m from the face of the tunnel, using both physical experiments and numerical solutions. A comparison of the results showed good correlation, and gave confidence to use the same numerical model for further simulations required for the research.
Experimental set-up and results
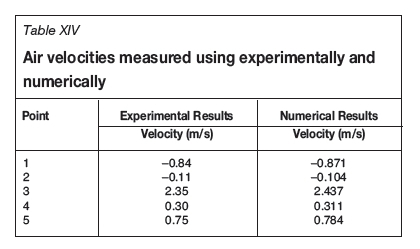
The flow rate at the exit of the duct is equivalent to 1.98 m3/s. This was confirmed using both an anemometer and a digital pressure meter (GMH 3110). The face of the heading was divided into five regions as shown in Figure 12. The air velocity at the centre of each region was measured using both a hot wire and a rotating vane anemometer (Airflow TA440, LCA 6000) and the direction of the air flow was confirmed using a smoke tube. The velocities of the air towards (positive sign) or away from (negative sign) the five measurement points were measured, and the results are given in Table XIV with the numerical results.
Numerical calculations
The three-dimensional model (Figure 11) was generated in the ANSYS design modeller. A fine mesh of size 0.04 m was created on all the boundaries (walls) of the domain using the ANSYS Fluent Mesher. 'Velocity inlet' and 'Outflow' boundary conditions were used for the fan and the outlet of the tunnel, respectively. 'Wall boundary' condition was used at all the walls of the domain. The properties of air at 24°C (as calculated in the tunnel) were used for the calculation of the numerical solution. The two-equation k-e realizable turbulent model was used for this study. The iterative process used for calculating the results was set to run until five orders of residual reduction was achieved (convergence criteria of 10-5) with second-order accuracy.
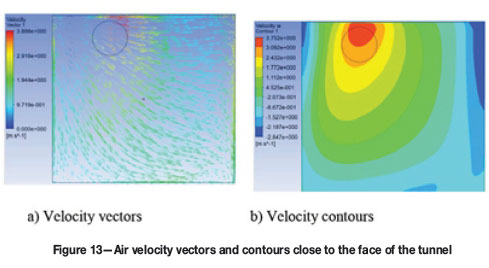
The air velocity vectors and contours on a vertical plane constructed at a distance of 0.5 m from the face of the tunnel are shown Figure 13. Air can be seen moving from left to right, sweeping the face of the tunnel and returning. The velocity of the air at each location can be seen on the contours. The air velocities measured at the selected points are given in Table XIV.
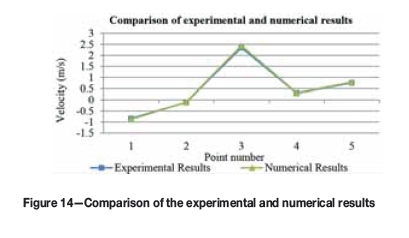
Comparison of the numerical and experimental results
A comparison of the numerical results with the experimental results is given in Figure 14. It can be seen that the numerical results are in line with the experimental results. The validation study showed that the ANSYS Fluent k-e realizable model is suitable for studying the ventilation of empty headings using ducted fan systems.
Conclusion
To understand the effect of the system variables associated with ducted fan systems on the ventilation of an empty heading, mathematical models were developed using CFD, and comparative analysis. The results showed that recircu-lation for a forcing ducted fan system can be reduced by increasing the duct diameter and by using a duct mouth to face distance of not less than 10 m. Increasing the duct diameter, from 0.57 m to 0.76 m the and duct mouth to face distance from 8 m to 10 m reduced recirculation by approximately 20%.
The flow rate delivered by an exhausting ducted fan system can be increased by reducing the duct mouth to face distance (for a very small difference of 2-5% per 2 m reduction in distance), increasing the fan design flow rate (10% increase per 25% increase in design flow rate), or increasing the duct diameter (14-17% increase in flow rate with an increase in diameter from 0.76 m to 0.57 m).
The outcomes of the study will help ventilation engineers to select the optimum duct fan system required for sufficient ventilation.
Acknowledgments
The work presented in this paper is part of a PhD research study in the School of Mining Engineering at the University of the Witwatersrand. The authors would like to acknowledge the Wits Mining Institute (WMI), University of the Witwatersrand, for making the Digital Mine facility available for the research, and the financial assistance required to purchase the high-performance PC and the CFD software.
References
AMC Consultants Pty Ltd. 2005. Basic Mine Ventilation, Revision 5. http://wenku.baidu.com/view/3a566fb769dc5022aaea00b6.html [Accessed: 2 July 2014]. [ Links ]
ANSYS® Academic Research. 2015. Release 15.0, Help System, ANSYS Fluent Theory Guide, Chapter 4. [ Links ]
Bise, C.J (ed.). 2013. Modern American Coal Mining: Methods and Applications. Society for Mining, Metallurgy and Exploration, Inc., Englewood, Colorado. [ Links ]
Creedy, D.P. 1996. Methane prediction in collieries. Report COL 303. Safety in Mines Research Advisory Committee (SIMRAC), Johannesburg. June 1996. [ Links ]
Dubinski, J., Krause, E., and Skiba, J. 2011. Global technical and environmental problems connected with the coal mine methane. Proceedings of the 22nd World Mining Congress and Expo 2011, Istanbul, Turkey, 11-16 September. [ Links ]
Feroze, T. and Phillips, H.W. 2015. An initial investigation of room and pillar ventilation using CFD to investigate the effects of last through road velocity. Proceedings of the 24th International Mining Congress and Exhibition of Turkey (IMCET15), Antalya, Turkey, 14-17 April. Chamber of Mining Engineers of Turkey. pp. 970-977. [ Links ]
Goodman, G.V.R., Taylor, CD., and Thimons, E.D. 1992. Jet fan ventilation in very deep cuts - a preliminary analysis. Report of Investigations 9399. US Bureau of Mines, US Department of the Interior, Pittsburgh, PA. pp. 1-12. [ Links ]
Kissell, F.N. 2003. Handbook for Methane Control in Mining. US Department of Health and Human Services, National Institute for Occupational Safety and Health. Pittsburgh Research Laboratory. [ Links ]
McPherson, M.J. 1993. Subsurface Ventilation and Environmental Engineering. Chapman & Hall, New York. [ Links ]
Pawinski, J. and Roszkowski, J. 1985. Emission of methane into mine galleries driven in coal by means of combined cutter-loaders. Archives of Mining Science, vol. 30, no. 2. pp. 207-213. [ Links ]
Phillips, H.R. 2015. Lessons learnt from mine explosions. Proceedings of the Australian Mine Ventilation Conference. Sydney, NSW, 31 August-2 September 2015. pp.19-28. [ Links ]
Phillips, H.R., and Brandt, M.P. 1995. Coal mine explosions - risk and remedy. Proceedings of the SIMRAC Symposium, Johannesburg, 1 September 1995. Southern African Institute of Mining and Metllurgy, Johannesburg. pp. 15. [ Links ]
Reed, W. and Taylor, C. 2007. Factors affecting the development of mine face ventilation systems in the 20th century. Proceedings of the Society for Mining, Metallurgy and Exploration (SME) Annual Meeting and Exhibit, Denver, Colorado, 25-28 February 2007. [ Links ]
Schultz, M.J., Beiter, D.A., Watkins, T.R., and Baran, J.N. 1993. Face ventilation investigation: Clark Elkorn Coal Company. Investigative Report no. P385-V286. Pittsburgh Safety and Health Technology Center, Ventilation Division. [ Links ].
Szlazak, N., Szlazak, J., Tor, A., Obracaj, A., and Borowski, M. 2003. Ventilation systems in dead end headings with coal dust and methane hazard. Proceedings of the 30th International Conference of Safety in Mines Research Institutes, Johannesburg, 5-9 october. South African Institute of Mining and Metallurgy, Johannesburg. pp. 673-688. [ Links ]
Taylor, C.D., Rider, J.P., and Thimons, E.D. 1997. Impact of unbalanced intake and scrubber flow on face methane concentrations. Proceedings of the 6th International Mine Ventilation Congress. Pittsburgh, Pennsylvania, 17-22 May. pp 169-172. [ Links ]
Thorp, N. 1982. Auxiliary ventilation practice. Environmental Engineering in South African Mines. Burrows, J. (ed.). Cape and Transvaal Printers, Cape Town. [ Links ]
Torano, J., Torno, S., Menendez, M., Gent, M., and Velasco, J. 2009. Models of methane behaviour in auxiliary ventilation of underground coal mining. International Journal of Coal Geology, vol. 80, no. 1. pp. 35-43. [ Links ]
Paper received Mar. 2016
Revised paper received Oct. 2016

