


Services on Demand
Article
 English (pdf)
 Article in xml format
 Article references
Indicators

Related links
-
 Cited by Google
 -
 Similars in Google
Share

 Permalink
Journal of the Southern African Institute of Mining and Metallurgy
On-line version ISSN 2411-9717
Print version ISSN 2225-6253
J. S. Afr. Inst. Min. Metall. vol.117 n.2 Johannesburg Feb. 2017
http://dx.doi.org/10.17159/2411-9717/2017/v117n2a6
WITS SPECIAL EDITION - VOLUME II
Optimization of cut-off grades considering grade uncertainty in narrow, tabular gold deposits
C. Birch
School of Mining Engineering, University of the Witwatersrand South Africa
SYNOPSIS
Mineral reserve statements as well as optimizing mine planning require a block model with grades for each mining block. A cut-off grade is determined by considering the mining costs as well as the expected revenue for each block. These grades are estimated using various techniques, but in reality there is uncertainty in the grade values. These uncertainties result in two types of error. A type I error is where material is classified as ore and mined, but the true value is below the cut-off grade and the material is therefore waste. This material constitutes dilution. The type II error is where material is estimated to be below the cut-off grade and is classified as waste, whereas the true grade is actually above the cut-off grade. This material is not mined and the value is lost.
This research considers the value of the lost ore and the costs of dilution under various degrees of uncertainty. Simulation using @Risk and mixed integer linear programing (Excel Solver) is used in a financial optimizer model to maximize either profit or net present value. This is applied to four Witwatersrand tabular gold deposits to investigate the impact of block grade uncertainty on cut-off grades.
When optimizing for profit, value may be added by adjusting the cutoff grade slightly downwards. When optimizing for NPV, value may be added by lowering the cut-off grade significantly for the lower discounting rates. At higher discount rates, the lowering of the cut-off grades should be reduced, and in some cases an increase in cut-off grade may be required. Each mine reacted differently to the optimization and thus there is no single rule that can be applied across all tabular Witwatersrand gold deposits.
Keywords: uncertainty, type I error, type II error, cut-off grade, optimization, profit, NPV; simulation, mixed integer linear programing.
Introduction
The basics of the cut-off grade theory are described in Hall's 'Cut-off Grades and Optimising the Strategic Mine Plan' (Hall, 2014). This book is a comprehensive study of the various techniques currently used in the mining industry. It includes various measures of value, including optimizing the discounted cash flow (DCF) and net present value (NPV). Lane (1988) in 'The Economic Definition of Ore' describes the economic principles of how cut-off grades are derived and how they can be optimized at various stages of a mine's life. Minnitt (2004) looked at how Lane's cut-off grade calculations were being adapted to Wits-type gold mines and found that the application of the NPV criterion for determining and optimizing value in mining operations was limited. He considered NPVs at various points in the value chain (mining, processing, and marketing) to determine a balanced cut-off grade. Both Lane and Minnitt consider the NPV calculated over the life-of-mine, rather than short-term profitability, as the primary measure of value. Krige and Assibey-Bonsu (1999) considered how uncertainty affects the overall tonnage above cut-off grades for valuation purposes.
One of the commonly applied methods used by some South African mining companies is to establish the break-even grade and apply this as the mining cut-off grade. The grades for each mining block are estimated from sampling the deposit and projecting the values into the area to be evaluated. Various techniques are used to do this, including nearest neighbour, inverse distance squared, and kriging. The estimated value is used to determine if a mining block is classified as ore or waste. There is, however, a degree of uncertainty regarding the estimated value due to sample spacing, deposit heterogeneity, and the method of estimation used. The sizes of the mining blocks exceed that of the smallest mining unit and thus the deposit can be mined selectively.
In statistics, accepting a hypothesis when it should have been rejected is a type I error. The converse error is rejecting a hypothesis when it should have been accepted. This is called a type II error (Underhill and Bradfield, 1994). These two errors can occur due to uncertainty in estimation. The type I error is where material is classified as ore and mined, although the true value is below the cut-off grade and thus this is waste material. This material is dilution. The type II error is where material is estimated to be below the cut-off grade and thus it is classified as waste, whereas the true grade is actually above cut-off grade. This material is not mined and is lost (Minnitt, 2015).
The purpose of this investigation is to determine what adjustment should be made to the cut-off grade to reduce the financial impact of dilution or lost ore in typical narrow, tabular Witwatersrand gold operations. There are three options available:
► Raise the cut-off grade to reduce the dilution - 'the old adage that a low-grade ton should never keep a high grade ton out of the mill' - (Minnitt, 2015)
► Keep cut-off grades the same considering that the type I and type II errors would balance each other if there is no bias
► Lower the cut-off grades to ensure all the value from the orebody is obtained (thus recovering a higher percentage of the lost ore).
All three options appear to have their supporters (Tolmay, 2016; Minnitt, 2016; Ackerman, 2016). There would appear to be no consensus, and no clear indication of how much the cut-off grade should be adjusted to take into consideration the uncertainty.
For this study, four South African gold mines were run through a simple financial optimizer. Various degrees of uncertainty for the block grades were considered. This uncertainty was introduced using @Risk software. The distribution of the uncertainty was assumed to be symmetrical and without bias (100% block factor). The databases used for this exercise were corrected for conditional bias and smoothing (Tolmay, 2014). The dispersion of the uncertainty was controlled using the standard deviation to give 5%, 6.7%, 10%, and 20% uncertainty.
The SAMREC Code sets out the minimum standards required for public reporting of Exploration Results, Mineral Resources, and Mineral Reserves in South Africa. Part of this Code controls the conversion of Mineral Resources to Mineral Reserves, with the potential for economical extraction being part of the requirements for classification as Reserves. The cut-off grade is therefore fundamental to how investors view the potential of an orebody when making their investment decisions (SAMREC, 2009).
Research background and context
The mining companies on which the study focused are those operating mines that exploit the narrow, tabular deposits which characterize the gold mines of South Africa. For this study, four individual mine block listings were selected, along with their corresponding ore flow and financial planning figures.
The highly variable grade distribution for South African gold mines means that not all the conglomerate targeted as potential ore resource is economical to mine. Mining companies use various approaches to determine what can be considered ore and mined, and what is left as waste. One of these approaches is to determine the break-even grade and apply this grade as a cut-off grade. This is assumed be a hard decision-making boundary for the purposes of this investigation. If a block has an estimated grade above the cut-off grade, it can be mined. If the grade of the block is below the cut-off grade, then it is left unmined. The break-even grade takes into account the price of the commodity, the expected mine recovery factor considering dilution, the unit cost to mine the ore, as well as the fixed costs for the mine. By using the planned extraction rate, the variable to break even then becomes the in situ grade of the material being sold. As long as the estimated grade is higher than the break-even grade in a particular mining block, the individual block can be considered as being profitable to mine and will add to maximizing profit.
Some mining companies apply the break-even grade principle to individual blocks and determine whether each individual block can be mined profitably. Other companies apply the break-even grade principle to the entire mineral resource or to selected areas of the mine, based on area costing and considering aspects like geometallurgy that can be unique for each distinct geozone. When using these approaches, the overall grade of the material being mined becomes the average grade of the blocks above the breakeven-derived cut-off grade. An alternative approach is to apply the pay-limit principle, where the overall mining grade required to break even financially is determined, and then the required profit margin is determined and added to the breakeven grade. The mine planners then control the mining mix to ensure the required grade is achieved.
These approaches, however, fail to consider the interaction between the mineral resource royalties as well as the South African gold tax formula, both of which vary depending on the overall profitability of the mine. As part of a research project into understanding the impact of the Mineral and Petroleum Resources Royalty Act of 2008 on gold mines, a revised approach to optimizing the value from gold mines was required (Birch, 2016). This approach considers the full cash flow and optimizes on the overall profit or NPV for the Measured and Indicated Resource considering the current planned economic and production profile for the mine. The financial optimizer uses mixed integer linear programing (Excel Solver) to maximize either profit or NPV by varying the cut-off grade, which in turn varies the overall tons and average grade above the cut-off grade. The approach is simple, robust, and constitutes a tool that is useful for quickly assessing the impact of grade uncertainty without requiring extensive information for each of the mines in the study.
The starting point for the financial model utilized in this study is the block listing. This is created from the geological model and is a list of all the potential mining areas with their estimated grades and volumes. Figure 1 shows a gradetonnage curve for a typical tabular gold deposit based on a block model (Shaft D), typical of the type used for this study.
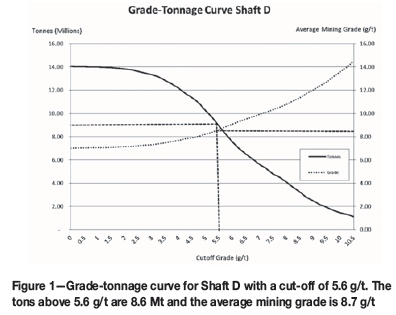
From the grade-tonnage curve, the relationship between the volume (tons) available for mining and the cut-off grade as well as the resultant average grade above the cut-off grade can be determined. The approach used for this study is to select various cut-off grades and use the financial optimization model to determine which combination of tons and average mining grade is optimal considering either profit or NPV at different discount rates.
Estimation uncertainty
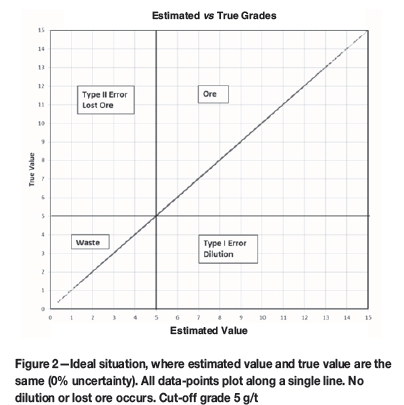
In an ideal world, the estimated value for a mining block and the true value would be the same. There would be no blocks estimated to be above cut-off grade that are actually below cut-off grade (type I error or dilution); neither would there be any blocks estimated to be below cut-off grade that are actually above cut-off grade (type II error or lost ore). This ideal relationship is shown in Figure 2.
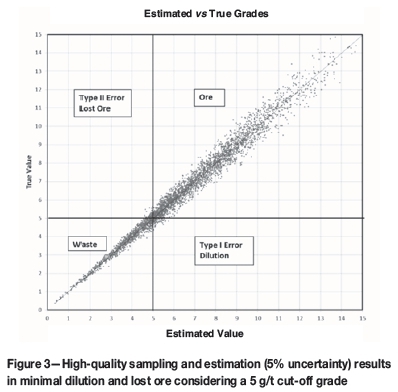
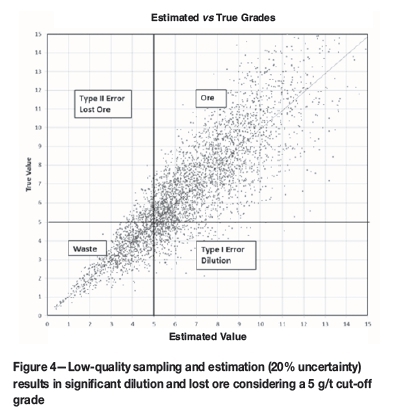
This is, however, not reality. The quality and accuracy of the sampling and estimation techniques used affect the uncertainty. The effect of low uncertainty (5%) and high uncertainty (20%) are shown in Figures 3 and 4 respectively. There are also limitations related to the cost of sampling, and the fact that a true grade will ultimately be determinable only after all the material has been mined and milled. The uncertainty of the estimated grade compared to the true grade has been generated using a symmetrical distribution around the estimated grade with variable standard deviations to change the dispersion of uncertainty. For this study, 0%, 5%, 6.7%, 10%, and 20% factors have been selected representing increasing uncertainty in the estimations.
Minnitt (2015) investigated the financial outcomes of poor sampling and grade distributions. For gold deposits, he found that a 10% sampling error has a negligible impact on the value of the deposit. However, he found positive and negative bias to have significant impacts on value. The databases from the mines used for this study have been corrected to reduce conditional bias and smoothing (Ackerman, 2016; Tolmay, 2014). No consideration was given to bias and the model has been set up to result in block factors between 99.5% and 100.5%.
Modelling exercise
Four individual mines have been used for comparison purposed. These are named shafts A-D for purposes of anonymity. The block lists obtained for these mines contain gold grades in centimetre-grams per ton (cm.g/t), channel width, expected stoping width, and area of the mining blocks. This block area needs to exceed the smallest mining unit size determined by the mine design approach being followed.
Larger sized blocks can often be split into smaller blocks as more sampling data becomes available and the grade model can be resolved to higher resolutions. However, for mine planning, the smallest block size planned must exceed the smallest mining unit or unplanned dilution may occur when it is extracted. The expected face grade was established for each block by dividing the cm.g/t by the expected stoping width to obtain the face grade in grams per ton (g/t). This expected face grade is the parameter used for optimization in this study. In practice, cm.g/t is often used directly but as this parameter is not widely used other than on South African gold mines, it has been converted to grams per ton for ease of explanation. From the area, stoping width, and specific gravity, the stope tons can be determined for each individual block.
The tons available for mining above cut-off grade as well as the average mining grade (AMG) above cut-off grade are determined from the block listing for inputs into the financial optimizer. The optimizer also requires the ratio of tonnage from stope faces to the total expected tonnage milled, which is obtained from the mine's planned ore flow. This ore flow takes into account face tonnage, gully dilution and other sources of dilution, historical discrepancies, and how much development waste will be hoisted and milled with the ore. The ore flow also uses the historical mine call factor (MCF) and plant recovery factor (PRF) to calculate the planned mine recovery factor (MRF) for use in the financial model. Revenue is derived from the recovered gold, the planned gold price, and the expected exchange rates. The mining costs used include the fixed and variable costs for the mine considering the expected production rate.
For this study, a model has been developed that can optimize either for profit (0% discount rate) or for NPV. Optimizing on NPV can drive decision-making to focus on the short-term gains at the expense of the longer term, and thus companies often use the total undiscounted cash flow (Hall, 2014). The cut-off grade optimized for NPV is higher than that obtained when optimizing for profit. Due to discounting, the NPV optimization model favours high-grading mining. This results in a shorter life-of-mine and less extraction of the resource (Birch, 2016).
The discount rate used for the calculation of the DCF and resultant NPV is critical to the cut-off grade calculation. This discount rate is essentially the cost of capital and it is usually calculated by the weighted average cost of capital (WACC). This considers all the sources of capital required for a project (equity and debt), the portion of the total each source contributes, and its cost. The various sources are then weighted by their proportions and an average is calculated. According to Smith et al. (2007), real discount rates of 912% for mining projects are appropriate for South African mining projects. This is equivalent to 14.5-17.6 % at a 5% annual inflation rate for WACC in nominal terms (Smith et al., 2007). For this study, costs and income parameters were kept constant and real discount rates of 9% and 12% were used for the NPV optimizer model.
The commodity price, exchange rate, and costs for the mines are based on figures supplied by the mines and used in the 2015 planning cycle. The individual companies used for this research have different considerations for the costs they include in their cut-off calculations. The supplied costs were used to enable the cut-off grade results obtained from this exercise to be compared with those used by the mines for their 2015 planning cycle. These mining costs are based on mining/milling figures and are assumed to represent an optimal rate of mining considering the constraints for each individual operation. This method assumes that the milling volume is achievable, or the total unit cost (fixed costs with unit variable cost) will be incorrectly estimated. The optimized cut-off grade obtained from the financial optimizer includes the estimated cost of the mineral resource royalty (refined rate) (South Africa, 2008) and income tax calculated using the gold tax formula (South Africa, 2011).
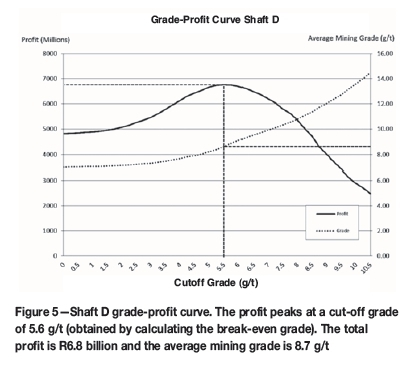
The AMG is the average grade of the material above the cut-off grade and becomes the planning grade. The relationship between peak profits tons above cut-off grade, and AMG for Shaft D is shown in Figure 5.
The optimizer uses mixed integer linear programing (Excel Solver). The Solver function built into Microsoft Excel (Meissner and Nguyen, 2014) has been selected for this study due to its availability to all users of Excel. The variable for the Solver function is the cut-off grade, and the function is set up to optimize the cut-off grade to maximize either the resultant profit or NPV from the cash flow. The model runs through a series of cut-off grades, with the resultant AMG and available tons above cut-off grade being determined for each individual cut-off grade. Solver then selects the cut-off grade that results in the highest NPV. The financial model was limited to a maximum of 20 years. Due to the discounting, income after 20 years has very little impact on the overall NPV.
Results
Dilution versus lost ore value
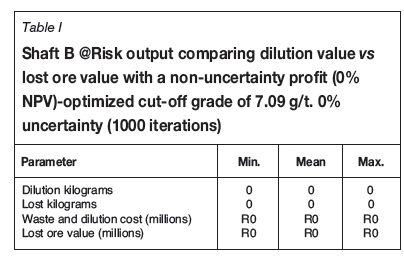
The first exercise did not use the financial optimizer. Additional columns were added to the block list to determine the profit and loss for each block based both on the original estimated grade as well what is achieved using a simulated true grade considering various degrees of uncertainty. The model uses @Risk and replaces the planned grade with a grade selected from a normal distribution with different levels of uncertainty. The model uses 1000 iterations. This number was selected to ensure a representative spread of values and exceeds the number used by @Risk if using the automatic function, which runs until a stable output is obtained. The results for Shaft B are shown in Tables I-V.
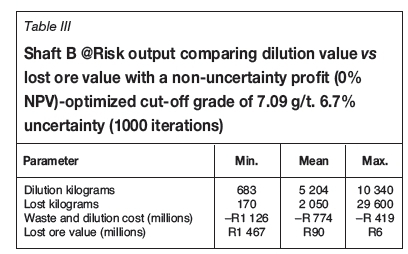
In Table I, there is no uncertainty in the model and thus the value of the dilution and the lost ore is zero. In Tables II to V, progressively higher uncertainty is applied and thus the amounts of ore and waste included in the type I and type II errors become significantly greater. The cut-off grade used for this exercise is 7.09 g/t, which is the cut-off grade obtained for this mine when optimized for profit (0% NPV), and no uncertainty is considered.
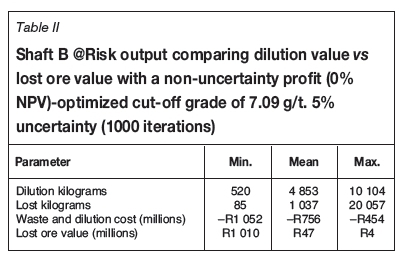
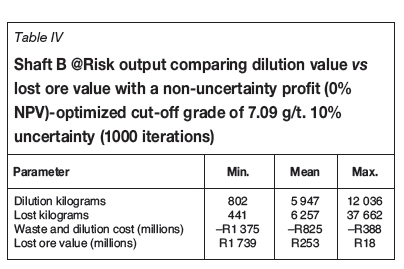
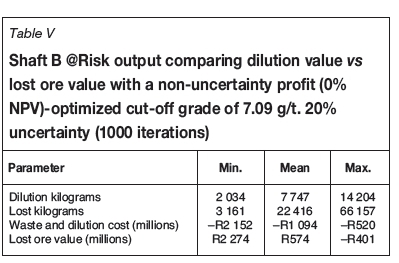
What is immediately apparent from this exercise is the high value lost due to type II error. When the uncertainty is 5%, this figure is R47 million. When the uncertainty is set to 20%, the value lost increases to R574 million. Figure 6 shows the relationship between the waste and dilution cost and lost ore for Shaft B with 10% uncertainty at different cut-off grades (0.5 g/t intervals). The difference line shown in the graph represents the difference between the waste and dilution cost for a particular cut-off grade and the lost ore.
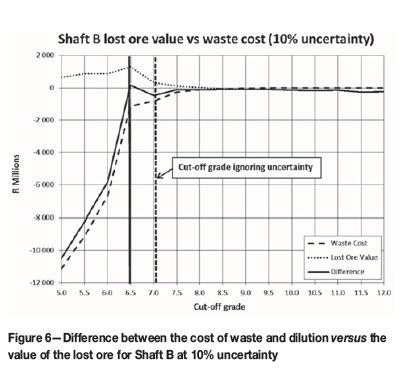
The difference peaks at 6.5 g/t. This indicates that lowering the cut-off grade from 7.09 g/t to 6.50 g/t could add value. It must be noted, however, that this approach considers just the direct mining costs. Similar trends are noted for shafts A, C, and D.
Mineral resource royalty costs are not included as these vary with overall profitability and not the profitability of the individual blocks. Income tax is also not considered in this calculation as it is paid only on taxable income (profit) and also varies depending on the overall profitability of the mine and not of individual blocks. As a result of these limitations, a different approach was selected to identify whether this lost value could be recovered by optimizing the cut-off grade using mixed integer linear programing (Excel Solver). This approach also allows the introduction of the time value of money (TVM) and optimizing for NPV.
Cut-offgrade optimization exercise
The model was set to replace the estimated block value with a value determined by @Risk, similar to the first approach. The Solver function was then run to optimize the cut-off grade considering the various levels of sample uncertainty. This exercise was run five times for each scenario considering optimization for profit (0% NPV) as well as for NPV at 9% and 12%. The average optimized cut-off grade, NPV, and type I and type II error tons and kilograms were recorded from the five runs. Figure 7 displays how the cut-off grade for each of the four shafts varies when considering the uncertainty of the block values when optimized for profit (0% NPV).
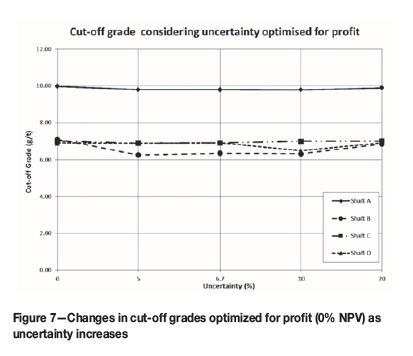
In Figure 7, it is observed that for shafts A, B, and D, there is a benefit to be gained by dropping the cut-off grade slightly (by an average of 2%, 10%, and 2% respectively) when uncertainties of 5%, 6.7%, and 10% are used. For 20% uncertainty, the cut-off grade should remain unchanged from the initial estimation that was determined without considering uncertainty. For Shaft C there is no benefit in altering the cut-off grades.
Figure 8 shows the optimized cut-off grades when optimizing for 9% NPV.
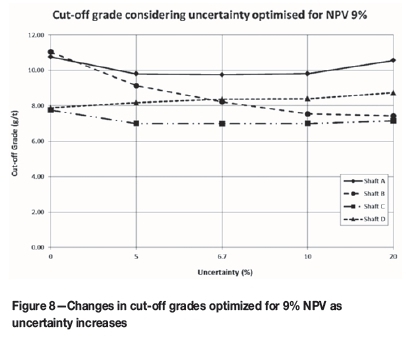
For shafts A, B, and C, the optimization indicates that it is beneficial to lower the cut-off grade (by an average of 7%, 27%, and 10% respectively) as uncertainty increases. As uncertainty increases towards 20%, the cut-off grade for Shaft A should be increased back to the original value. There will be a slight benefit if the cut-off grade is raised by 7% on average.
Figure 9 shows the optimized cut-off grades when optimizing for 12% NPV.
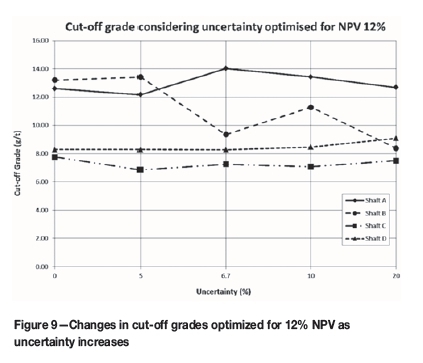
When the discount rate used to determine the NPV is raised to 12%, the trend to lower cut-off grades for Shaft A is reversed for 6.7% and 10% uncertainty and the cut-off grade should be increased on average by 4%. The trend still holds true for shafts B and C (where the cut-off grade should be reduced on average by 20% and 8% respectively), and Shaft D's cut-off should be raised by an average of 3% .
Of the four shafts analysed, the greatest benefit in utilizing an optimized cut-off grade when optimizing for profit or NPV 9% is realized at Shaft B. When optimizing for 12% NPV there is no real NPV benefit to be gained for any of the shafts by altering the cut-off grade, considering the uncertainty.
Table VI provides a summary of the optimizing exercise.
The trend that can be observed from Table VI is that when optimizing for profit (NPV 0%) and for NPV 9%, value can be gained by considering the uncertainty of the block grade estimations. In almost all cases, the increased value is obtained by reducing the cut-off grades; the exception being Shaft D, where benefit is gained by increasing the cut-off grade when optimizing for NPV 9%. If optimizing using 12% to determine the NPV, then using the original cut-off grade is preferable as there is generally loss of value by increasing or decreasing the cut-off grade.
Conclusions
South African tabular-reef gold mines are deep and subject to highly variable gold grade distributions (Sichel, Kleingeld, and Assibey-Bonsu, 1992). Even with high-quality sampling, there are differences found between the estimated grades for mining blocks (used for planning purposes) and the actual values (which determine revenue from a block). Some mining companies make use of cut-off grades to determine which portions of the deposit are ore and which are waste. Due to the uncertainty in the estimated grade, type I and type II errors occur. A type I error is when a block has an estimated grade above the cut-off grade, but the actual grade is below the cut-off grade. This block is mined at a loss and is dilution. A type II error occurs when a block has an estimated grade below the cut-off grade and is thus not mined. However, the actual grade is above cut-off grade and this ore is lost.
This study considered how the cut-off grade could be adjusted to minimize either waste dilution or lost ore, considering grade uncertainties. There appears to be no consensus and no clear indication as to how the cut-off grade should be adjusted considering this uncertainty, following discussions with academics and people in industry. The approach used for this study was to introduce uncertainty into the database using @Risk and optimize the resultant 'actual' grades through a cash flow model with mixed integer linear programing (Excel Solver). This optimization can be either on profit (0% NPV) or NPV (with 9% and 12 % discount rates). Four different mines were run through the model to compare results and identify trends. The block models as well as financial parameters were based on the 2015 planning cycle. The assumptions regarding the uncertainty introduced were that the distribution of the 'actual' grade is symmetrical around the estimated grade for each block, and that there is no bias. The amount of uncertainty selected for this study ranged from 5-20%.
It was found that when optimizing for profit, three of the four mines would benefit from a reduction in the cut-off grade ranging from 2-10%. The other mine would not benefit from any change in the cut-off grade.
When optimizing for 9% NPV, three of the four mines would benefit from a reduction in the cut-off grade between 7-27%. The fourth mine would benefit by increasing the cutoff grade by 7%. When optimizing the NPV at 12%, one mine would benefit from an 8% decrease in the cut-off grade. However, the NPV benefit is only 1.3%. The other three mines would not benefit from adjusting the cut-off grades, and in two of the cases, using the model actually results in lower NPVs.
Profit and NPV are not the only measures of value. Providing employment and generating revenues for the State are also important for stakeholders other than investors. Lowering cut-off grades is beneficial for these groups and it increases the life-of-mine since more ore is available above the cut-off grade. Investors would further benefit from the increase in mineral reserves.
The financial optimizer model used for this research is simple to create and follows well-proven cut-off grade determination methods. The incorporation of the cash flow, including mineral resource royalties and income tax formulae, adds another tool for mine planners to utilize in maximizing value from their operations. This financial model is easy to adapt to include a variety of uncertainty, and has been used in this example to investigate how block grade uncertainty can affect cut-off grades. Each mine is unique, and grade uncertainty should be modelled individually to determine if there is any benefit in adjusting the cut-off grade. The accuracy of the optimizer model would be increased by using the actual distribution of uncertainty. Any sampling bias could also be included in the model if it occurs on the mine. This would indicate in which direction cut-off grades should be adjusted to minimize the adverse effects of dilution or to recover lost ore.
References
Ackerman, J. 2016. Suggested adjustments to cut-off grade considering uncertainty [Interview] (February 2016). [ Links ]
Birch, C. 2016. Impact of discount rates on cut-off grades for narrow, tabular gold deposits. Journal of the Southern African Institute of Mining and Metallurgy, vol. 116, no. 2. pp. 115-122. [ Links ]
Birch, C. 2016. Impact of the South African mineral resource royalty on cut-off grades for narrow, tabular Witwatersrand gold deposits. Journal of the Southern African Institute of Mining and Metallurgy, vol. 116, no. 3. pp. 237-246. [ Links ]
Hall, B. 2014. Cut-off grades and optimising the strategic mine plan. Spectrum Series 20. Australasian Institute of Mining and Metallurgy, Carlton, Victoria. [ Links ]
Krige, D. and Assibey-Bonsu, W. 1999. Use of direct and indirect distributions of selective mining units for estimation of recoverable resource/reserves for new mining projects. Colorado School of Mines. [ Links ]
Lane, K.F. 1988. The Economic Definition of Ore. Mining Journal Books, London. [ Links ]
Meissner, J. and Nguyen, T. 2014. Meiss Research Group. An introduction to spreadsheet optimization using Excel Solver. http://wiww.meiss.com/download/Spreadsheet-Optimization-Solver.pdf [Accessed 2 December 2014]. [ Links ]
Minnitt, R. 2004. Cut-off grade determination for the maximum value of a small Wits-type gold mining operation. Journal of the South African Institute of Mining and Metallurgy, vol. 104, no. 5. pp. 277-283. [ Links ]
MINNITT, R. 2015. Poor sampling, grade distributions, and financial outcomes. Proceedings of Mine Planning and Equipment Selection (MPES) 2015, Sandton, South Africa, 11 November. Southern African Institute of Mining and Metallurgy, Johannesburg. pp. 133-147. [ Links ]
MINNITT, R. 2016. Suggested adjustments to cut-off grade considering uncertainty. [Interview] (February 2016). [ Links ]
SAMREC. 2009. South African Mineral Resource Committee. The South African Code for Reporting of Exploration Results, Mineral Resources and Mineral Reserves (the SAMREC Code). 2007 Edition as amended July 2009. http://www.samcode.co.za/downloads/SAMREC2009.pdf [Accessed 4 March 2013]. [ Links ]
Sichel, H.S., Kleingeld, W.J., and Assibey-Bonsu, W. 1992. A comparative study of three frequency-distribution models for use in ore evaluation. Journal of the South African Institute of Mining and Metallurgy, vol. 92, no. 4. pp. 91-99. [ Links ]
Smith, G.L., Pearson-Taylor, J., Anderson, D.C., and Marsh, A.M. 2007. Project valuation, capital investment and strategic alignment-tools and techniques at Anglo Platinum. Journal of the Southern African Institute of Mining and Metallurgy, vol. 107. pp. 67-74. [ Links ]
South Africa. 2008. Mineral and Petrolium Resources Royalty Act 2008. http://www.info.gov.za/view/DownloadFileAction?id=92824 [Accessed 4 March 2013]. [ Links ]
South Africa. 2011. Guide for tax rates/duties/levies (2010/2011 and prior years). http://www.wvdw.co.za/wvdwcorporate/TaxRatesDutiesLevies201011andprior9Nove mber 2010[1].pdf [Accessed 4 March 2013]. [ Links ]
Tolmay, L. 2014. On the reduction of algorithmic smoothing of kriged estimates. Journal of the Southern African Institute of Mining and Metallurgy, vol. 114, no. 8. pp. 667-672. [ Links ]
Tolmay, L. 2016. Suggested adjustments to cut-off grade considering uncertainty [Interview] (March 2016). [ Links ]
Underhill, L. and Bradfield, D. 1994. IntroSTAT. 5th edn. Juta, Cape Town. [ Links ]
Paper received Jun. 2016
Revised paper received Nov. 2016

